Ethereum Exchange Deposits Hit A Six-Month High: Panic Selling Or Structural Reset?

bitcoinistPublished on 2026-02-26Last updated on 2026-02-26

Abstract

Ethereum is experiencing sustained selling pressure amid a broader shift toward caution and panic in crypto markets. A key on-chain metric shows the number of unique deposit addresses to Binance surged to a six-month high, rising from 360,000 to over 450,000. This often signals potential selling intent, as assets moved to exchanges are easier to liquidate. However, such spikes can also reflect hedging, margin replenishment, or derivatives activity rather than outright selling. The increase coincides with a sharp price decline from October's peak near $4,900 to around $1,900. This may indicate retail capitulation or traders adding collateral to avoid liquidations. While elevated deposits raise near-term volatility and selling risk, such spikes have historically occurred near market bottoms. Technically, ETH is testing key support near $1,900 and the 200-week moving average—a level critical for medium-term direction. The market remains fragile, with resistance overhead and volume patterns suggesting distribution rather than accumulation. A breakdown below support could lead to further declines, while stabilization may signal accumulation. Confirmation of a reversal requires reclaiming resistance levels and improved market participation.

Ethereum continues to face sustained selling pressure as broader crypto market sentiment shifts toward caution and, in some segments, outright panic. Price action has struggled to regain stability in recent weeks, with repeated rebound attempts failing to produce sustained upside momentum. Elevated volatility, tightening liquidity conditions, and persistent macro uncertainty have reinforced a defensive posture among both retail and institutional participants, leaving Ethereum vulnerable to further short-term weakness.

A recent CryptoQuant report provides additional context through on-chain activity. According to the data, the ETH Binance User Deposit Address metric has recorded a sharp increase. The number of unique addresses depositing Ethereum to Binance has surged from roughly 360,000 to more than 450,000, representing the highest level observed since August 2025. Metrics tracking deposit addresses often serve as a proxy for potential sell-side intent, since assets transferred to exchanges are typically more accessible for liquidation, collateral usage, or portfolio rebalancing.

However, such spikes do not automatically translate into immediate selling. In some cases, they reflect positioning adjustments, hedging activity, or preparation for derivatives trading. Even so, the scale of the recent increase suggests heightened market anxiety and warrants close monitoring as Ethereum navigates an increasingly fragile market environment.

Exchange Deposits Surge As Price Correction Deepens

The report highlights that this metric breakout has occurred alongside a severe price correction. Ethereum has declined sharply from its October peak near $4,900 to roughly the $1,900 region. The simultaneous drop in price and surge in exchange deposit addresses suggests two primary on-chain interpretations that merit careful consideration.
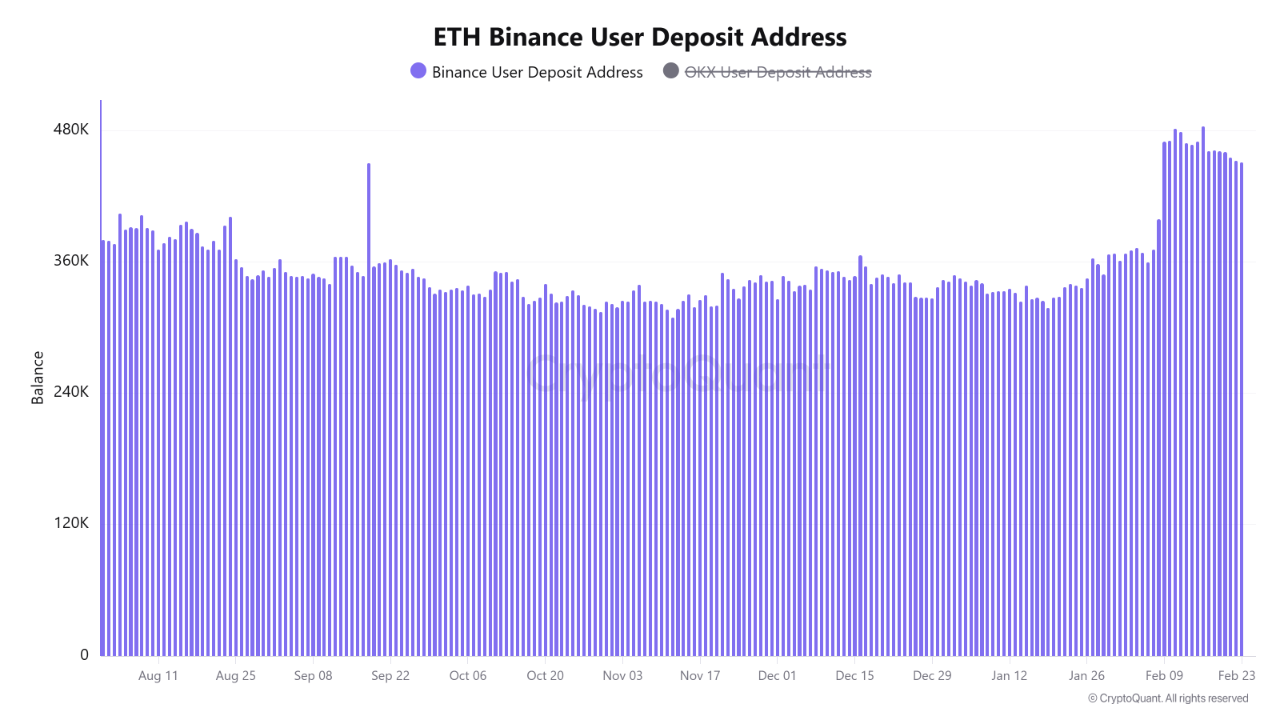
Ethereum Binance User Deposit Address | Source: CryptoQuant

The first scenario points to retail capitulation. A rapid increase in unique depositing addresses often reflects panic behavior among smaller investors. Participants who held through earlier stages of the decline may now be transferring assets to exchanges to exit positions, reinforcing short-term sell-side pressure.

The second interpretation relates to derivatives market positioning. With ETH trading below the $2,000 threshold, some deposits likely represent collateral replenishment. Traders facing liquidation risk may be adding margin to maintain leveraged long positions rather than outright selling their holdings.

In the near term, increased deposits elevate potential supply on exchanges, which can intensify volatility if selling materializes. However, historically, extreme spikes in deposit activity have frequently appeared during late-stage corrective phases. Such conditions sometimes precede seller exhaustion.

Monitoring exchange outflows, spot volume absorption, and derivatives positioning will be critical to determine whether this activity signals continued downside risk or the early formation of a local market bottom.

Ethereum Tests Structural Support As Downtrend Persists

Ethereum continues to trade under sustained pressure, with the weekly chart showing a clear loss of bullish momentum following the rejection near the $4,800–$5,000 region. Price has now retraced toward the $1,900 area, a zone that previously acted as consolidation support during earlier cycle phases. The inability to hold above the mid-cycle moving averages suggests that sellers still maintain structural control.
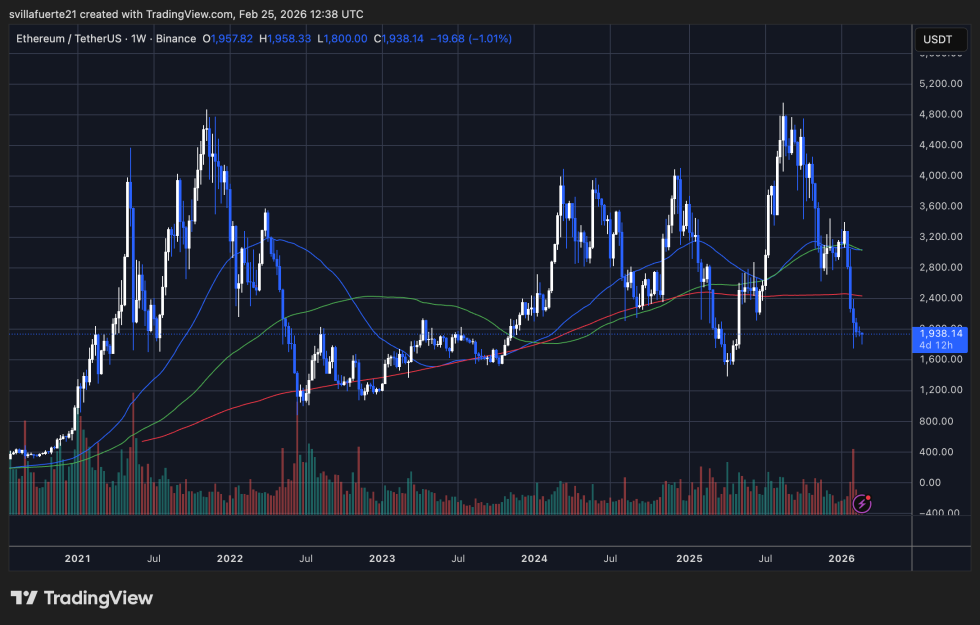
ETH testing critical price level | Source: ETHUSDT chart on TradingView

The 50-week moving average has rolled over and now acts as overhead resistance, while the 100-week average appears to be flattening. Meanwhile, price is approaching the longer-term 200-week moving average, a level historically associated with major cyclical support. A decisive breakdown below this region could expose deeper downside, whereas stabilization here may encourage medium-term accumulation.

Volume patterns indicate intermittent spikes during declines, which typically reflect distribution rather than sustained buying interest. This reinforces the interpretation of a defensive market phase rather than a confirmed recovery trend.

Despite the weakness, volatility compression near long-term averages sometimes precedes transitional periods. Confirmation, however, would require sustained closes above reclaimable resistance levels and improving participation metrics. Until then, Ethereum remains in a fragile technical posture with risk skewed toward continued consolidation or downside drift rather than immediate bullish continuation.

Featured image from ChatGPT, chart from TradingView.com

Trending Cryptos

Related Questions

QWhat does the sharp increase in Ethereum Binance User Deposit Addresses suggest about market sentiment?

AThe sharp increase in Ethereum Binance User Deposit Addresses, which surged from roughly 360,000 to over 450,000, suggests heightened market anxiety and potential sell-side intent, as assets moved to exchanges are often more accessible for liquidation or portfolio rebalancing.

QWhat are the two primary on-chain interpretations for the simultaneous drop in Ethereum's price and surge in exchange deposits?

AThe two primary interpretations are: 1) Retail capitulation, where smaller investors panic and transfer assets to exchanges to exit positions, and 2) Derivatives market positioning, where traders deposit ETH as collateral to maintain leveraged long positions amid liquidation risks.

QWhat critical support level is Ethereum approaching on the weekly chart, and why is it significant?

AEthereum is approaching the 200-week moving average, a level historically associated with major cyclical support. A breakdown below this could expose deeper downside, while stabilization here might encourage medium-term accumulation.

QHow do volume patterns during Ethereum's decline reinforce the current market phase?

AVolume patterns show intermittent spikes during declines, which typically reflect distribution rather than sustained buying interest, reinforcing the interpretation of a defensive market phase rather than a confirmed recovery trend.

QWhat factors will be critical to determine whether the increased deposit activity signals continued downside risk or a potential market bottom?

AMonitoring exchange outflows, spot volume absorption, and derivatives positioning will be critical to determine if this activity signals continued downside risk or the early formation of a local market bottom.

Related Reads

Goldman Sachs: July Smashes Through Crowded Trades, U.S. Stock Bull Market Not Broken but Harder to Navigate

Goldman Sachs: July Sees Crowded Trades Unwound, U.S. Bull Market Intact but Getting Tougher. The U.S. stock market in July did not see an index-level crash, but rather a significant unwinding of speculative positions. While the S&P 500 remained stable—trading within a narrow 3.5% range and staying within 2% of its high—underlying market dynamics were volatile. Heavily crowded trades, particularly in high-momentum tech, AI-linked stocks, and Asian strategies, faced severe pressure and forced deleveraging. Data indicates this was a meaningful cleanse, not a minor adjustment. Global tech exposure saw its largest sell-off in over five years, leverage in Korean equity ETFs plummeted, and Goldman's prime brokerage recorded the largest gross exposure reduction since late 2022. Leverage on momentum factors among fundamental long/short clients fell to the 28th percentile of its one-year range. The AI trade narrative shifted from pure potential to a focus on tangible returns. While Meta failed to show clear AI monetization, Microsoft and Amazon provided evidence that massive capital expenditure is translating into scalable revenue and product growth, preventing a blanket sell-off of the AI sector. The Federal Reserve's more opaque communication style and volatility in long-end Treasury yields have introduced new friction, particularly for rate-sensitive growth and tech stocks. The broader outlook for U.S. equities remains favorable, supported by a strong economy, robust earnings, and substantial AI capital expenditure. However, risk/reward is no longer cheap, and the market's upward elasticity has weakened. The Nasdaq 100's trajectory—up 12% year-to-date despite significant pullbacks—illustrates that the bull trend persists but the path is becoming more difficult. The key lesson from July is that the market no longer rewards crowded, highly leveraged trades, requiring more disciplined and liquid portfolio approaches.

marsbit2h ago

Goldman Sachs: July Smashes Through Crowded Trades, U.S. Stock Bull Market Not Broken but Harder to Navigate

marsbit2h ago

Interview with Robinhood Executive: Meme + Tokenized US Stocks as "Barbell" Customer Acquisition Strategy, All Business Lines Achieve Hundreds of Millions in Revenue

Interview with Robinhood executive Johann Kerbrat reveals the company's "barbell" customer acquisition strategy for its new Robinhood Chain, combining meme tokens with tokenized stocks. Three weeks after mainnet launch, the chain has seen over $3B in weekly DEX volume and 105M transactions. Kerbrat explains the logic behind the permissionless chain: meme tokens attract DeFi users, while tokenized real-world assets (RWA), currently over 90 US stocks and ETFs accessible in 120+ countries, serve global users. The goal is to bring Robinhood's 27 million funded accounts on-chain by simplifying DeFi with a user-friendly interface, exemplified by features like Robinhood Earn which offers yield without requiring wallet management. Built on Arbitrum's technology stack for its speed, low cost, and Ethereum's security, the chain focuses on financial products like Earn, spot trading, and perpetuals. Kerbrat downplays direct competition with platforms like Base, emphasizing the goal of expanding the overall market for on-chain assets. He details selective partnerships (e.g., Morpho, Lighter) based on compliance, unique UX, and differentiation. While regulatory clarity is pending for US perpetuals, the expansion continues via Bitstamp in Europe. Finally, Kerbrat positions Robinhood as a "super app" integrating stocks, options, crypto, banking, and AI trading, with all major business lines generating hundreds of millions in revenue. For the chain, current priority is driving adoption over maximizing gas fee revenue.

marsbit4h ago

Interview with Robinhood Executive: Meme + Tokenized US Stocks as "Barbell" Customer Acquisition Strategy, All Business Lines Achieve Hundreds of Millions in Revenue

marsbit4h ago

Trading

Spot

Hot Articles

Discussions

Welcome to the HTX Community. Here, you can stay informed about the latest platform developments and gain access to professional market insights. Users' opinions on the price of ETH (ETH) are presented below.

活动图片