Ethena struggles as revenue falls 32% – Can demand save ENA at $0.089?

ambcryptoPublished on 2026-03-28Last updated on 2026-03-28

Abstract

Ethena's (ENA) financial performance weakened significantly in Q1 2026, with its price dropping to $0.089. Key metrics show a 32% decline in Gross Protocol Revenue to $65.06 million, attributed to reduced minting activity and staking rewards. Total Value Locked (TVL) also fell by approximately $130 million since March, indicating sustained capital outflows and declining user activity, which hit a low of around 1,200 daily active users. Despite a slight improvement in gross profit, it remains substantially lower than previous quarters. However, spot market data shows consistent accumulation, with $3.41 million in net inflows over three days, suggesting investor demand may provide some price support. Without a recovery in core fundamentals, significant upside potential remains limited.

Ethena’s [ENA] price now appears to be aligning with its weakening financial performance. Over the past 24 hours, the asset has recorded a double-digit decline, dropping to $0.089 at press time.

While the numbers reflect mounting pressure, a broader evaluation of market conditions is necessary to determine whether this decline marks the start of a deeper correction or a temporary adjustment.

Ethena’s momentum weakens across key metrics

On-chain data shows that ENA has underperformed across multiple fronts since the start of Q1 2026, particularly when compared to its performance in the previous two quarters.

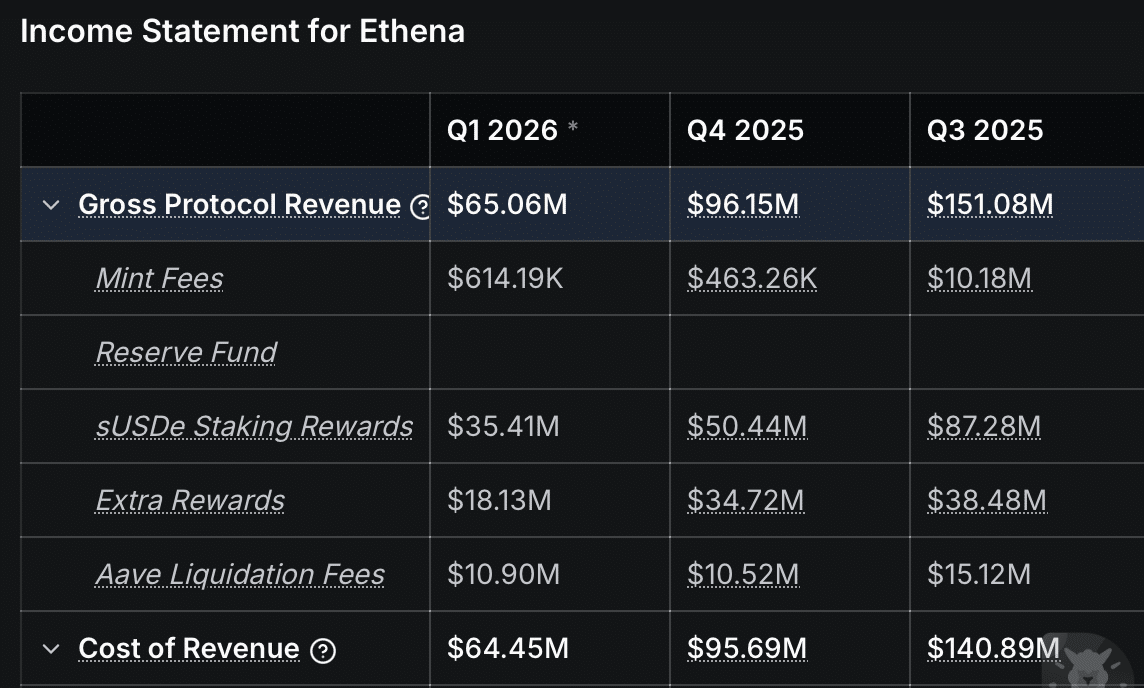
A key area of concern is revenue efficiency. Gross Protocol Revenue fell to $65.06 million, down from $96.15 million in Q4 2025, representing a 32% decline. The drop becomes even more pronounced when compared to Q3 2025.

This contraction points to weaker minting activity and reduced staking rewards, both of which suggest declining on-chain participation.

Source: DeFiLlama

In a market that has remained relatively stable compared to the October–December 2025 cycle, this underperformance raises concerns about weakening user demand rather than external pressure.

Liquidity conditions reinforce this trend. Total Value Locked (TVL), a core indicator of protocol health and user commitment, has continued to decline steadily.

Since the start of March 2026, TVL has fallen by approximately $130 million, bringing it to around $6.66 billion at the time of writing. Within the last 24 hours alone, roughly $16 million has been unstaked, signaling sustained capital exit from the protocol.

Can profit alone sustain user interest?

Despite the broader slowdown, Ethena has recorded a slight improvement in gross profitability.

In Q1 2026, the protocol has generated $614,190 in gross profit, compared to $463,200 in Q4 2025. While this reflects a marginal increase, it does little to offset the sharp decline from earlier performance levels.

For context, Q3 2025 saw $10.18 million in gross profit, roughly 16.5 times higher than current figures. This gap highlights a structural decline in earning potential, even as short-term profitability shows minor improvement.

The implication is clear, as modest profit growth alone may not be sufficient to retain users, especially in a competitive DeFi environment where capital quickly rotates toward higher-yield opportunities.

User activity data supports this view. According to Artemis, Daily Active Users have dropped to around 1,200, the lowest level recorded since December.

Spot demand offers a counter-signal

Despite weakening fundamentals and declining liquidity, spot market activity presents a more resilient picture. Exchange netflow data indicates that buying pressure has increased recently. Over the past 24 hours, net inflows into spot positions reached approximately $303,000.

More notably, this is not an isolated event. Over the past three days, cumulative purchases have climbed to around $3.41 million, suggesting consistent accumulation.

Source: CoinGlass

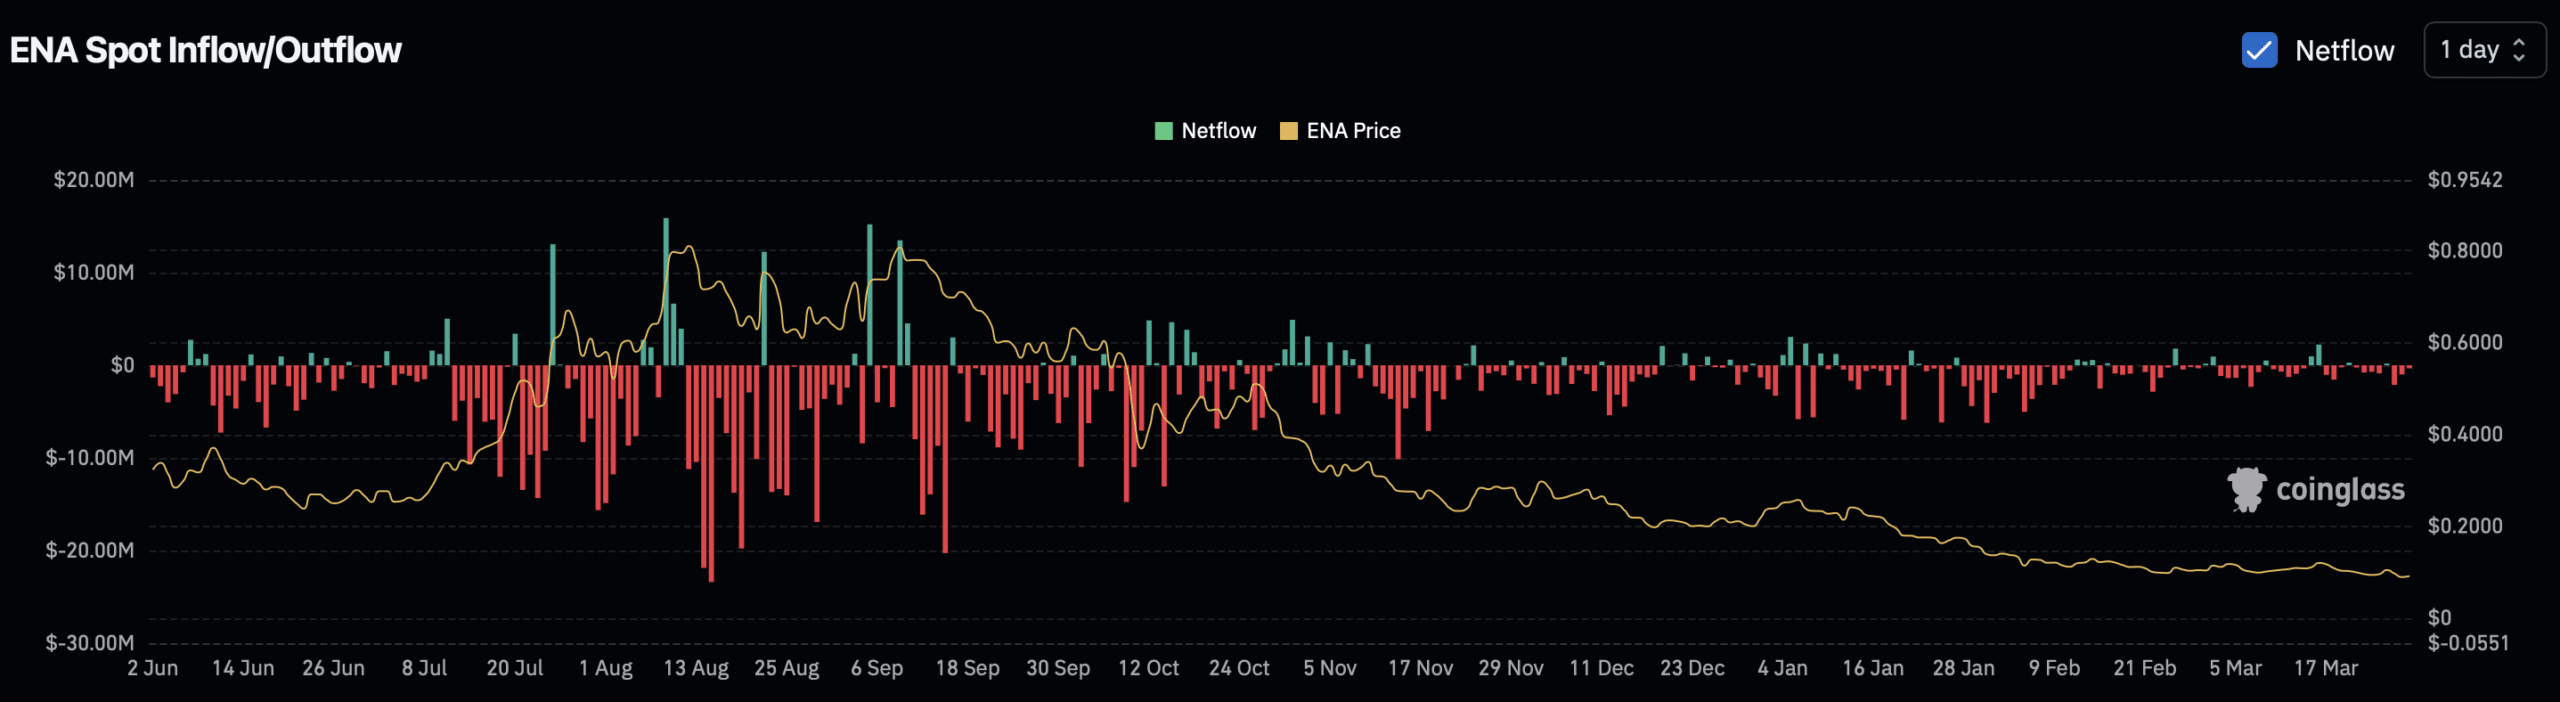
Such a sustained demand indicates that investors continue to absorb sell-side pressure, even as capital exits the protocol layer.

If this accumulation trend holds, it could limit further downside and support price stabilization. However, without a recovery in core fundamentals, particularly user activity and revenue generation, any upside may remain constrained within a narrow range.


Final Summary

  • Ethena’s protocol performance deteriorated in Q1 2026, even as broader market conditions remained relatively stable.
  • Spot investors continue to accumulate, despite rising liquidity outflows and declining TVL.

Related Questions

QWhat is the current price of ENA and how much has it declined in the last 24 hours?

AThe current price of ENA is $0.089, and it has recorded a double-digit decline over the past 24 hours.

QBy what percentage did Ethena's Gross Protocol Revenue fall in Q1 2026 compared to Q4 2025?

AEthena's Gross Protocol Revenue fell by 32%, dropping from $96.15 million in Q4 2025 to $65.06 million in Q1 2026.

QWhat does the decline in Total Value Locked (TVL) and the unstaking of funds indicate about the Ethena protocol?

AThe decline in TVL, including $16 million unstaked in 24 hours, signals sustained capital exit from the protocol, indicating weakening user commitment and health.

QDespite the broader slowdown, which financial metric showed a marginal improvement for Ethena in Q1 2026?

AGross profitability showed a marginal improvement, increasing to $614,190 in Q1 2026 from $463,200 in Q4 2025.

QWhat counter-signal does spot market activity provide against the weakening fundamentals?

ASpot market activity shows increased buying pressure, with net inflows of $303,000 in 24 hours and cumulative purchases of $3.41 million over three days, suggesting consistent accumulation by investors.

Related Reads

Saylor's Purchase of 1550 Bitcoin Is a Bad Trade

**Title: Saylor's Purchase of 1,550 Bitcoins Was a Bad Trade** The article critically analyzes Strategy's recent move of selling 32 bitcoins followed by a much larger purchase of 1,550 bitcoins. While appearing bullish, the author argues this trade is detrimental to MSTR shareholders. The core argument revolves around the concept of "breakeven modified Net Asset Value (mNAV)," a key metric for Strategy. To increase Bitcoin per share (BPS) for MSTR holders, Strategy must issue new shares at a premium high enough that the funds raised can buy more bitcoin than the bitcoin backing each existing share. Currently, this breakeven mNAV is estimated at 1.30. The recent trade failed on two counts: 1. The shares for the $181 million raise were issued at an mNAV *below* the 1.30 breakeven point. Selling "cheap" shares to buy bitcoin actually *reduces* BPS. 2. Only $101.3 million of the raised funds were used to buy bitcoin; the rest went to boost the company's dollar reserves. The breakeven mNAV calculation assumes *100%* of proceeds are used for bitcoin purchases. Diverting funds, even if mNAV were high, dilutes BPS. The result is an estimated 0.19% decrease in Bitcoin per share for MSTR holders. In exchange, Strategy merely extended its operational runway for its dollar reserves from ~6.3 months to 7 months. The author interprets this as Strategy prioritizing the survival and development of its STRC business over its stated core goal of increasing MSTR's BPS. This constitutes a gamble: if sacrificing MSTR value leads to improved market sentiment and a recovery in STRC's price (and thus mNAV), the whole system could work. If not, Strategy may be forced into a cycle of further diluting MSTR to stay afloat, potentially leading to deferred STRC dividends or corporate decline. The article concludes with a hope for price recovery for Bitcoin, MSTR, and STRC.

Foresight News3m ago

Saylor's Purchase of 1550 Bitcoin Is a Bad Trade

Foresight News3m ago

The AI Bear Market Lasting Two Days Is Over; Why Did Funds Buy Back Storage Stocks First?

After a severe two-day selloff in early June that erased over $1 trillion from U.S. chip stock market value, capital is flowing back first to the memory sector. The correction was not driven by a collapse in AI demand but rather a market reassessment of high expectations. Stocks like Broadcom faced selling pressure despite strong AI revenue guidance, signaling a shift in focus from who has an "AI story" to who can most rapidly translate AI demand into verifiable profits and earnings per share (EPS). Memory companies, such as Micron and SK Hynix, are leading the recovery because their EPS growth is more immediately verifiable. The AI server boom directly increases demand for high-bandwidth memory (HBM) and high-capacity server DRAM, tightening supply and driving up contract prices for conventional DRAM and NAND Flash. This price increase, coupled with a shift to higher-margin products, flows directly into near-term revenue and profitability, as evidenced in recent earnings reports. In contrast, other AI semiconductor segments like GPUs, ASICs, and optical modules, while central to the long-term AI infrastructure story, face longer and less certain paths to EPS validation. Their growth depends more on future product cycles, customer adoption timelines, and capital expenditure plans. The rebound in memory stocks highlights a market preference for assets with shorter, more transparent EPS conversion cycles following the recent de-risking phase. However, this does not negate the potential of other AI hardware segments should they provide clearer near-term order visibility. The episode has raised the validation bar for all AI-related investments.

marsbit3m ago

The AI Bear Market Lasting Two Days Is Over; Why Did Funds Buy Back Storage Stocks First?

marsbit3m ago

Monera Digital|Crypto Market May Report: Four Major Reasons Behind the Accelerated Decline

Monera Digital Crypto Market May Report: Four Key Reasons Behind the Accelerated Decline The crypto market experienced a significant downturn in May, driven by an internal liquidity crisis rather than external macro factors. Bitcoin fell from around $82,850 to $73,674, even as traditional markets rallied in the final week, highlighting a clear "liquidity transmission failure" specific to crypto. Four primary internal factors caused the accelerated sell-off: 1. **Major ETF Outflows:** U.S. spot Bitcoin ETFs saw a net outflow of $2.425 billion for the month, the third-largest monthly withdrawal since their launch. Ethereum ETFs also reversed to net outflows. This turned a key pillar of the bull run into a source of selling pressure. 2. **Holder Capitulation:** On-chain data showed textbook "surrender" patterns. The Short-Term Holder MVRV ratio fell below 1.0, indicating this cohort is now in aggregate loss. The Net Unrealized Profit/Loss (NUPL) metric also deteriorated significantly. 3. **Contagious Negative Sentiment:** The Coinbase Premium Index, which shows U.S. institutional buying/selling pressure, turned deeply negative for most of the month. This confirmed the ETF outflows and reflected a strategic shift away from crypto toward assets like U.S. Treasuries. 4. **Leverage Unwinding and Psychological Breaks:** Despite the downturn, futures open interest initially grew, signaling leveraged positioning. This culminated in a sharp deleveraging event with $307 million in long liquidations. Furthermore, the price broke below the critical $75K-$76K support zone, which is both a key gamma option level and the approximate average cost basis for major public companies holding Bitcoin, turning them from potential buyers into potential sellers. The report concludes that the market's pricing power has shifted from macro narratives to internal liquidation. While Bitcoin's 200-week moving average quantile has entered a historical "value zone" at 10.2%, this indicates a deep bear market reset is underway, not an immediate reversal. A sustainable recovery will require both a genuine improvement in the macro liquidity environment and clear signs of renewed on-chain demand, such as ETF inflows resuming and the Coinbase Premium turning positive. Until then, discipline and capital preservation are paramount.

marsbit14m ago

Monera Digital|Crypto Market May Report: Four Major Reasons Behind the Accelerated Decline

marsbit14m ago

Trading

Spot
Futures

Hot Articles

How to Buy ENA

Welcome to HTX.com! We've made purchasing Ethena (ENA) simple and convenient. Follow our step-by-step guide to embark on your crypto journey.Step 1: Create Your HTX AccountUse your email or phone number to sign up for a free account on HTX. Experience a hassle-free registration journey and unlock all features.Get My AccountStep 2: Go to Buy Crypto and Choose Your Payment MethodCredit/Debit Card: Use your Visa or Mastercard to buy Ethena (ENA) instantly.Balance: Use funds from your HTX account balance to trade seamlessly.Third Parties: We've added popular payment methods such as Google Pay and Apple Pay to enhance convenience.P2P: Trade directly with other users on HTX.Over-the-Counter (OTC): We offer tailor-made services and competitive exchange rates for traders.Step 3: Store Your Ethena (ENA)After purchasing your Ethena (ENA), store it in your HTX account. Alternatively, you can send it elsewhere via blockchain transfer or use it to trade other cryptocurrencies.Step 4: Trade Ethena (ENA)Easily trade Ethena (ENA) on HTX's spot market. Simply access your account, select your trading pair, execute your trades, and monitor in real-time. We offer a user-friendly experience for both beginners and seasoned traders.

4.2k Total ViewsPublished 2024.04.03Updated 2026.06.02

How to Buy ENA

Ethena: Building a New Era of Web3‑Native Digital Dollars

Ethena is an Ethereum‑based synthetic dollar protocol that delivers crypto‑native monetary solutions, including USDe, a synthetic dollar, and sUSDe, a globally accessible U.S. dollar savings asset.

53.2k Total ViewsPublished 2026.03.16Updated 2026.03.16

Ethena: Building a New Era of Web3‑Native Digital Dollars

Discussions

Welcome to the HTX Community. Here, you can stay informed about the latest platform developments and gain access to professional market insights. Users' opinions on the price of ENA (ENA) are presented below.

活动图片