Data Decrypts the BTC Cycle: Three Major Bottom Signals Illuminate Simultaneously, Q4 Could Be a Crucial Turning Point Window?

marsbitPublished on 2026-06-16Last updated on 2026-06-16

Abstract

"Decoding the Bitcoin Cycle: Three Bottom Signals Flash Simultaneously, Is Q4 the Key Turning Point?" The article analyzes Bitcoin's current market position, comparing it to historical cycles. BTC has corrected over 52% from its October 2025 peak of $126,198 to around $59,100 in June 2026. While significant, this drawdown is milder than the 77-86% declines seen in past bear markets. The analysis is framed within Bitcoin's four-year halving cycle. Past cycles show a pattern: prices peak 12-18 months post-halving, bottom 12-14 months after the peak, with lows typically occurring roughly 17 months before the next halving. Following the April 2024 halving and the October 2025 peak, this pattern suggests a potential bottoming window around Q4 2026, ahead of the expected 2028 halving. Three key on-chain metrics are signaling undervaluation: The MVRV Z-Score has dropped near 0.27, approaching historic bottom zones. The market price is only about 9% above the network's average realized price of ~$53,600, a rare low premium. Bitcoin's price recently touched its 200-week moving average (~$62,200), a level that aligned with bottoms in 2015, 2018, and 2020. While US spot Bitcoin ETFs saw record outflows in May/June 2026, indicating retail panic, whale addresses (holding 100+ BTC) reached a yearly high. Entities like MicroStrategy resumed buying, and long-term holders control a near-record 78% of the supply, suggesting accumulation. A major macro overhang was partially removed with a...

Author | jk

Last October, on the night BTC surged past $120,000, countless people screenshotted the chart and posted it on their social feeds, captioned with "History is being made." Just eight months later, the same people are staring at a price of $59,100, their social posts now asking, "Will it go lower?"

From the peak of $126,198 to the low of $59,100, BTC has experienced a drawdown of over 52%; in early June, the Crypto Fear & Greed Index plunged to 8, hitting its lowest level since 2022.

So, entering the market now—is it brave bottom-fishing, or just catching a falling knife?

In 2018, they said BTC would eventually go to zero; in 2022, they said the crypto industry was finished after the FTX collapse; and now in 2026, the narrative has shifted to "the four-year cycle is broken," "institutions only come to dump," and "risk assets have no place in a high-rate era." Every time, these narratives sound most convincing when prices are at their lowest.

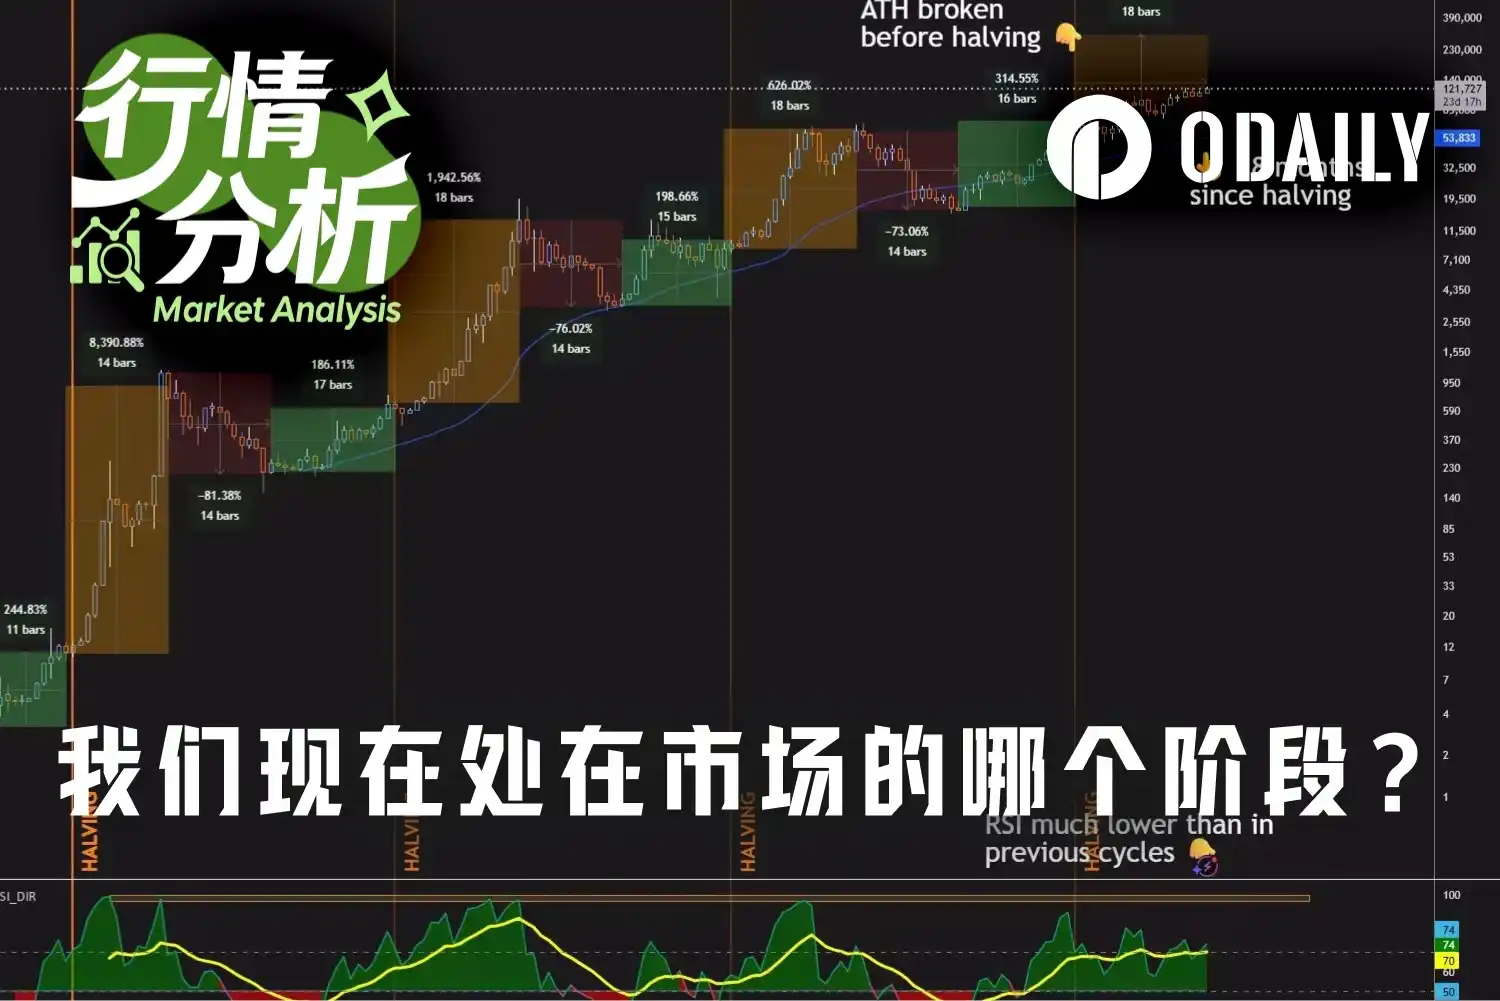
However, narratives are emotional, while data is neutral. Only by separating the two does our current position in the BTC cycle become clear. Let's examine together: where exactly are we in this BTC cycle?

Where Does a 52% Drop Rank in Historical Cycles?

On October 6, 2025, BTC touched its all-time high of $126,198. From that day to an intraday low of around $59,100 on June 5, 2026, this drawdown exceeded 52% from the peak.

A 52% drop sounds alarming, but compared to BTC's past three full bear markets, this figure is actually below the historical median. The 2014 bear market fell 86% from top to bottom, the 2018 one dropped 84%, and the 2022 bear saw a decline of about 77% from $69,000 to $15,479. The current maximum drawdown of approximately 52% so far is significantly milder than the previous three.

This means historically, it has always recovered from deeper declines. While this statement might seem simplistic, from a market confidence perspective, the fear associated with the current price likely exceeds the actual risk implied by the fundamentals.

This is precisely why they say market confidence is more precious than gold.

Four Halvings, Three Nearly Identical Curves

Understanding the current position is inseparable from the halving cycle framework.

BTC undergoes a halving approximately every four years, reducing the block reward for miners by half and contracting new supply. Surrounding each halving, the past three cycles have followed highly similar bull-bear rhythms: a peak occurs 12 to 18 months post-halving, followed by a bottom 12 to 14 months after the peak, with the bottom typically arriving about 17 months before the next halving.

  • First cycle: Halving in November 2012 when BTC was around $12. About 12 months later, in November 2013, the price peaked at $1,150. The subsequent bear market lasted roughly 13 months, bottoming around $160 in January 2015—about 18 months before the next halving in July 2016.
  • Second cycle: Halving in July 2016 when BTC was around $650. About 17 months later, in December 2017, the price peaked at $19,800. The subsequent bear market lasted about 12 months, bottoming around $3,200 in December 2018—again, about 17 months before the next halving in May 2020.
  • Third cycle: Halving in May 2020 when BTC was around $8,600. About 18 months later, in November 2021, the price peaked at $69,000. The subsequent bear market lasted about 13 months, bottoming around $15,500 during the FTX collapse in November 2022—once more, about 17 months before the next halving in April 2024.
  • Now, the fourth cycle: Halving on April 19, 2024, reducing the block reward from 6.25 to 3.125 BTC at a price of about $63,000. About 18 months later, BTC peaked at $126,198 on October 6, 2025, perfectly falling within the historical "12 to 18 months to peak" window.

As of June 2026, it's been about 26 months since the 2024 halving and about 8 months since the October 2025 peak. According to historical patterns, the bottom typically occurs 12 to 14 months after the peak, suggesting a bottoming window might arrive around October 2026. This would be about 17 months before the next halving (estimated April 2028), almost perfectly aligning with the timing of the previous three cycles.

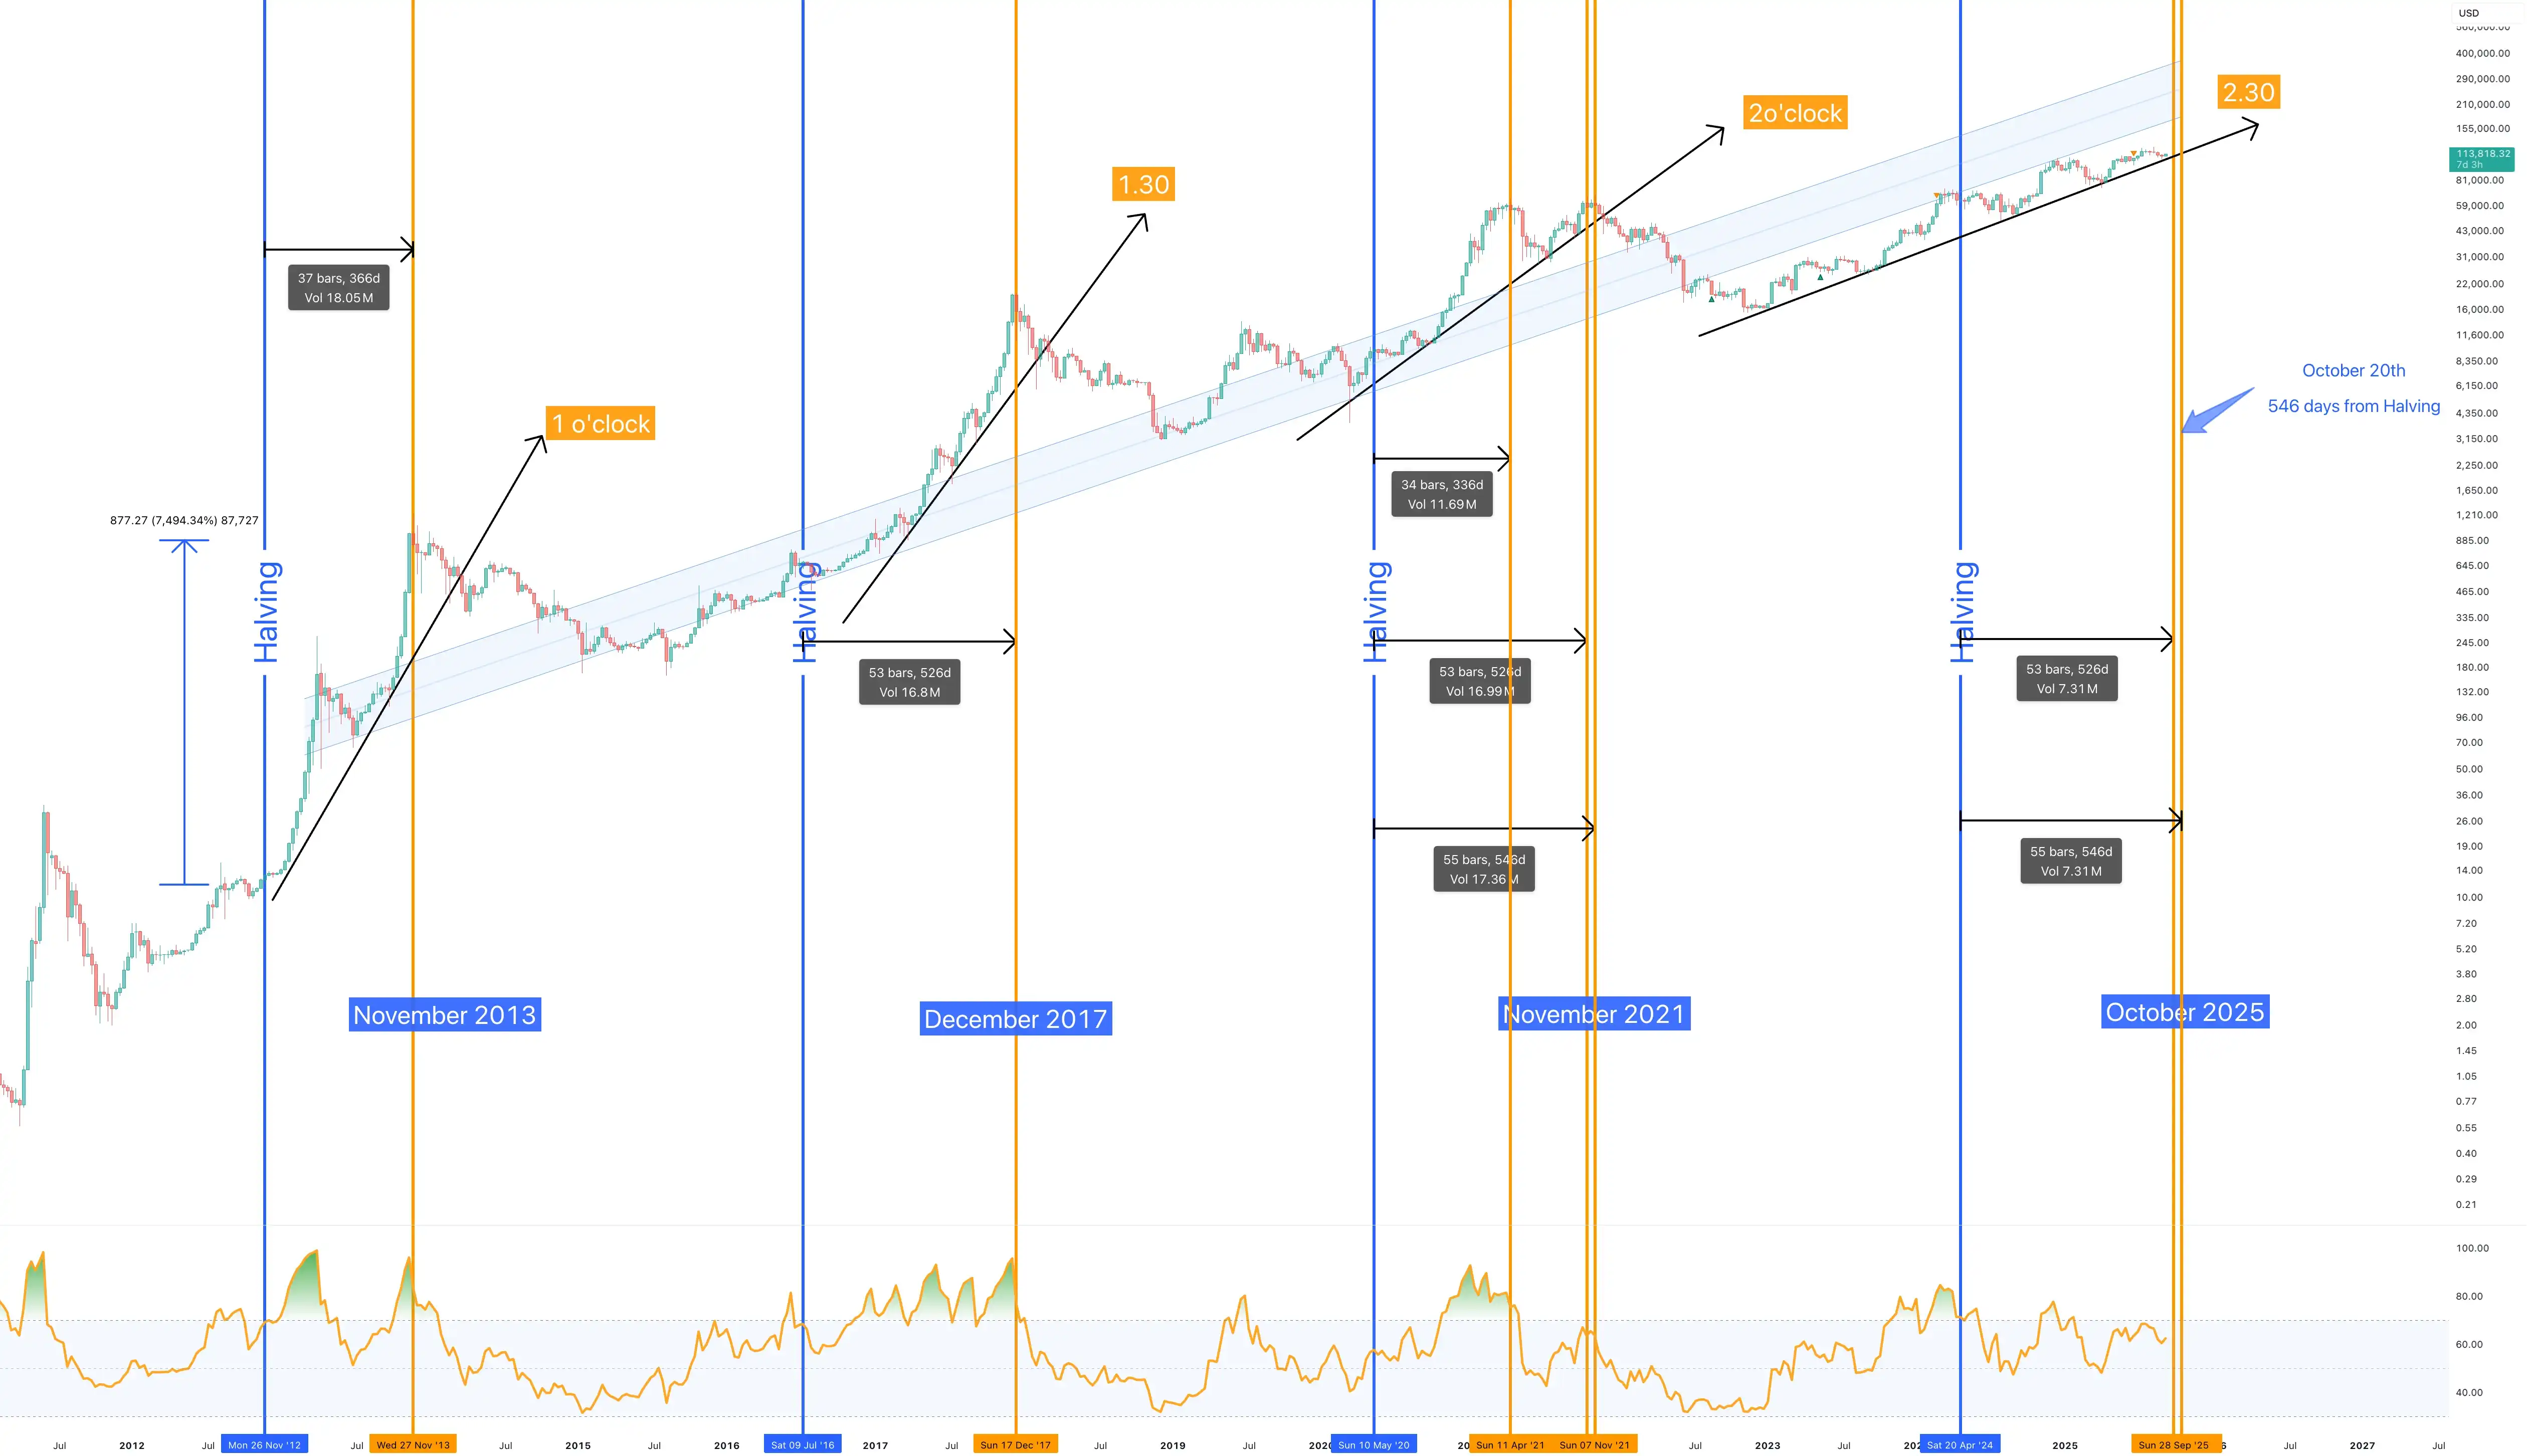
BTC Halving Timeline

From the current vantage point, the second half of 2026 appears more like a phase to reassess the risk-reward ratio within this cycle, rather than a time for simple panic selling.

The supply contraction post-halving continues, and the structural change brought by spot ETFs and institutional capital has altered the market dynamics from being solely driven by retail sentiment. If historical cycles continue to exert influence, the area around Q4 2026 might precisely be the critical window where the market shifts from pessimism to repair, from deleveraging to re-accumulation. For investors bullish on BTC's long-term value, short-term pullbacks might offer more attractive opportunities for phased accumulation. As the bottoming zone gradually approaches, market confidence could begin to reconsolidate, laying the groundwork for the next uptrend.

On-Chain Data: Three Low-Level Signals Illuminate Simultaneously

Beyond price charts, on-chain data provides more fundamental valuation references.

  1. Signal 1: MVRV Z-Score. This metric measures the deviation between the current market price and the average cost basis of all coin holders. Historically, a Z-Score above 7 signals severe overvaluation near a top; falling near 0 or turning negative corresponds to deep undervaluation zones. When BTC peaked in October 2025, the Z-Score was around 5-6. According to data from MacroMicro on June 9, the current Z-Score is approximately 0.27, nearing the boundary of historical bottom areas.
  2. Signal 2: Realized Price. This is the volume-weighted average price at which all circulating BTC last moved on-chain (i.e., their aggregate cost basis). CryptoQuant Head of Research Julio Moreno noted on June 10 that this value is currently around $53,600. With a market price of $62,000, the premium above the aggregate cost basis is only about 9%, a historically rare low level. In past three cycles, major bottoms formed at or slightly below the realized price; it was briefly breached in November 2022.
  3. Signal 3: 200-Week Moving Average (200WMA). This line represents the average price over nearly the past four years and is currently around $62,200. On June 4, 2026, BTC touched this line for the first time in this cycle. The three major bear market bottoms in 2015, 2018, and 2020 all occurred precisely near this line. 2022 was the only exception, where the price broke below and remained under the line for about 16 months, culminating with the FTX collapse.

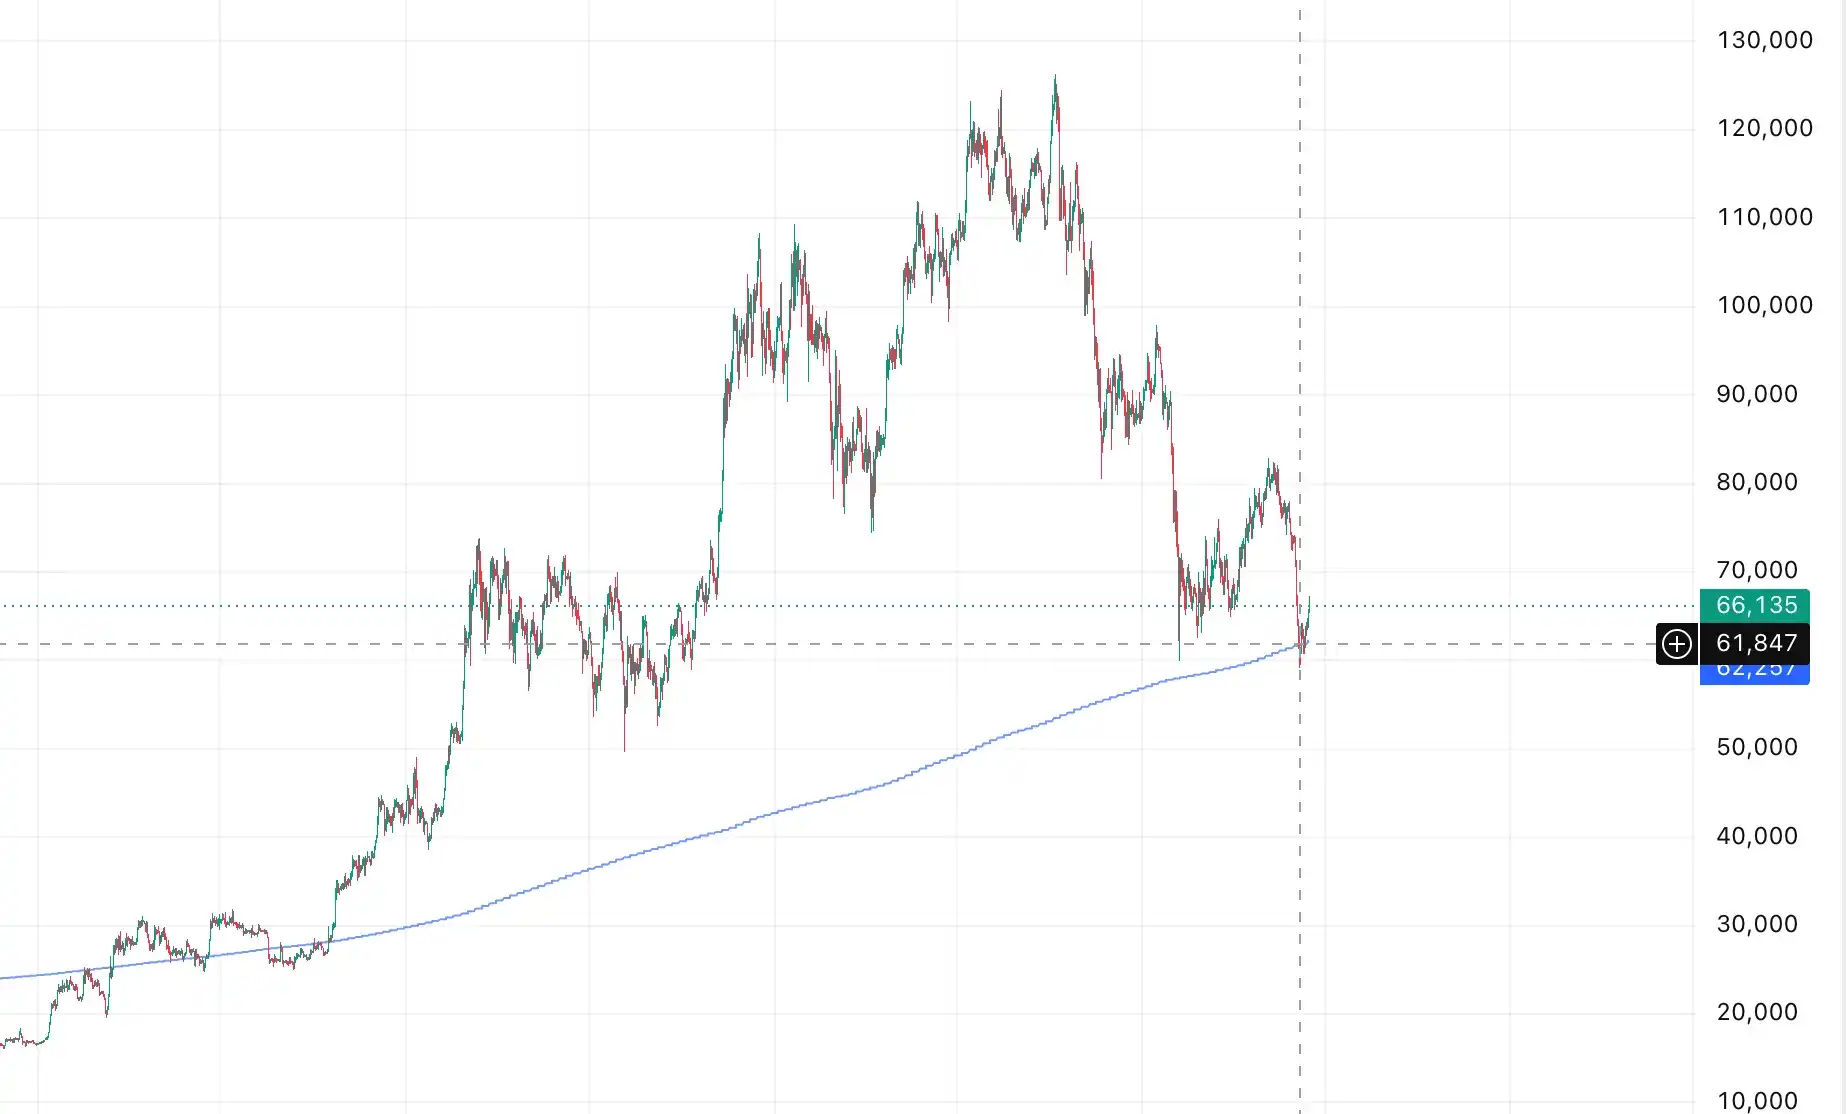
200-Week Moving Average Price. Source: TradingView

Capital Flows: Retail Out, Whales In

Beyond low valuation signals, the structure of capital flows is also showing some bottoming characteristics.

On the ETF front, from mid-May to early June, US spot BTC ETFs experienced net outflows for 13 consecutive trading days, totaling about $4.4 billion (approximately 59,400 BTC), marking the longest continuous outflow period since their launch. BlackRock's IBIT saw a weekly outflow of about $980 million, its worst single-week record. This reflects panic-driven redemptions from short-term and retail capital.

Simultaneously, opposite actions appeared on-chain. The number of whale addresses holding 100+ BTC reached a new 2026 high of around 20,229. The net buying volume by whales in the first five months of 2026 has already matched the total for all of 2025. MicroStrategy sold 32 BTC in late May to pay preferred stock dividends, its first sale in four years, sparking concerns about a strategic shift. However, two weeks later, on June 8, the company bought 1,550 BTC at an average price of $65,332, bringing its total holdings to 845,256 BTC. Michael Saylor described this as "an opportune time to add."

On the exchange front, BTC balances on major exchanges have been declining over the past months, with coins flowing from trading platforms to long-term holders' and institutional cold wallets. Currently, long-term holders (holding for over 155 days) control about 78% of the circulating supply, one of the highest proportions in history.

Macro: The Biggest Uncertainty, Just Half Removed

Over the past months, the core macro logic suppressing BTC has stemmed from two main lines: high interest rates and the Iran war.

In early 2026, US-Israeli military strikes on Iran led to a partial blockade of the Strait of Hormuz. The IEA labeled it the largest supply disruption in global oil market history, with international oil prices briefly surging to $105-120 per barrel. Inflation rebounded as a result; US May CPI rose to 4.2%, far exceeding the 2% policy target. The Federal Funds Rate was forced to remain unchanged in the 3.50%-3.75% range, and the market priced the probability of "zero cuts in 2026" to about 79% at one point. The US Dollar Index strengthened to the 99-100 vicinity. The dual pressure of high rates and risk-off sentiment meant that despite ongoing global liquidity expansion, funds could not flow into the crypto market.

However, on the night of June 14, US President Trump announced the completion of a US-Iran agreement. Iran's Supreme National Security Council formally confirmed the ceasefire memorandum of understanding in the early hours of June 15, with the official signing ceremony scheduled for June 19 in Switzerland. The Strait of Hormuz will subsequently reopen.

The market reaction was immediate and intense. WTI crude oil fell over 4% that day to around $80.25/barrel, and Brent crude dropped to around $83.51. BTC jumped from around $61,500 before the announcement to above $65,000, a single-day gain of over 5%—the largest one-day rebound in the past three months—with volume surging. Futures for the three major US stock indices all rallied over 300 points, and Asian markets followed suit.

Following the agreement, Deutsche Bank stated that it expects the risk of a Fed rate hike to subside in the near term. However, due to sticky inflation, a resilient labor market, and the possibility of a higher neutral rate, a rate hike in 2027 remains possible. The Fed's specific path, of course, depends on the debut of the new chair, Kevin Warsh.

Conclusion: It's the Bottom, and Also When Confidence Is Most Lacking

When BTC stood above $120,000, everyone was willing to believe it would go higher; but now, as it trades around $60,000, with on-chain valuation, cycle positioning, long-term holder dominance, and macro variables all pointing to a bottoming area, what the market lacks most is precisely confidence.

Yet, investing is never done when emotions are most comfortable. Historically, every major BTC bottom has been accompanied by "this time is different" skepticism, alongside comprehensive doubts about the industry, the cycle, and the asset itself. The difference lies only in whether one uses this doubt as a reason to exit or as an opportunity to reprioritize risk-reward.

Current BTC levels certainly don't guarantee it won't fall further or that this is *the* absolute bottom. But when viewed with a longer timeframe, separating short-term panic from long-term structure, the current zone is no longer defined by "chasing highs." It more closely resembles a window for phased accumulation—one requiring patience, discipline, and confidence.

Market confidence is more precious than gold. Because gold can only hedge against inflation, while confidence can navigate cycles. For those who still believe in the long-term value of BTC, in scarcity, and that global liquidity will eventually return to risk assets, the most important question in the second half of 2026 might not be "will it go lower?" but rather, when the market begins to believe in it again, will you already be positioned?

What will you choose?

Related Questions

QBased on the article, what are the three primary chain data indicators that are signaling a low valuation for BTC, and what do they signify?

AAccording to the article, the three chain data indicators signaling a low valuation are: 1) The MVRV Z-Score is around 0.27, indicating a market price very close to the historical cost basis. 2) The Network Realized Price (all BTC's cost basis) is approximately $53,600, and the current price is only about 9% above this, a rare historical low premium. 3) The 200-week moving average, currently around $62,200, was touched for the first time this cycle, and it has historically served as a major support level.

QAccording to the historical halving cycle pattern described, when might the current bear market bottom for BTC potentially occur?

ABased on the historical pattern where a market peak occurs 12-18 months post-halving and a bottom occurs 12-14 months after that peak, and considering the 2024 halving and the October 2025 peak, the article suggests the bottoming window could fall around October 2026, which would be approximately 17 months before the next expected halving in 2028.

QHow does the current ~52% price drawdown from the 2025 peak compare to previous major Bitcoin bear markets?

AThe current ~52% drawdown from the $126,198 peak is significantly milder than previous major bear markets. The 2014, 2018, and 2022 bear markets saw drawdowns of approximately 86%, 84%, and 77% respectively. Therefore, the current decline is in the lower to middle range historically.

QWhat contrasting trends in investor behavior does the article highlight regarding BTC holdings?

AThe article highlights a divergence between retail/short-term investors and large holders (whales/institutions). On one hand, US spot BTC ETFs experienced significant and prolonged net outflows, indicating retail panic and selling. On the other hand, the number of whale addresses holding over 100 BTC reached a 2026 high, and long-term holders now control a historically high proportion (~78%) of the circulating supply, suggesting accumulation at lower prices.

QWhat major geopolitical and macroeconomic factor that was suppressing the market did the article state was recently removed?

AThe article states that the geopolitical tension and conflict involving Iran, which led to a spike in oil prices and inflation concerns, was a major market suppressant. This uncertainty was largely removed with the announcement of a US-Iran agreement and ceasefire memorandum on June 14-15, 2026, leading to an immediate positive reaction in BTC and other risk assets.

Related Reads

The Foundation of SpaceX's Trillion-Dollar Valuation: Who is Dividing Up Musk's Annual Tens of Billions in Capital Expenditure?

SpaceX's trillion-dollar valuation is built on its three core businesses: Starlink (profitable, 60% of revenue), rockets (driving down launch costs), and AI (a major investment area). This creates a financial cycle: Starlink funds rocket development, which enables low-cost launches for AI hardware, generating future revenue. This cycle fuels annual capital expenditures of tens of billions, flowing to a vast supply chain. Suppliers are categorized by their replaceability. The first group includes irreplaceable players like NVIDIA (GPU/CUDA ecosystem), Eutelsat (critical radio spectrum), Filtronic (specialized amplifiers), Materion (strategic beryllium), and STMicroelectronics (antenna chips). The second group consists of hard-to-replace suppliers due to high switching costs, such as Honeywell (flight control), Carpenter Technology (specialty alloys), Hexcel (carbon fiber), Broadcom (data exchange), and Linde (industrial gases). The third group comprises high-volume, cost-critical suppliers for mass-produced items like Starlink terminals. Key names include Wistron NeWeb (primary manufacturer) and several A-share companies like Shenzhen Sunway (connectors), Pies New Materials (forgings), Western Superconducting (alloys), and Yingliu (castings). Other niche players include Trimble (timing), Astronics (power distribution), and CTS (thermal management). The article argues that investing in these suppliers, rather than SpaceX stock directly, offers an alternative opportunity. The rationale is threefold: procurement is just beginning to scale, SpaceX's IPO brings new transparency to its supply chain, and the situation mirrors early stages of past "super terminal" ecosystems like Apple or Tesla. While risks exist (commodity cycles, geopolitical factors, technology shifts), the core thesis is that SpaceX's massive, ongoing procurement will translate into reliable revenue for its key suppliers, regardless of its own stock price volatility.

marsbit6m ago

The Foundation of SpaceX's Trillion-Dollar Valuation: Who is Dividing Up Musk's Annual Tens of Billions in Capital Expenditure?

marsbit6m ago

SpaceX's Trillion-Dollar Valuation Base: Who's Sharing in Musk's Annual Tens of Billions in Capital Expenditure?

**Title: The Foundation of SpaceX's Trillion-Dollar Valuation: Who Benefits from Musk's Annual $100 Billion Capital Expenditure?** This article argues that investors seeking to benefit from SpaceX's growth might find greater opportunities in its supply chain rather than directly investing in the company itself, drawing parallels to historical successes with Apple, Tesla, and NVIDIA suppliers. **SpaceX's Business Model & Cash Flow:** SpaceX generates revenue from three main areas: 1. **Starlink:** Its profitable core, earning $11.3B in 2023 (60% of revenue), funding other ventures. 2. **Rockets (Falcon/Starship):** Requires $3B+ in annual R&D but achieves the world's lowest launch costs. 3. **AI:** Currently unprofitable (-$6B+ in 2023), investing heavily in ground-based supercomputers (220,000 GPUs) and future orbital data centers. The cycle is: Starlink profits → fund cheaper rockets → low-cost launches deploy AI hardware → AI compute rentals generate future revenue. This cycle drives annual procurement spending of tens of billions of dollars. **The Supply Chain Beneficiaries:** Suppliers are categorized by their replaceability: **1. Nearly Irreplaceable (High Barriers to Entry):** * **NVIDIA:** Powers the Colossus supercomputer; its CUDA ecosystem creates immense switching costs. * **Eutelsat (SATS):** Controls critical radio spectrum for satellite communications; holds a ~3% stake in SpaceX. * **Filtronic (FTC):** Supplies millimeter-wave signal amplifiers for Starlink satellites; SpaceX constitutes 83% of its revenue. * **Materion (MTRN):** Global leader in beryllium production, a strategic material used in Starship structures. * **STMicroelectronics (STM):** Supplies phased-array antenna chips for Starlink satellites. **2. Replaceable, but Switching Cost is Prohibitively High:** * **Honeywell (HON):** Provides flight control and inertial navigation systems with decades of certification. * **Carpenter Technology (CRS):** Manufactures ultra-pure specialty steel alloys for Raptor engines. * **Hexcel (HXL):** Supplies custom carbon fiber composites developed over a decade with SpaceX. * **Broadcom (AVGO):** Manages high-speed data switching. * **Linde Group:** Supplies industrial gases (liquid oxygen/nitrogen) from facilities built near SpaceX launch sites. **3. High-Volume, Cost-Critical Manufacturing:** Focuses on mass-producing components like Starlink user terminals (target: 30 million units). * **Key Players:** Wistron NeWeb (6285, primary terminal manufacturer), several Chinese A-share companies (e.g., Sunway Communication, PAX New Materials, Western Metal Materials, Yingliu Co.), and smaller US firms like Trimble (TRMB, timing systems). **Why Now?** Three factors make the supply chain opportunity timely: 1. **Volume Ramp-Up:** SpaceX plans 100 launches in 2026, aims for 30 million Starlink terminals, and will deploy AI data centers, meaning procurement will accelerate. 2. **Increased Transparency:** The IPO provides public financial data, allowing investors to track supplier order growth. 3. **Historical Precedent:** The current phase is likened to Tesla's early mass-production stage (circa 2018), suggesting a long growth runway for suppliers. **Conclusion:** The article posits that while investing in SpaceX stock is betting on Elon Musk's ambitious vision at a high valuation, investing in its established suppliers is a bet on the tangible, recurring revenue from its massive procurement budget, which is largely decoupled from day-to-day stock price volatility.

链捕手10m ago

SpaceX's Trillion-Dollar Valuation Base: Who's Sharing in Musk's Annual Tens of Billions in Capital Expenditure?

链捕手10m ago

The U.S. Government Blocked the Anthropic Model. It Wasn't About 'Jailbreaking' at All.

Last Friday, the U.S. Commerce Department issued an enforcement letter that forced Anthropic to take its two most advanced AI models, Fable 5 and Mythos 5, offline. The stated reason was unspecified national security concerns, initially linked to potential "jailbreaks" of the models' safeguards. However, new details suggest the action stemmed more from a deteriorating relationship between the Trump administration and Anthropic, rather than a genuine technical threat. According to reports, the government cited a little-known export control regulation, compelling Anthropic to block access for all non-U.S. persons, including its own international employees. The company complied, shutting down the models without a court order or specific technical details from the government. Cybersecurity expert Katie Moussouris revealed she was privately shown a research paper detailing a potential safeguard bypass in Fable 5. She argued the described method was minor and did not warrant an export ban, stating that attempts to "fix" it would only weaken the model's defensive capabilities. Moussouris and other experts have since called for the order to be revoked, warning it dangerously removes advanced cybersecurity tools from U.S. defenders. Analysts like Justin Hendrix suggest the move appears retaliatory and sets a dangerous precedent, signaling that the U.S. government can unilaterally shut down a tech company's products. The incident has raised concerns about the reliability of American AI and the potential for political interference in the tech industry, serving as a warning to the broader sector.

marsbit13m ago

The U.S. Government Blocked the Anthropic Model. It Wasn't About 'Jailbreaking' at All.

marsbit13m ago

Ray Dalio: AI Bull Market Continues to Soar, Should Investors Go All In or Cash Out and Leave the Field?

In his latest notes, Ray Dalio addresses a critical question for investors amid the AI-driven stock market surge: how should one allocate assets during a transformative technological revolution? Dalio emphasizes that technological advancement does not automatically make related stocks attractive. Historical tech cycles—marked by excitement, crowding, volatility, and eventual shakeouts—show that even long-term winners like Microsoft and Apple experienced severe drawdowns. Today's AI sector faces similar uncertainties: overinvestment, intensifying competition, geopolitical tensions (e.g., Taiwan's chip supply), tax policy shifts, anti-AI sentiment, and potential disruption from future technologies like quantum computing. Dalio's core argument focuses on the highly concentrated market structure, where a few tech giants dominate major indices. He warns investors against unknowingly holding concentrated, correlated exposures. Instead of chasing a handful of AI leaders, he advocates for a robust, diversified portfolio of 15 or more high-quality, uncorrelated investments, risk-balanced to match an investor's volatility tolerance. Mathematically, such diversification significantly improves the risk-return ratio—for example, holding 15 uncorrelated assets can boost the ratio by over four times compared to a single concentrated bet. Dalio cautions that future equity returns appear low, with his bubble indicator suggesting real returns could be negative over the next 5-10 years. He stresses that knowing what you don't know is as important as knowing what you do. In an environment of high uncertainty and concentration, avoiding large, concentrated bets on AI stocks is prudent. The optimal strategy is disciplined diversification—the "holy grail" of investing—to navigate this technologically driven cycle with lower risk and comparable or better returns.

marsbit17m ago

Ray Dalio: AI Bull Market Continues to Soar, Should Investors Go All In or Cash Out and Leave the Field?

marsbit17m ago

Trading

Spot
Futures

Hot Articles

What is $BITCOIN

DIGITAL GOLD ($BITCOIN): A Comprehensive Analysis Introduction to DIGITAL GOLD ($BITCOIN) DIGITAL GOLD ($BITCOIN) is a blockchain-based project operating on the Solana network, which aims to combine the characteristics of traditional precious metals with the innovation of decentralized technologies. While it shares a name with Bitcoin, often referred to as “digital gold” due to its perception as a store of value, DIGITAL GOLD is a separate token designed to create a unique ecosystem within the Web3 landscape. Its goal is to position itself as a viable alternative digital asset, although specifics regarding its applications and functionalities are still developing. What is DIGITAL GOLD ($BITCOIN)? DIGITAL GOLD ($BITCOIN) is a cryptocurrency token explicitly designed for use on the Solana blockchain. In contrast to Bitcoin, which provides a widely recognized value storage role, this token appears to focus on broader applications and characteristics. Notable aspects include: Blockchain Infrastructure: The token is built on the Solana blockchain, known for its capacity to handle high-speed and low-cost transactions. Supply Dynamics: DIGITAL GOLD has a maximum supply capped at 100 quadrillion tokens (100P $BITCOIN), although details regarding its circulating supply are currently undisclosed. Utility: While precise functionalities are not explicitly outlined, there are indications that the token could be utilized for various applications, potentially involving decentralized applications (dApps) or asset tokenization strategies. Who is the Creator of DIGITAL GOLD ($BITCOIN)? At present, the identity of the creators and development team behind DIGITAL GOLD ($BITCOIN) remains unknown. This situation is typical among many innovative projects within the blockchain space, particularly those aligning with decentralized finance and meme coin phenomena. While such anonymity may foster a community-driven culture, it intensifies concerns about governance and accountability. Who are the Investors of DIGITAL GOLD ($BITCOIN)? The available information indicates that DIGITAL GOLD ($BITCOIN) does not have any known institutional backers or prominent venture capital investments. The project seems to operate on a peer-to-peer model focused on community support and adoption rather than traditional funding routes. Its activity and liquidity are primarily situated on decentralized exchanges (DEXs), such as PumpSwap, rather than established centralized trading platforms, further highlighting its grassroots approach. How DIGITAL GOLD ($BITCOIN) Works The operational mechanics of DIGITAL GOLD ($BITCOIN) can be elaborated on based on its blockchain design and network attributes: Consensus Mechanism: By leveraging Solana’s unique proof-of-history (PoH) combined with a proof-of-stake (PoS) model, the project ensures efficient transaction validation contributing to the network's high performance. Tokenomics: While specific deflationary mechanisms have not been extensively detailed, the vast maximum token supply implies that it may cater to microtransactions or niche use cases that are still to be defined. Interoperability: There exists the potential for integration with Solana’s broader ecosystem, including various decentralized finance (DeFi) platforms. However, the details regarding specific integrations remain unspecified. Timeline of Key Events Here is a timeline that highlights significant milestones concerning DIGITAL GOLD ($BITCOIN): 2023: The initial deployment of the token occurs on the Solana blockchain, marked by its contract address. 2024: DIGITAL GOLD gains visibility as it becomes available for trading on decentralized exchanges like PumpSwap, allowing users to trade it against SOL. 2025: The project witnesses sporadic trading activity and potential interest in community-led engagements, although no noteworthy partnerships or technical advancements have been documented as of yet. Critical Analysis Strengths Scalability: The underlying Solana infrastructure supports high transaction volumes, which could enhance the utility of $BITCOIN in various transaction scenarios. Accessibility: The potential low trading price per token could attract retail investors, facilitating wider participation due to fractional ownership opportunities. Risks Lack of Transparency: The absence of publicly known backers, developers, or an audit process may yield skepticism regarding the project's sustainability and trustworthiness. Market Volatility: The trading activity is heavily reliant on speculative behavior, which can result in significant price volatility and uncertainty for investors. Conclusion DIGITAL GOLD ($BITCOIN) emerges as an intriguing yet ambiguous project within the rapidly evolving Solana ecosystem. While it attempts to leverage the “digital gold” narrative, its departure from Bitcoin's established role as a store of value underscores the need for a clearer differentiation of its intended utility and governance structure. Future acceptance and adoption will likely depend on addressing the current opacity and defining its operational and economic strategies more explicitly. Note: This report encompasses synthesised information available as of October 2023, and developments may have transpired beyond the research period.

368 Total ViewsPublished 2025.05.13Updated 2025.05.13

What is $BITCOIN

Discussions

Welcome to the HTX Community. Here, you can stay informed about the latest platform developments and gain access to professional market insights. Users' opinions on the price of BTC (BTC) are presented below.

活动图片