Consolidation and Jackson Hole: Trader Assesses Bitcoin and Ethereum Movement Scenarios

cryptonews.ruPublished on 2026-08-17Last updated on 2026-08-17

Abstract

**Analysis: Bitcoin and Ethereum Consolidation Ahead of Jackson Hole** Bitcoin (BTC) is consolidating near $63,513, with liquidity accumulating around the $62,484 support level. The primary resistance is an unfilled 4-hour Fair Value Gap (FVG) at $64,000-$65,000. Analysts outline three potential scenarios: A) a rejection from the FVG leading to a cascade down to $60,000-$61,000; B) a bullish breakout above the FVG targeting $65,373 and higher; C) (prioritized) a quick stop-loss hunt below $62,484 followed by a rapid reversal upward into the imbalance. Ethereum (ETH) is similarly stagnant, failing to test $2,000 and remaining within its own 4H FVG. Key resistance is at $1,931.50 (PWH). Scenarios include: A) a genuine breakout and hold above this level; B) a deep liquidity grab below $1,852 followed by a powerful reversal; C) a false breakout above resistance leading to a cascading dump towards $1,780-$1,800. Despite ETF inflows, ETH's price lacks momentum. The US Dollar Index (DXY) broke below key support at 99.475, opening a path toward lower FVGs near 99,000. This weakness, if sustained, could support crypto markets. Key triggers this week are FOMC meeting minutes and preliminary PMI data, with positioning ahead of the Jackson Hole symposium being crucial. The overall sentiment is cautiously positive, but the recommended strategy is to stay out of medium-term positions in major assets until a clear directional move occurs, favoring intraday trading on lower timeframes wi...

  • Bitcoin is stuck near $63,513 and is accumulating liquidity around $62,484.
  • Ethereum did not reach $2000 and remains inside the 4H FVG.
  • DXY broke through support at 99.475, opening the path to lower inefficiency zones.
  • FOMC minutes, PMI data, and positioning ahead of Jackson Hole will be the main triggers this week.

Disclaimer: This material is not financial advice or a call to action. The presented analysis is the private opinion of its author. Incrypted is not responsible for readers' investment decisions.

Market Analysis — Prolonged Consolidation, Liquidity Shortage, and Positioning Ahead of Jackson Hole

The past trading week did not bring the expected resolutions. Despite a busy macroeconomic backdrop and constant news injections regarding the Middle East, major crypto assets followed conservative sideways scenarios.

Inflation statistics predictably matched consensus forecasts and were completely ignored by market participants. We analyze the technical picture and development vectors for the main assets in detail.

Bitcoin — Pool Accumulation and Threat of Manipulation

The chart has stalled around $63,513, showing almost no movement over five days. The current structure creates extreme tension: below us, at the $62,484 level, a third series of equal lows (EQL) has formed, converging at the same point with the pWL. Liquidity continues to accumulate, and the longer the market maker leaves this pool untouched, the higher the risk of an aggressive sell-off.

Above, price dynamics are restrained by an unfilled 4H FVG ($64,000-$65,000) — it remains the main barrier of the week. Higher up are pWH ($65,373), pMH ($66,924), and the old target at $67,255. If the sideways movement breaks to the downside, price will meet pools in the 1H FVG zones ($60,000-$61,000), 4H FVG ($59,000-$60,000), and at pML ($57,758).

Current Scenarios

Scenario A — Retest of the Imbalance and Cascade Breakdown Downwards

Price enters the 4H FVG zone $64,000-$65,000, notes buyer weakness, and reverses. Then comes what the market has been expecting for several weeks: a break of the $62,484 mark without a return and a cascade drop to $60,000-$61,000 and below.

Under thin August market conditions, a fall unfolds significantly faster than a rise. Invalidation — an immediate buyback into the body of the range within one or two candles.
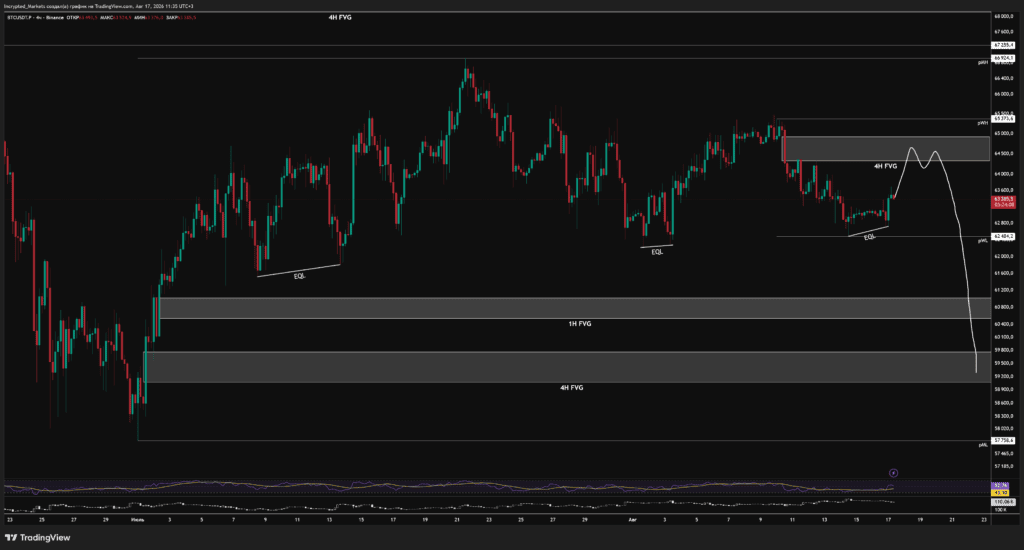
Four-hour chart of $BTC/$USDT.P. Data: TradingView.

Scenario B — Impulse Breakout and Assault on Resistances

The asset, on volume, slices through the 4H FVG, tests its upper boundary, and heads towards $65,373. Confirmed consolidation above PWH opens a direct path to $66,924 and $67,255.

The determining factor will be price behavior upon returning to the $64,000-$65,000 block — it should act as reliable support.
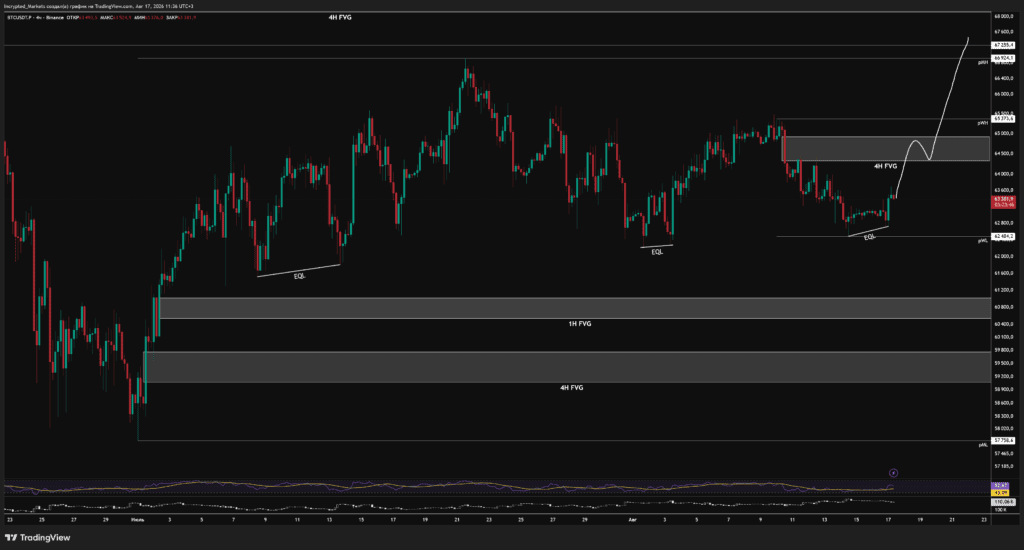
Four-hour chart of $BTC/$USDT.P. Data: TradingView.

Scenario C — Stop-Hunt and Reversal Upwards (Priority)

The most logical maneuver for large capital is a sharp break of $62,484 to take liquidity from early longs operating from the edge of the range, followed by a powerful impulse into the upper imbalance.

The key aspect is speed. A quick price return confirms buyer strength.
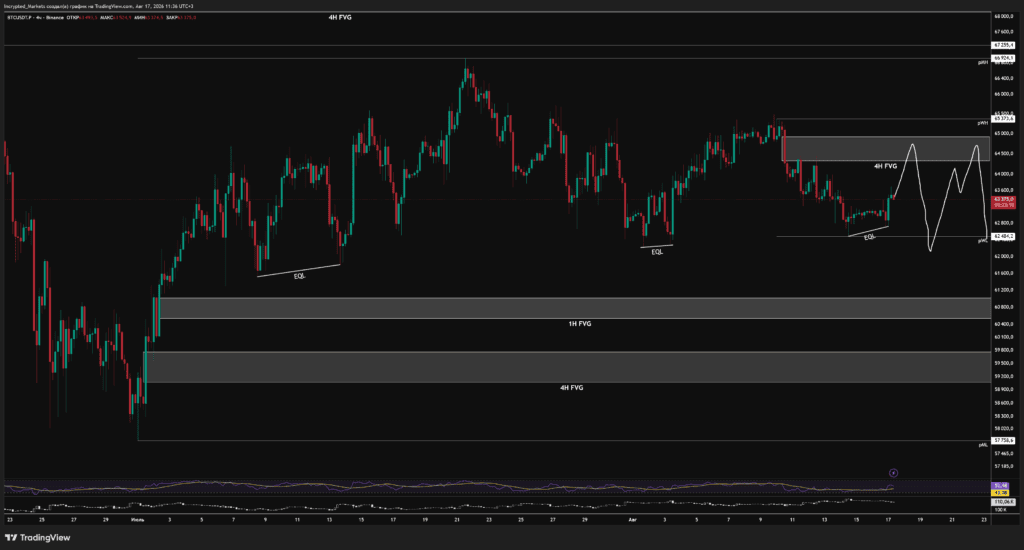
Four-hour chart of $BTC/$USDT.P. Data: TradingView.

Ethereum — Obstacle at $2000 and Divergence with ETF

The main altcoin spent the week in a similar stupor. The expected test of the round $2000 mark did not materialize. The market did not allow clean scenarios to play out: EQLs from below remained untouched, and the upward impulse choked at $1930.

The asset is literally stuck inside a 4H FVG, which currently acts as a zone of equilibrium. Pressure from above comes from resistance PWH $1931.50, behind which lies a dense cluster of liquidations 1925-1950, PMH $1982, and an hourly imbalance under $2000.

Support below is held by PWL $1852.22 and August EQLs. Below that lies a void down to the 4H FVG at $1802.46, a break of which opens the path to $1665-$1685.

Against the backdrop of chart stagnation, the relative strength of spot ETFs stands out: Ethereum funds have attracted capital for the fifth consecutive week, while Bitcoin recorded outflows of nearly $390 million last week. Meanwhile, the $ETH/$BTC pair is approaching 0.03.

However, without converting this strength into dollar value, the risk of a synchronous major dump remains.

Current Scenarios

Scenario A — Genuine Breakout and Consolidation

Accumulation within the current imbalance followed by a move through $1931.50 and entry into the short cluster $1925-$1950. The main goal is to consolidate above PWH.

Without holding this level upon retest, the move will be a false breakout.
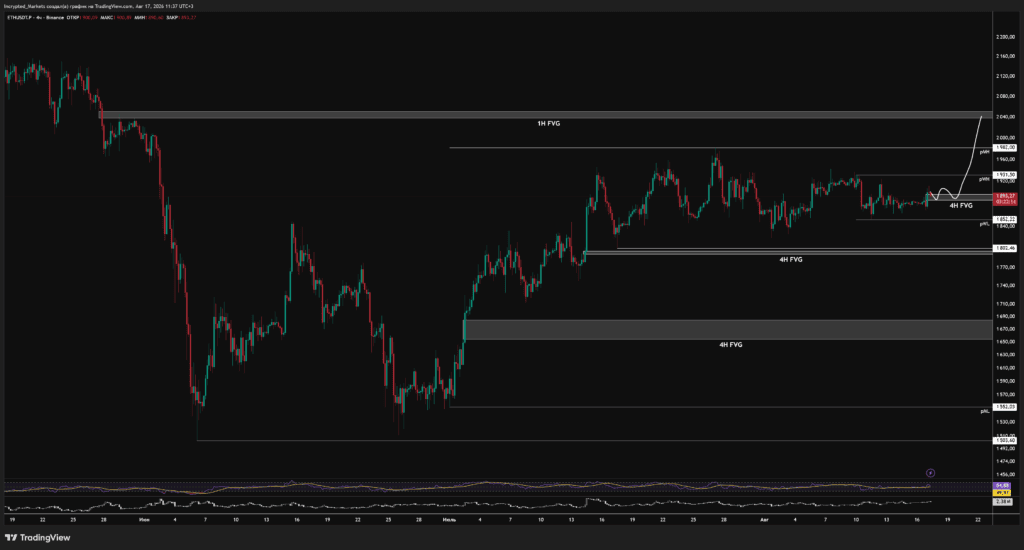
Four-hour chart of $ETH/$USDT.P. Data: TradingView.

Scenario B — Deep Liquidity Grab from Below

Break of support at $1852 and collection of equal lows along with "easy longs." A dip to $1802.46 is expected, followed by a powerful reversal upwards.

The validity of the scenario is confirmed only by a lightning-fast price return to the original range.
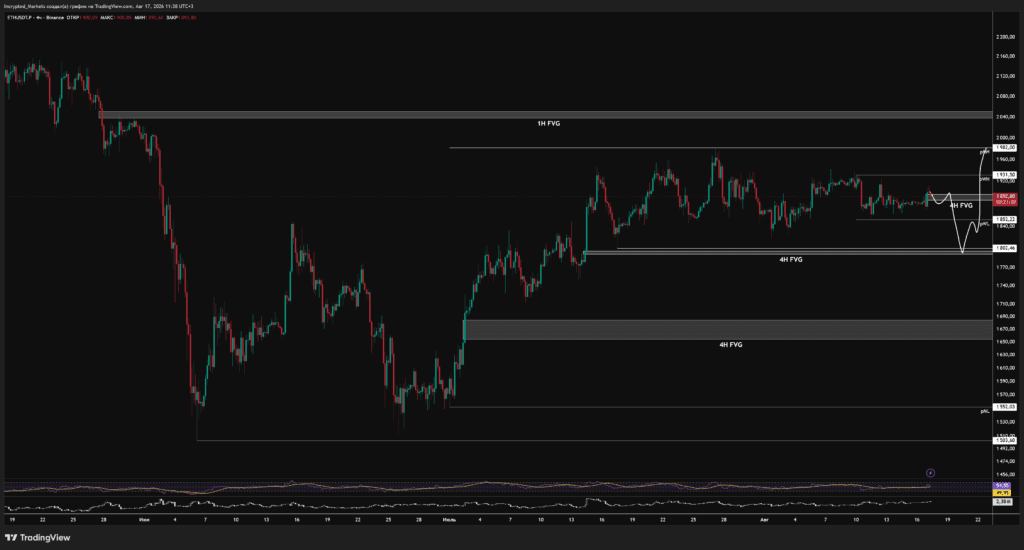
Four-hour chart of $ETH/$USDT.P. Data: TradingView.

Scenario C — False Breakout and Cascade Dump

The most painful option: the asset liquidates shorts in the $1931-$1950 zone, lures the crowd into breakout positions, then sharply reverses and cuts through the entire chart — through PWL and EQL straight to $1780-$1800.
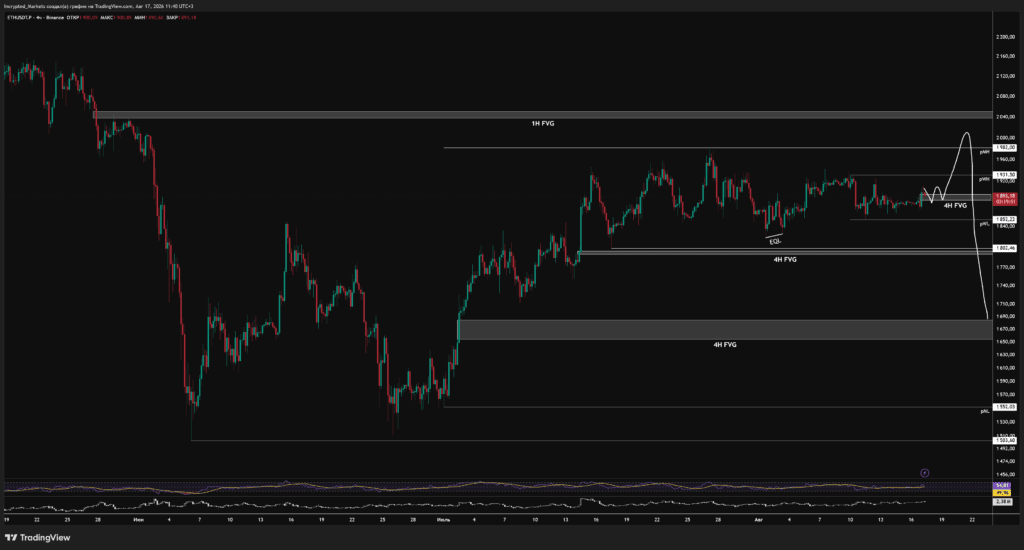
Four-hour chart of $ETH/$USDT.P. Data: TradingView.

Fundamental Triggers and Trading Plan

  • FOMC minutes on Thursday, August 20th. The document is retrospective, but any signs of a split within the committee could prompt a rapid reassessment of rate expectations;
  • Preliminary PMI indexes on Friday, August 21st. The focus is on employment and prices paid components — they will determine the balance of power at month-end;
  • Retail sector earnings season. Results from giants Home Depot, Target, Lowe’s, Walmart, and Reddit's inclusion in the S&P 500 act as an indirect channel of influence through correlation with stock indices;
  • Expectations for the Jackson Hole Symposium August 27-29. A half-empty calendar means movements will be driven not by statistics, but by capital positioning before Kevin Warsh's first speech as Fed Chair.

Summary

Paradoxically, the overall sentiment retains a positive tone. The current optimal strategy is staying out of the market for medium-term positions in heavy assets.

Under conditions where large capital is buying time, opening trades before a manipulative level break carries unjustified risk. Priority is given to intraday trading on lower timeframes in instruments with high volatility and strict risk control.

Dollar Index — Break of Key Supports, Movement Below 99.475, and Awaiting FOMC Minutes

Retrospective and Current Position

The past week dealt a serious technical blow to the positions of the American currency. While the release of expected inflation (CPI) data passed relatively calmly, the collapse in retail sales became the final trigger for sellers.

The Dollar Index (DXY) failed to hold the four-hour imbalance zone and impulsively broke through the previous support level.

Currently, DXY quotes have fallen to the 99.345 mark. The asset is trading below a key liquidity pool, opening the way to deeper inefficiency zones.

The market is transitioning into a positioning phase ahead of the Fed minutes publication and the approaching Jackson Hole symposium.

Technical Picture

The downward Order Flow received full confirmation after an aggressive consolidation below weekly lows. Key structural levels:

  • PWH 100.083 — the updated high of the past week, acting as local resistance;
  • PWL 99.475 — the previous weekly low, which was broken and now acts as the nearest mirror barrier;
  • 4H FVG zones: below, price is attracted by two large unfilled imbalances — the first with an upper boundary around 99.000, the second located deeper in the 98.700 zone.

Current Trading Scenarios

Scenario A — V-Shaped Buyback and Return Above PWL (Short Squeeze)

The index uses the current dip below 99.475 as a manipulation, i.e., a deviation, to collect liquidity. Price finds aggressive limit demand, forms a sharp reversal, and returns above the broken 99.475 level, heading to fill the imbalances above.
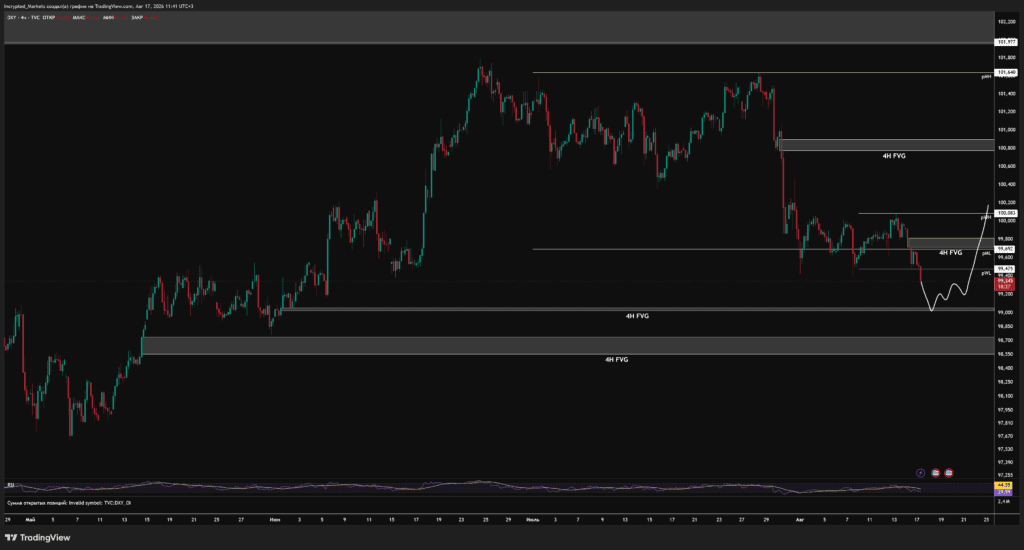
DXY index chart. Data: TradingView.

Scenario B — Pullback-Free Descent to Lower FVG (Priority Bearish)

Sellers maintain full control. The Dollar Index does not receive a bounce from current levels of 99.345 and continues a measured downward move straight to the 4H FVG zone with an upper boundary at the 99.000 level.

Further DXY weakening in this format would create ideal fundamental conditions for the crypto market to rise.
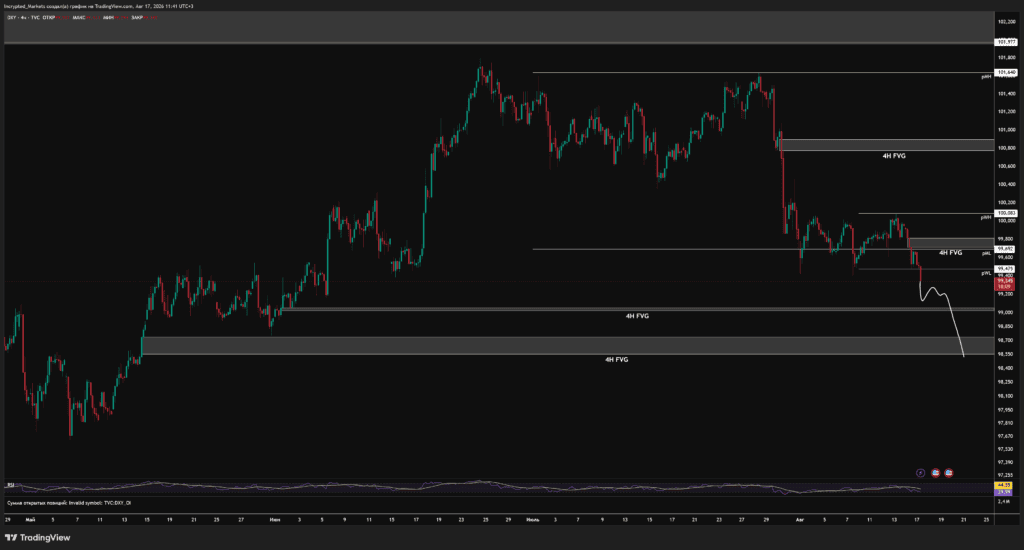
DXY index chart. Data: TradingView.

Scenario C — Retest of Resistance and Continued Decline

Price forms a local technical pullback, testing the zone of the broken PWL level 99.475 from below upwards.

Receiving a firm rejection from sellers in this area, the asset reverses and continues its decline towards the 99.000 block.
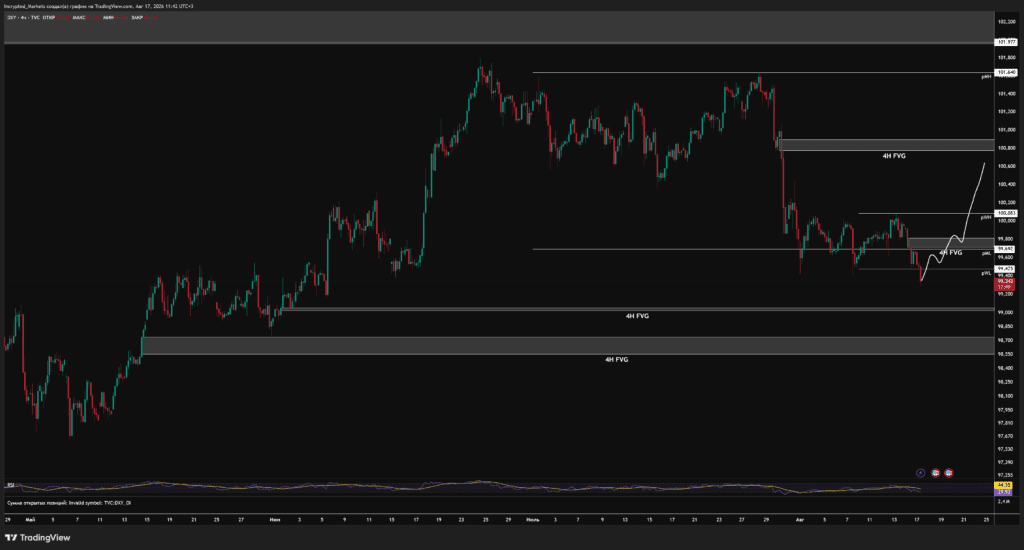
DXY index chart. Data: TradingView.

News Triggers of the Week

  • Wednesday, August 19, 17:30 — Crude oil inventories;
  • Wednesday, August 19, 21:00 — FOMC minutes release. The key event of the week, capable of providing insights into sentiments within the Fed before the September meeting;
  • Thursday, August 20, 15:30 — Philadelphia Fed Manufacturing Index for August;
  • Thursday, August 20, 15:30 — Initial jobless claims;
  • Friday, August 21, 15:30 — Preliminary Manufacturing PMI for August and Services PMI for August.

Sentiment and Tactics

The break of key support radically changes the medium-term balance of power. The market will carefully assess the details of the FOMC's backroom discussions on Wednesday evening.

Until then, chaotic manipulative movements on the thin August order book are possible.

Action plan: maintain focus on lower timeframes. For making trading decisions on crypto assets, it is critically important to see DXY's reaction — either an aggressive return above 99.475, which would be negative for risk assets, or a confident move towards pools at 99.000, which would fuel long positions.

Work systematically and control risks strictly.

Trending Cryptos

Related Questions

QWhat are the three main scenarios for Bitcoin's price movement according to the article, and which one is considered the priority?

AThe three scenarios are: A) Retest of the imbalance and a cascade breakdown downwards; B) Impulsive breakout and assault on resistances; C) Stop-loss hunt and reversal upwards. Scenario C (stop-loss hunt and reversal upwards) is considered the priority (the most logical maneuver for large capital).

QWhat key event and upcoming symposium are highlighted as major triggers for the market this week?

AThe publication of the FOMC meeting minutes and positioning ahead of the Jackson Hole symposium (scheduled for August 27-29) are highlighted as the major triggers for the market this week.

QWhat is the current technical situation for Ethereum, and what potential risk exists despite relative strength in its spot ETFs?

AEthereum is stuck within a 4H FVG (Fair Value Gap) and failed to test the $2000 level. Despite spot ETFs attracting capital for five consecutive weeks (unlike Bitcoin), the risk remains of a synchronous dump of major assets if this relative strength is not converted into dollar-denominated price appreciation.

QWhat happened to the US Dollar Index (DXY) last week, and what is the priority bearish scenario for its next move?

ALast week, the DXY impulsively broke below the previous support level at 99.475. The priority bearish scenario (Scenario B) is a non-rebounding descent directly towards the lower 4H FVG zone, with an upper boundary around 99.000.

QWhat is the recommended overall trading strategy according to the article's summary?

AThe recommended strategy is to stay out of the market for medium-term positions in heavy assets (like Bitcoin and Ethereum). The priority is given to intraday trading on lower timeframes in instruments with high volatility, coupled with strict risk control, until a manipulative level break occurs.

Related Reads

Tiger Research: How Far Can the On-Chain Foreign Exchange Settlement Layer Go?

"Tiger Research: How Far Can On-Chain FX Settlement Layers Go?" The article examines KiiChain, a startup aiming to create an on-chain foreign exchange settlement layer, focusing on its potential to address inefficiencies in cross-border payments, especially for emerging markets. The core problem is the slow, costly, and fragmented traditional FX infrastructure, where bank hours, regulations, and thin liquidity for local currencies create delays. KiiChain, founded by OTC veterans, proposes aggregating USD and local currency stablecoin liquidity on one chain to enable 24/7 settlement. The platform consists of four components: 1) The KiiChain App uses an Atomic Quote Network (RFQ-style price discovery with on-chain settlement) to tackle settlement delays, but not underlying liquidity scarcity. 2) The RWA Protocol tokenizes collateral using compliant standards (like ERC-3643), shifting trust from bank relationships to coded rules, though regulatory anchors remain. 3) Kii Oracle uses a decentralized validator network to create consensus pricing from fragmented data, improving transparency but not market depth. 4) KiiChain Pay bundles fiat on/off-ramps and swap services; only the DEX swap bypasses banking bottlenecks, while others still rely on licensed operators. The analysis concludes KiiChain doesn't eliminate intermediaries but creates a unified settlement layer where they can interact without geographic or time constraints. It streamlines the process—three of eight traditional steps are removed—by moving infrastructure on-chain, improving speed and accessibility for digital asset swaps. However, fiat entry/exit points remain subject to off-chain service limitations. Current metrics show over $500M in transaction volume. The future depends on ecosystem growth—attracting liquidity partners and users—to evolve beyond settlement into a broader financial hub. Ultimately, the on-chain structure currently solves settlement friction and time, not liquidity depth. Success will be determined by execution in building partnerships and market presence, not by architectural design alone.

marsbit24m ago

Tiger Research: How Far Can the On-Chain Foreign Exchange Settlement Layer Go?

marsbit24m ago

Trading

Spot

Hot Articles

What is $BITCOIN

DIGITAL GOLD ($BITCOIN): A Comprehensive Analysis Introduction to DIGITAL GOLD ($BITCOIN) DIGITAL GOLD ($BITCOIN) is a blockchain-based project operating on the Solana network, which aims to combine the characteristics of traditional precious metals with the innovation of decentralized technologies. While it shares a name with Bitcoin, often referred to as “digital gold” due to its perception as a store of value, DIGITAL GOLD is a separate token designed to create a unique ecosystem within the Web3 landscape. Its goal is to position itself as a viable alternative digital asset, although specifics regarding its applications and functionalities are still developing. What is DIGITAL GOLD ($BITCOIN)? DIGITAL GOLD ($BITCOIN) is a cryptocurrency token explicitly designed for use on the Solana blockchain. In contrast to Bitcoin, which provides a widely recognized value storage role, this token appears to focus on broader applications and characteristics. Notable aspects include: Blockchain Infrastructure: The token is built on the Solana blockchain, known for its capacity to handle high-speed and low-cost transactions. Supply Dynamics: DIGITAL GOLD has a maximum supply capped at 100 quadrillion tokens (100P $BITCOIN), although details regarding its circulating supply are currently undisclosed. Utility: While precise functionalities are not explicitly outlined, there are indications that the token could be utilized for various applications, potentially involving decentralized applications (dApps) or asset tokenization strategies. Who is the Creator of DIGITAL GOLD ($BITCOIN)? At present, the identity of the creators and development team behind DIGITAL GOLD ($BITCOIN) remains unknown. This situation is typical among many innovative projects within the blockchain space, particularly those aligning with decentralized finance and meme coin phenomena. While such anonymity may foster a community-driven culture, it intensifies concerns about governance and accountability. Who are the Investors of DIGITAL GOLD ($BITCOIN)? The available information indicates that DIGITAL GOLD ($BITCOIN) does not have any known institutional backers or prominent venture capital investments. The project seems to operate on a peer-to-peer model focused on community support and adoption rather than traditional funding routes. Its activity and liquidity are primarily situated on decentralized exchanges (DEXs), such as PumpSwap, rather than established centralized trading platforms, further highlighting its grassroots approach. How DIGITAL GOLD ($BITCOIN) Works The operational mechanics of DIGITAL GOLD ($BITCOIN) can be elaborated on based on its blockchain design and network attributes: Consensus Mechanism: By leveraging Solana’s unique proof-of-history (PoH) combined with a proof-of-stake (PoS) model, the project ensures efficient transaction validation contributing to the network's high performance. Tokenomics: While specific deflationary mechanisms have not been extensively detailed, the vast maximum token supply implies that it may cater to microtransactions or niche use cases that are still to be defined. Interoperability: There exists the potential for integration with Solana’s broader ecosystem, including various decentralized finance (DeFi) platforms. However, the details regarding specific integrations remain unspecified. Timeline of Key Events Here is a timeline that highlights significant milestones concerning DIGITAL GOLD ($BITCOIN): 2023: The initial deployment of the token occurs on the Solana blockchain, marked by its contract address. 2024: DIGITAL GOLD gains visibility as it becomes available for trading on decentralized exchanges like PumpSwap, allowing users to trade it against SOL. 2025: The project witnesses sporadic trading activity and potential interest in community-led engagements, although no noteworthy partnerships or technical advancements have been documented as of yet. Critical Analysis Strengths Scalability: The underlying Solana infrastructure supports high transaction volumes, which could enhance the utility of $BITCOIN in various transaction scenarios. Accessibility: The potential low trading price per token could attract retail investors, facilitating wider participation due to fractional ownership opportunities. Risks Lack of Transparency: The absence of publicly known backers, developers, or an audit process may yield skepticism regarding the project's sustainability and trustworthiness. Market Volatility: The trading activity is heavily reliant on speculative behavior, which can result in significant price volatility and uncertainty for investors. Conclusion DIGITAL GOLD ($BITCOIN) emerges as an intriguing yet ambiguous project within the rapidly evolving Solana ecosystem. While it attempts to leverage the “digital gold” narrative, its departure from Bitcoin's established role as a store of value underscores the need for a clearer differentiation of its intended utility and governance structure. Future acceptance and adoption will likely depend on addressing the current opacity and defining its operational and economic strategies more explicitly. Note: This report encompasses synthesised information available as of October 2023, and developments may have transpired beyond the research period.

1.9k Total ViewsPublished 2025.05.13Updated 2025.05.13

What is $BITCOIN

Discussions

Welcome to the HTX Community. Here, you can stay informed about the latest platform developments and gain access to professional market insights. Users' opinions on the price of BTC (BTC) are presented below.

活动图片