BTC Market Pulse: Week 11

insights.glassnodePublished on 2026-03-09Last updated on 2026-03-09

Abstract

Bitcoin retreated from the $74k level, showing tentative signs of stabilization. Momentum improved modestly with RSI recovering, though overall price action remains subdued. Spot trading volume was lower, indicating limited participation. Futures open interest rose, while funding rates turned negative, reflecting mixed derivatives sentiment. Options markets became less defensive as volatility spreads narrowed and skew declined. ETF inflows accelerated, though the average holder is now underwater. On-chain metrics were mixed: transfer volume improved, but active addresses and fees remained soft. Supply in profit and NUPL saw modest recovery. Overall, conditions are stabilizing with slight improvements in momentum, ETF demand, and profitability. However, capital flows remain weak, speculative activity is low, and broader conviction has not yet fully returned.

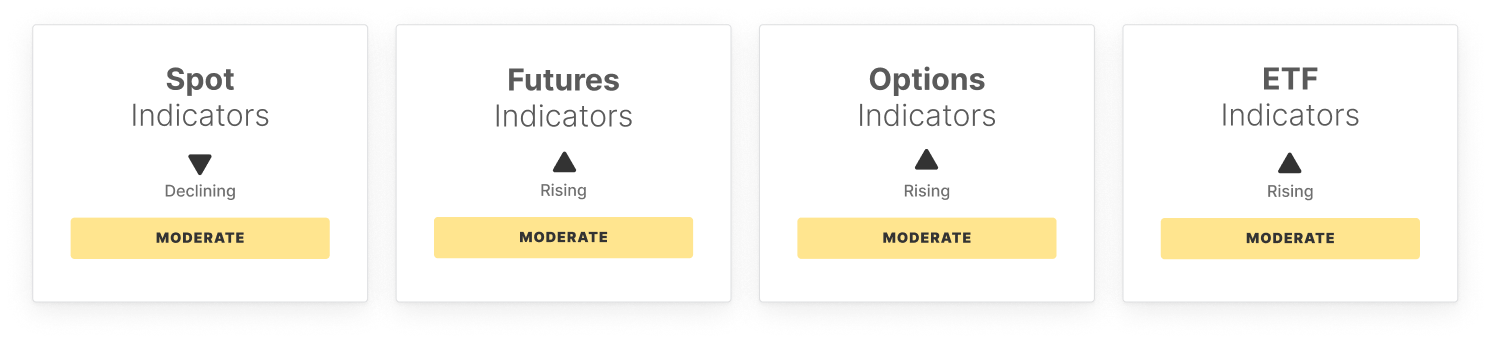
Bitcoin pulled back from $74k, while internals showed tentative signs of improvement. Momentum has firmed modestly, with RSI lifting from recent lows, but price action still lacks the strength of a decisive bullish shift. Spot activity remains subdued, with lower trading volume pointing to softer participation even as conditions begin to stabilize.

Derivatives positioning is mixed. Futures open interest increased, signalling modest leverage build-up, while long-side funding turned sharply negative, reflecting stronger demand for short exposure. Perpetual CVD rose aggressively, suggesting buy-side activity is returning in leveraged markets, though conviction remains limited.

Options markets have become less defensive. The volatility spread narrowed meaningfully as implied volatility moves closer to realised conditions, while 25-delta skew declined, pointing to softer demand for downside hedging and a more balanced near-term backdrop.

ETF activity remains a relative area of strength. Net inflows accelerated and trading volumes picked up, highlighting continued traditional finance engagement. However, the ETF MVRV ratio fell sharply into negative territory, showing the average ETF holder is now underwater and positioning stress remains elevated.

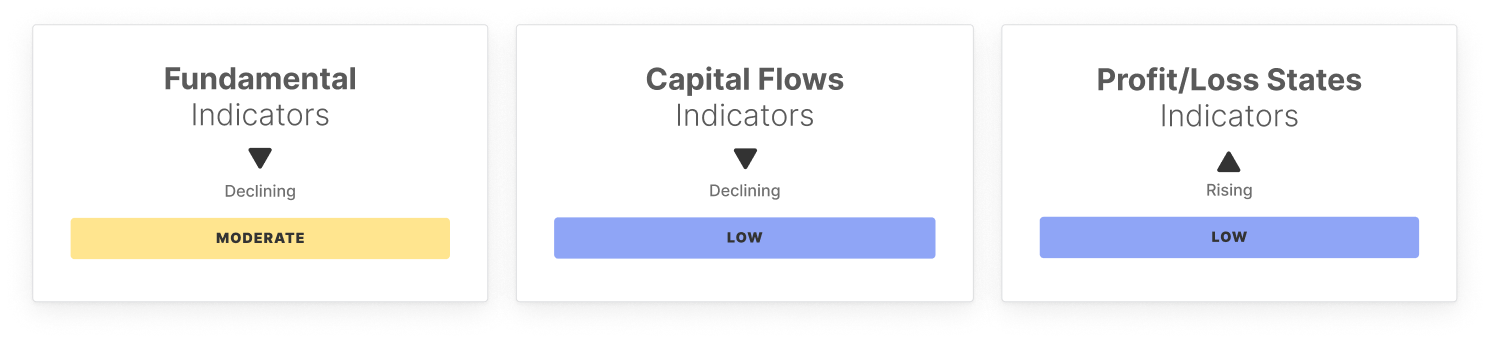
On-chain signals are mixed but slightly constructive. Transfer volume improved, pointing to firmer capital movement, while active addresses and fee volume remain soft, consistent with a quieter network backdrop. Realized cap change is still negative, though outflows are easing slightly, suggesting capital pressure may be starting to stabilize.


Positioning and profitability metrics still reflect a fragile but improving structure. The STH/LTH supply ratio remains elevated, showing short-term participation is still high, while hot capital share stays suppressed, signalling limited speculative churn. Meanwhile, supply in profit, NUPL, and the realized profit-to-loss ratio all improved modestly, suggesting market stress is easing.


Overall, conditions are stabilizing, with momentum, ETF demand, and profitability metrics improving modestly. However, capital flows remain soft, speculative participation is limited, and broader conviction has yet to fully return.

Off-Chain Indicators

On-Chain Indicators

🔗 Access the full report in PDF

Don't miss it!

Smart market intelligence, straight to your inbox.

Subscribe now
  • Follow us and reach out on X
  • Join our Telegram channel
  • For on-chain metrics, dashboards, and alerts, visit Glassnode Studio

Disclaimer: This report does not provide any investment advice. All data is provided for information and educational purposes only. No investment decision shall be based on the information provided here and you are solely responsible for your own investment decisions.

Exchange balances presented are derived from Glassnode’s comprehensive database of address labels, which are amassed through both officially published exchange information and proprietary clustering algorithms. While we strive to ensure the utmost accuracy in representing exchange balances, it is important to note that these figures might not always encapsulate the entirety of an exchange’s reserves, particularly when exchanges refrain from disclosing their official addresses. We urge users to exercise caution and discretion when utilizing these metrics. Glassnode shall not be held responsible for any discrepancies or potential inaccuracies.

Please read our Transparency Notice when using exchange data.

Related Questions

QWhat was the overall trend in Bitcoin's price and momentum in Week 11?

ABitcoin pulled back from $74k, with momentum showing modest firming as RSI lifted from recent lows. However, price action still lacked the strength of a decisive bullish shift.

QHow did derivatives positioning and funding rates behave during this period?

ADerivatives positioning was mixed. Futures open interest increased, indicating modest leverage build-up, while long-side funding turned sharply negative, reflecting stronger demand for short exposure. Perpetual CVD rose aggressively, suggesting buy-side activity was returning in leveraged markets.

QWhat does the sharp decline in the ETF MVRV ratio indicate about investor positioning?

AThe sharp decline of the ETF MVRV ratio into negative territory indicates that the average ETF holder is now in a loss position (underwater), and positioning stress remains elevated.

QWhich on-chain metrics showed signs of a stabilizing or slightly constructive market?

AOn-chain, transfer volume improved, pointing to firmer capital movement. While realized cap change was still negative, outflows were easing slightly, suggesting capital pressure may be starting to stabilize. Metrics like supply in profit, NUPL, and the realized profit-to-loss ratio also improved modestly.

QAccording to the report's conclusion, what are the key factors showing improvement and which areas remain a concern?

AConditions are stabilizing with momentum, ETF demand, and profitability metrics improving modestly. However, capital flows remain soft, speculative participation is limited, and broader conviction has yet to fully return.

Related Reads

AAOI Defies Trend with Over 10% Surge, 'New Stock God' Serenity Predicts Potential to Double Again

On June 4th, despite a significant sell-off in the broader AI and semiconductor sector triggered by Broadcom's disappointing guidance, Applied Optoelectronics (AAOI) surged over 11%, showcasing a sharp divergence in market sentiment. Broadcom's warning about potential supply chain diversification by key customer Google and a weaker-than-expected outlook punctured the high-flying AI valuation narrative. This led to heavy selling in names like Broadcom (-12.6%) and Micron (-7%), with funds rotating into traditional industrial stocks. AAOI defied this trend. The stock has experienced high volatility recently, driven by bullish analyst coverage, notably from Rosenblatt which raised its price target to $220. Key catalysts include initial 800G optical module revenue from Amazon, potential certification from Oracle, and strong demand across its product portfolio. The company has reported cumulative orders for 800G/1.6T modules exceeding $324 million and is aggressively expanding manufacturing capacity in Texas, targeting an annualized run-rate of $1.4 billion for its module business by Q3 2027. However, AAOI's fundamentals present a mixed picture. Its Q1 2026 results missed expectations, showing a GAAP net loss, and Q2 guidance points to merely breakeven adjusted EPS. Risks include a delayed 800G production ramp to the second half of the year and high dependence on a few key cloud customers. Recent stock sales by company executives near price highs also noted. The article suggests AAOI's rally reflects a market beginning to differentiate within the AI ecosystem. While Broadcom's issues prompted a reassessment of custom ASIC and customer concentration risks, funds flowing into AAOI indicate a belief that the "physical bottleneck" narrative for optical connectivity—where supply remains tight—remains intact and is somewhat decoupled from the current sector weakness. The sustainability of AAOI's premium valuation now hinges on the successful execution of its production plans and upcoming quarterly results.

marsbit6m ago

AAOI Defies Trend with Over 10% Surge, 'New Stock God' Serenity Predicts Potential to Double Again

marsbit6m ago

Worried about AI's Self-Evolution, Anthropic Intends to Stop Training?

In early 2026, Anthropic signaled a significant shift in its public narrative regarding AI development timelines and safety. In June, its Anthropic Institute published a detailed article, "When AI builds itself," presenting internal data suggesting accelerating AI self-improvement. Key figures included over 80% of merged code being written by Claude and a 52x speedup in certain optimization tasks. The article outlined three future scenarios, with the most speculative being full recursive self-improvement (RSI), where AI autonomously builds better successors. Anthropic stated RSI is "possible" and may arrive faster than most institutions are prepared for. This narrative pivot followed a series of strategic moves. In January, CEO Dario Amodei wrote about a powerful self-improvement feedback loop. In February, Anthropic revised its Responsible Scaling Policy, removing a core commitment to pause training if capabilities outstripped safety controls, citing the risk of falling behind competitors. This change coincided with reported pressure from the US Department of Defense. By May, Anthropic's valuation had soared to $965 billion. Anthropic's stance was mirrored by other industry leaders. DeepMind CEO Demis Hassabis adjusted his AGI timeline to "by 2029" and admitted to using provocative language like "foothills of the singularity" to create urgency. OpenAI also released a model claiming a key role in its own creation process. The article's carefully calibrated tone—presenting dramatic data alongside qualifying footnotes—exemplifies a balancing act between signaling technological acceleration and managing commercial, regulatory, and safety imperatives. External experts offered contrasting interpretations of the same data, from warnings of catastrophic risk akin to Chernobyl to skepticism that current automation merely handles "grunt work," not genius. The coordinated narrative shift among top labs highlights the complex interplay between perceived technical inflection points and strategic communication aimed at investors, regulators, and the public.

marsbit9m ago

Worried about AI's Self-Evolution, Anthropic Intends to Stop Training?

marsbit9m ago

The Macroeconomic Underpinnings of Africa's Payment Market Landscape

The African payments market, characterized by the world's highest mobile money penetration and fastest-growing cryptocurrency adoption, is not a coincidence but a macroeconomic necessity driven by deep structural factors. Two key drivers create this landscape: (1) Africa's heavy reliance on commodity exports, trade, and remittances, generating massive cross-border settlement and remittance demand; and (2) chronically underdeveloped financial infrastructure, exacerbated by international bank de-risking, foreign exchange mismanagement, and persistent inflation. This vacuum has allowed mobile money and crypto to thrive. Mobile money platforms replace banks for domestic payments, while cryptocurrencies serve as a store of value against local currency depreciation and a low-cost medium for cross-border exchange. A crucial division lies along the Sahara Desert. North Africa is integrated into the oil-anchored MENA framework, while Sub-Saharan Africa (SSA), plagued by dollar shortages and fragmented currencies, has become a natural, massive market for mobile money and crypto. Nigeria, Kenya, and South Africa are global leaders in adoption. The SSA economy is deeply dollarized due to currency instability, yet suffers from a severe "dollar shortage" caused by trade deficits and limited export capacity. This creates parallel forex markets and high remittance costs. Cryptocurrencies, particularly stablecoins, fill this gap by providing access to dollar liquidity, cheaper cross-border transfers, and an inflation-resistant store of value, primarily driven by retail users for small-value transactions. While regional initiatives like PAPSS aim to reduce dollar dependence, the fundamental constraints of commodity reliance, trade imbalances, and shallow financial markets persist. Therefore, mobile money and cryptocurrencies are not niche trends but essential financial infrastructure filling a structural void, and they are likely to remain central to Africa's economic landscape for the foreseeable future.

链捕手18m ago

The Macroeconomic Underpinnings of Africa's Payment Market Landscape

链捕手18m ago

Trading

Spot
Futures

Hot Articles

What is $BITCOIN

DIGITAL GOLD ($BITCOIN): A Comprehensive Analysis Introduction to DIGITAL GOLD ($BITCOIN) DIGITAL GOLD ($BITCOIN) is a blockchain-based project operating on the Solana network, which aims to combine the characteristics of traditional precious metals with the innovation of decentralized technologies. While it shares a name with Bitcoin, often referred to as “digital gold” due to its perception as a store of value, DIGITAL GOLD is a separate token designed to create a unique ecosystem within the Web3 landscape. Its goal is to position itself as a viable alternative digital asset, although specifics regarding its applications and functionalities are still developing. What is DIGITAL GOLD ($BITCOIN)? DIGITAL GOLD ($BITCOIN) is a cryptocurrency token explicitly designed for use on the Solana blockchain. In contrast to Bitcoin, which provides a widely recognized value storage role, this token appears to focus on broader applications and characteristics. Notable aspects include: Blockchain Infrastructure: The token is built on the Solana blockchain, known for its capacity to handle high-speed and low-cost transactions. Supply Dynamics: DIGITAL GOLD has a maximum supply capped at 100 quadrillion tokens (100P $BITCOIN), although details regarding its circulating supply are currently undisclosed. Utility: While precise functionalities are not explicitly outlined, there are indications that the token could be utilized for various applications, potentially involving decentralized applications (dApps) or asset tokenization strategies. Who is the Creator of DIGITAL GOLD ($BITCOIN)? At present, the identity of the creators and development team behind DIGITAL GOLD ($BITCOIN) remains unknown. This situation is typical among many innovative projects within the blockchain space, particularly those aligning with decentralized finance and meme coin phenomena. While such anonymity may foster a community-driven culture, it intensifies concerns about governance and accountability. Who are the Investors of DIGITAL GOLD ($BITCOIN)? The available information indicates that DIGITAL GOLD ($BITCOIN) does not have any known institutional backers or prominent venture capital investments. The project seems to operate on a peer-to-peer model focused on community support and adoption rather than traditional funding routes. Its activity and liquidity are primarily situated on decentralized exchanges (DEXs), such as PumpSwap, rather than established centralized trading platforms, further highlighting its grassroots approach. How DIGITAL GOLD ($BITCOIN) Works The operational mechanics of DIGITAL GOLD ($BITCOIN) can be elaborated on based on its blockchain design and network attributes: Consensus Mechanism: By leveraging Solana’s unique proof-of-history (PoH) combined with a proof-of-stake (PoS) model, the project ensures efficient transaction validation contributing to the network's high performance. Tokenomics: While specific deflationary mechanisms have not been extensively detailed, the vast maximum token supply implies that it may cater to microtransactions or niche use cases that are still to be defined. Interoperability: There exists the potential for integration with Solana’s broader ecosystem, including various decentralized finance (DeFi) platforms. However, the details regarding specific integrations remain unspecified. Timeline of Key Events Here is a timeline that highlights significant milestones concerning DIGITAL GOLD ($BITCOIN): 2023: The initial deployment of the token occurs on the Solana blockchain, marked by its contract address. 2024: DIGITAL GOLD gains visibility as it becomes available for trading on decentralized exchanges like PumpSwap, allowing users to trade it against SOL. 2025: The project witnesses sporadic trading activity and potential interest in community-led engagements, although no noteworthy partnerships or technical advancements have been documented as of yet. Critical Analysis Strengths Scalability: The underlying Solana infrastructure supports high transaction volumes, which could enhance the utility of $BITCOIN in various transaction scenarios. Accessibility: The potential low trading price per token could attract retail investors, facilitating wider participation due to fractional ownership opportunities. Risks Lack of Transparency: The absence of publicly known backers, developers, or an audit process may yield skepticism regarding the project's sustainability and trustworthiness. Market Volatility: The trading activity is heavily reliant on speculative behavior, which can result in significant price volatility and uncertainty for investors. Conclusion DIGITAL GOLD ($BITCOIN) emerges as an intriguing yet ambiguous project within the rapidly evolving Solana ecosystem. While it attempts to leverage the “digital gold” narrative, its departure from Bitcoin's established role as a store of value underscores the need for a clearer differentiation of its intended utility and governance structure. Future acceptance and adoption will likely depend on addressing the current opacity and defining its operational and economic strategies more explicitly. Note: This report encompasses synthesised information available as of October 2023, and developments may have transpired beyond the research period.

363 Total ViewsPublished 2025.05.13Updated 2025.05.13

What is $BITCOIN

Discussions

Welcome to the HTX Community. Here, you can stay informed about the latest platform developments and gain access to professional market insights. Users' opinions on the price of BTC (BTC) are presented below.

活动图片