Bitcoin’s Pullback Feels Brutal, But History Says It Could Drag On For Months

bitcoinistPublished on 2026-01-21Last updated on 2026-01-21

Abstract

Bitcoin has fallen below $92,000, signaling continued downside pressure despite efforts by bulls to defend key support levels. Analyst Darkfost notes the current pullback is only 109 days from the last all-time high, much shorter than previous major corrections which lasted over 150 days. While the decline feels intense due to significant realized losses, capitulation, and stressed short-term holders, historical patterns suggest Bitcoin could remain in a choppy recovery phase for months without breaking its broader cycle structure. This cycle is further complicated by ETF-driven institutional demand, potentially leading to longer consolidations and less predictable behavior. Technically, Bitcoin remains below key moving averages, with the $90,000–$88,000 range acting as critical support. A breakdown below this level could target December lows, while reclaiming $92,000 is essential for bullish momentum.

Bitcoin has slipped below the $92,000 level after a sharp decline that began on Sunday, signaling that downside pressure is still shaping market conditions. Despite the drop, bulls are trying to defend current levels and regain control, with many traders watching for a rebound that could restore confidence across the broader crypto market. The move comes at a sensitive moment, as risk appetite remains fragile and short-term volatility continues to shake out leveraged positioning.

Top analyst Darkfost highlighted that the market is now 109 days removed from Bitcoin’s last all-time high, placing the current drawdown into a wider cycle context. In previous major corrections, Bitcoin spent far longer in recovery mode, including 236 days between March 2024 and November, followed by another 154-day correction window between December 2024 and May 2025. Compared to those periods, the current pullback may still be early in its timeline, even if price action already feels aggressive.
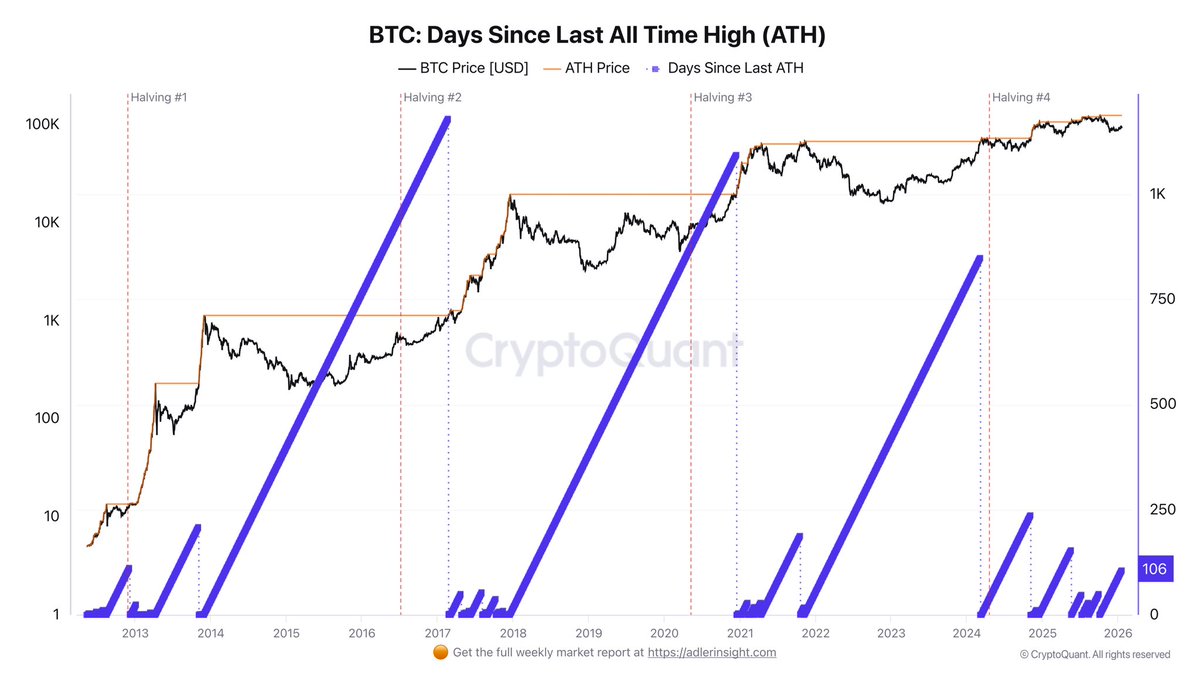
Bitcoin Days Since last ATH | Source: CryptoQuant

What makes this correction stand out is the intensity of the pain across the market. Realized losses have stacked up, capitulation has been more visible, and short-term holders appear increasingly stressed, creating the sense that this decline is heavier than past resets. Even so, history suggests Bitcoin can remain in a choppy recovery phase for months without breaking the broader cycle structure.

Capitulation Builds, But the Cycle May Still Be Intact

Bitcoin’s recent decline has not been a “clean” pullback. Realized losses have stacked up, capitulation has looked aggressive, and short-term holders remain under heavy pressure as the market punishes late entries and weak conviction. Liquidation data has also shown how leverage has amplified the downside, with forced selling accelerating drops that might have otherwise played out more gradually. That backdrop is exactly why the correction feels so violent, even compared to past drawdowns.

However, Darkfost argues this phase still fits within the broader rhythm of Bitcoin’s cycle. His key point is that extended corrections are not unusual, even when they feel unusually painful in real time. From that perspective, the market could easily spend more months digesting losses and rebuilding positioning without signaling a full structural breakdown.

Where this cycle becomes more complex is the macro timing. Unlike previous cycles, Bitcoin’s post-bear all-time high and the halving narrative have overlapped with a new variable: ETF-driven demand. That shift changes how drawdowns develop, because deeper pools of institutional capital can absorb supply differently than retail-led rallies. If this institutional trend continues, Bitcoin may be transitioning into a structurally different market regime, with longer consolidations and less predictable “four-year cycle” behavior.

Bitcoin Slips Below Key Averages as Bulls Defend $90K Support

Bitcoin is back under pressure after failing to hold above the $92,000 zone, with the chart showing price sliding toward $91,300 as selling accelerates. The move keeps BTC trapped below major moving averages, reinforcing the idea that this rebound is still fragile and highly reactive to headline-driven volatility. After the January recovery attempt, the rejection near the descending resistance structure highlights that sellers remain active on rallies, limiting bullish follow-through.
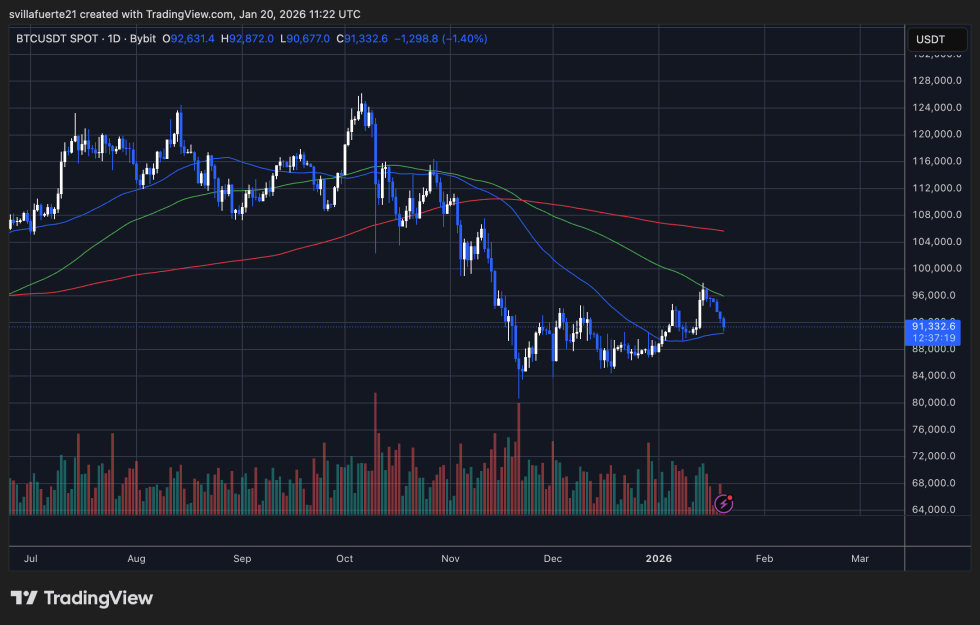
BTC testing key demand level | Source: BTCUSDT Chart on TradingView

Technically, the market continues to trade beneath the 50-day and 100-day trend lines, while the longer-term averages remain overhead, acting as dynamic resistance. This structure suggests BTC is still in a corrective phase rather than a confirmed trend reversal, despite short-term optimism earlier this month. Volume also shows a lack of sustained demand expansion, supporting the view that buyers are defending levels, but not fully regaining control.

The $90,000–$88,000 range now stands out as a critical support area, as it has acted as a base during recent consolidation. A clean breakdown below it could reopen downside risk toward the December lows, while a hold could keep the market building a recovery structure. For bulls, the first step is stabilizing above $92,000 again, then reclaiming the mid-$90,000s to shift momentum back in their favor.

Featured image from ChatGPT, chart from TradingView.com

Trending Cryptos

Related Questions

QAccording to the article, how many days has it been since Bitcoin's last all-time high, and how does this compare to previous major corrections?

AThe market is 109 days removed from Bitcoin's last all-time high. This is shorter than previous major corrections, which lasted 236 days and 154 days respectively.

QWhat key factor does analyst Darkfost highlight that makes the current correction feel more painful than past ones?

ADarkfost highlights that realized losses have stacked up, capitulation has been more visible, and short-term holders are under heavy pressure, creating a sense that this decline is heavier. Additionally, leverage has amplified the downside with forced selling.

QWhat new variable in this cycle, according to the article, changes how Bitcoin drawdowns develop compared to previous cycles?

AThe new variable is ETF-driven demand from deeper pools of institutional capital, which can absorb supply differently than retail-led rallies, potentially leading to longer consolidations and less predictable cycle behavior.

QWhat is identified as a critical support area for Bitcoin's price in the article, and what are the potential consequences of a breakdown below it?

AThe $90,000–$88,000 range is identified as a critical support area. A clean breakdown below it could reopen downside risk toward the December lows, while holding it could allow the market to continue building a recovery structure.

QWhat technical indicators suggest that Bitcoin is still in a corrective phase rather than a confirmed trend reversal?

ABitcoin is trading beneath the 50-day and 100-day moving averages, with the longer-term averages acting as overhead resistance. Additionally, volume shows a lack of sustained demand expansion, indicating buyers are defending levels but not fully regaining control.

Related Reads

human.tech Launches Clean SDK for Privacy-First Web3 Apps

human.tech has launched the Clean SDK, a toolkit enabling developers to build privacy-first Web3 applications with transparent accountability. Released alongside Aztec's version 5, the SDK provides components for integrating zero-knowledge identity verification, sanctions screening, and private transactions, without developers handling sensitive user data or building compliance infrastructure from scratch. It uses zero-knowledge proofs and programmable verification to allow apps to confirm user legitimacy and sanctions compliance while keeping identities confidential. The first application built on the SDK, Shield, a privacy bridge to Aztec, also launched. It allows users to transfer assets privately while proving a unique human is behind each transfer and that funds have passed sanctions checks, as verified by a May 2026 audit. The SDK offers three core verification techniques: Proof of Innocence (sanctions screening against 23 sources), Proof of Personhood (simpler verification via Human Passport), and Proof of Clean Hands (higher-assurance zero-knowledge government ID checks). This allows apps to authenticate users and transactions without exposing personal data. Designed for Aztec builders, the SDK lets developers add programmable privacy to decentralized apps, eliminating the need to create their own verification and ZK infrastructure. Shield demonstrates its practical use for private bridges, but the SDK aims to enable a wider ecosystem of private, accountable financial apps and services. The launch addresses growing demand for infrastructure that balances privacy and accountability. The SDK avoids traditional identity databases, storing encrypted data off-chain, screening at both entry and exit points, and including a gated disclosure mechanism for legal requests. human.tech's products, including the Clean SDK, focus on using zero-knowledge technology to enable verifiable personhood and privacy in digital systems.

TheNewsCrypto13m ago

human.tech Launches Clean SDK for Privacy-First Web3 Apps

TheNewsCrypto13m ago

Unlocking $100 Million in Liquidity? Pump.fun's New Policy Tests the 5-Minute Pump Technique

Pump.fun, a popular meme coin launchpad, has introduced a new standard mechanism called BOOST. It aims to address a significant capital efficiency issue: when a newly launched token graduates from its initial bonding curve to a liquidity pool (LP), roughly 20% of its liquidity becomes permanently locked as "dead liquidity," estimated to waste over $100 million annually. Instead of locking these funds permanently, BOOST repurposes them. Upon a token's migration, approximately 20% of the settlement funds (e.g., 17.6 SOL or ~$2516 USDC) are used to buy back the token on the open market over a 5-minute period via a Time-Weighted Average Price (TWAP) mechanism. All purchased tokens are immediately burned. This creates a brief, systematic buy pressure immediately after migration, potentially generating a short-term price surge ("pump") while permanently reducing the token's circulating supply. The goal is to enhance the immediate post-launch trading experience, potentially increasing trader retention and sustainable protocol revenue, which funds ongoing token buybacks. However, concerns exist that this artificial 5-minute boost could lower the barrier for launching low-quality tokens and lead to steeper price crashes once the buy pressure stops, if followed by large sell-offs. The feature automatically applies to tokens migrating after July 21, 2024, but not to previously migrated tokens or those launched via the Mayhem AI Agent lab.

marsbit21m ago

Unlocking $100 Million in Liquidity? Pump.fun's New Policy Tests the 5-Minute Pump Technique

marsbit21m ago

Podcast Notes | Conversation with GSR Asset Management Head: To Determine if This Crypto Rally is Real, Just Watch the Lending Rates on Aave

Podcast Summary: Dialogue with GSR's Head of Asset Management: To Determine if This Crypto Rally is Real, Just Check Lending Rates on Aave Andy Baehr, Managing Director of Asset Management at GSR, discusses the current crypto market, characterizing it as stuck in a state of "ambivalence" with short-lived, unsustainable rallies. He outlines a simple framework: the market moves between "ambivalence" and "conviction" (sustained upward momentum). Currently, every rally resembles a single-stage rocket booster that quickly fizzles out. Baehr identifies three key signals to watch: 1) DeFi lending rates, 2) the potential passage of the CLARITY Act, and 3) the market forming a consensus on the "Fed hawkish peak." He emphasizes that the most immediate indicator for the sustainability of the recent CPI-triggered rally is the USDC borrowing rate on Aave, currently around 3.75%—close to U.S. Treasury yields. The absence of a credit spread indicates low leverage demand and a lack of market energy. He explains that a healthy, sustained rally requires layered buying pressure. Last year's rally progressed from an ETH short squeeze to crypto-native trader influx and finally to ETF inflows. Currently, this structure is missing. Other potential structural buyers like Digital Asset Treasury (DAT) companies are absent, and ETF flows have proven transient. Baehr notes that while small-cap crypto tokens outperformed large caps in Q2—a potential sign of capitation in major assets—capital is also flowing to more exciting opportunities like AI stocks and tech IPOs, leaving crypto sidelined. Regarding DeFi, he highlights that platforms like Aave provide a clear, real-time signal of leverage demand through their supply/demand-driven interest rates. A significant, sustained rate increase would signal genuine market conviction. He also observes the quiet emergence of fixed-income-like products and vaults in DeFi. On regulation, the probability of the CLARITY Act passing before the August 7th deadline has dropped linearly from 75% to below 40% on Polymarket. Baehr suggests its passage would be treated as a bullish surprise, a potent driver for price movement. However, political hurdles, including ethical clause debates and disclosures about the First Family's crypto profits, remain significant obstacles. Ultimately, the market awaits clarity on the Fed's terminal rate under Chair Warsh. Until the "Fed Solstice"—the point where the market collectively understands the peak of hawkish policy—sustained conviction will be difficult to achieve.

marsbit52m ago

Podcast Notes | Conversation with GSR Asset Management Head: To Determine if This Crypto Rally is Real, Just Watch the Lending Rates on Aave

marsbit52m ago

Trading

Spot

Hot Articles

What is $BITCOIN

DIGITAL GOLD ($BITCOIN): A Comprehensive Analysis Introduction to DIGITAL GOLD ($BITCOIN) DIGITAL GOLD ($BITCOIN) is a blockchain-based project operating on the Solana network, which aims to combine the characteristics of traditional precious metals with the innovation of decentralized technologies. While it shares a name with Bitcoin, often referred to as “digital gold” due to its perception as a store of value, DIGITAL GOLD is a separate token designed to create a unique ecosystem within the Web3 landscape. Its goal is to position itself as a viable alternative digital asset, although specifics regarding its applications and functionalities are still developing. What is DIGITAL GOLD ($BITCOIN)? DIGITAL GOLD ($BITCOIN) is a cryptocurrency token explicitly designed for use on the Solana blockchain. In contrast to Bitcoin, which provides a widely recognized value storage role, this token appears to focus on broader applications and characteristics. Notable aspects include: Blockchain Infrastructure: The token is built on the Solana blockchain, known for its capacity to handle high-speed and low-cost transactions. Supply Dynamics: DIGITAL GOLD has a maximum supply capped at 100 quadrillion tokens (100P $BITCOIN), although details regarding its circulating supply are currently undisclosed. Utility: While precise functionalities are not explicitly outlined, there are indications that the token could be utilized for various applications, potentially involving decentralized applications (dApps) or asset tokenization strategies. Who is the Creator of DIGITAL GOLD ($BITCOIN)? At present, the identity of the creators and development team behind DIGITAL GOLD ($BITCOIN) remains unknown. This situation is typical among many innovative projects within the blockchain space, particularly those aligning with decentralized finance and meme coin phenomena. While such anonymity may foster a community-driven culture, it intensifies concerns about governance and accountability. Who are the Investors of DIGITAL GOLD ($BITCOIN)? The available information indicates that DIGITAL GOLD ($BITCOIN) does not have any known institutional backers or prominent venture capital investments. The project seems to operate on a peer-to-peer model focused on community support and adoption rather than traditional funding routes. Its activity and liquidity are primarily situated on decentralized exchanges (DEXs), such as PumpSwap, rather than established centralized trading platforms, further highlighting its grassroots approach. How DIGITAL GOLD ($BITCOIN) Works The operational mechanics of DIGITAL GOLD ($BITCOIN) can be elaborated on based on its blockchain design and network attributes: Consensus Mechanism: By leveraging Solana’s unique proof-of-history (PoH) combined with a proof-of-stake (PoS) model, the project ensures efficient transaction validation contributing to the network's high performance. Tokenomics: While specific deflationary mechanisms have not been extensively detailed, the vast maximum token supply implies that it may cater to microtransactions or niche use cases that are still to be defined. Interoperability: There exists the potential for integration with Solana’s broader ecosystem, including various decentralized finance (DeFi) platforms. However, the details regarding specific integrations remain unspecified. Timeline of Key Events Here is a timeline that highlights significant milestones concerning DIGITAL GOLD ($BITCOIN): 2023: The initial deployment of the token occurs on the Solana blockchain, marked by its contract address. 2024: DIGITAL GOLD gains visibility as it becomes available for trading on decentralized exchanges like PumpSwap, allowing users to trade it against SOL. 2025: The project witnesses sporadic trading activity and potential interest in community-led engagements, although no noteworthy partnerships or technical advancements have been documented as of yet. Critical Analysis Strengths Scalability: The underlying Solana infrastructure supports high transaction volumes, which could enhance the utility of $BITCOIN in various transaction scenarios. Accessibility: The potential low trading price per token could attract retail investors, facilitating wider participation due to fractional ownership opportunities. Risks Lack of Transparency: The absence of publicly known backers, developers, or an audit process may yield skepticism regarding the project's sustainability and trustworthiness. Market Volatility: The trading activity is heavily reliant on speculative behavior, which can result in significant price volatility and uncertainty for investors. Conclusion DIGITAL GOLD ($BITCOIN) emerges as an intriguing yet ambiguous project within the rapidly evolving Solana ecosystem. While it attempts to leverage the “digital gold” narrative, its departure from Bitcoin's established role as a store of value underscores the need for a clearer differentiation of its intended utility and governance structure. Future acceptance and adoption will likely depend on addressing the current opacity and defining its operational and economic strategies more explicitly. Note: This report encompasses synthesised information available as of October 2023, and developments may have transpired beyond the research period.

973 Total ViewsPublished 2025.05.13Updated 2025.05.13

What is $BITCOIN

Discussions

Welcome to the HTX Community. Here, you can stay informed about the latest platform developments and gain access to professional market insights. Users' opinions on the price of BTC (BTC) are presented below.

活动图片