Bitcoin Sees Post-Capitulation Conditions Align: Selling Pressure Falls 80%

bitcoinistPublished on 2025-12-30Last updated on 2025-12-30

Abstract

Bitcoin remains below $90,000, with repeated rejections fueling bearish sentiment. However, on-chain analysis by Axel Adler indicates a significant reduction in selling pressure. The realized loss z-score, which peaked between 8.7–10.9 in November with over $5 billion in daily losses, fell sharply by late December to around 1.6. Weekly realized losses dropped from $2.4 billion to approximately $0.5 billion, signaling seller exhaustion. The Net Realized Profit/Loss metric, though still negative, improved markedly in late December, shrinking its negative value by nearly half. This improvement occurred without a strong price rebound, suggesting the change stems from structural selling exhaustion rather than speculative activity. Historically, such conditions precede market stabilization and potential recovery, positioning January as a possible inflection point if new demand emerges.

Bitcoin continues to trade below the $90,000 level after multiple failed attempts to break higher since December 14, reinforcing a growing sense of caution across the market. Each rejection near this psychological threshold has added weight to the bearish narrative, with an increasing number of analysts now warning that Bitcoin may be entering a prolonged corrective phase in the year ahead.

Despite this muted price action, on-chain data suggests a more nuanced picture beneath the surface. Top analyst Axel Adler recently shared a chart tracking Bitcoin realized losses using a seven-day moving average and a z-score framework, highlighting a clear transition from November’s extreme capitulation to a period of normalization in December.
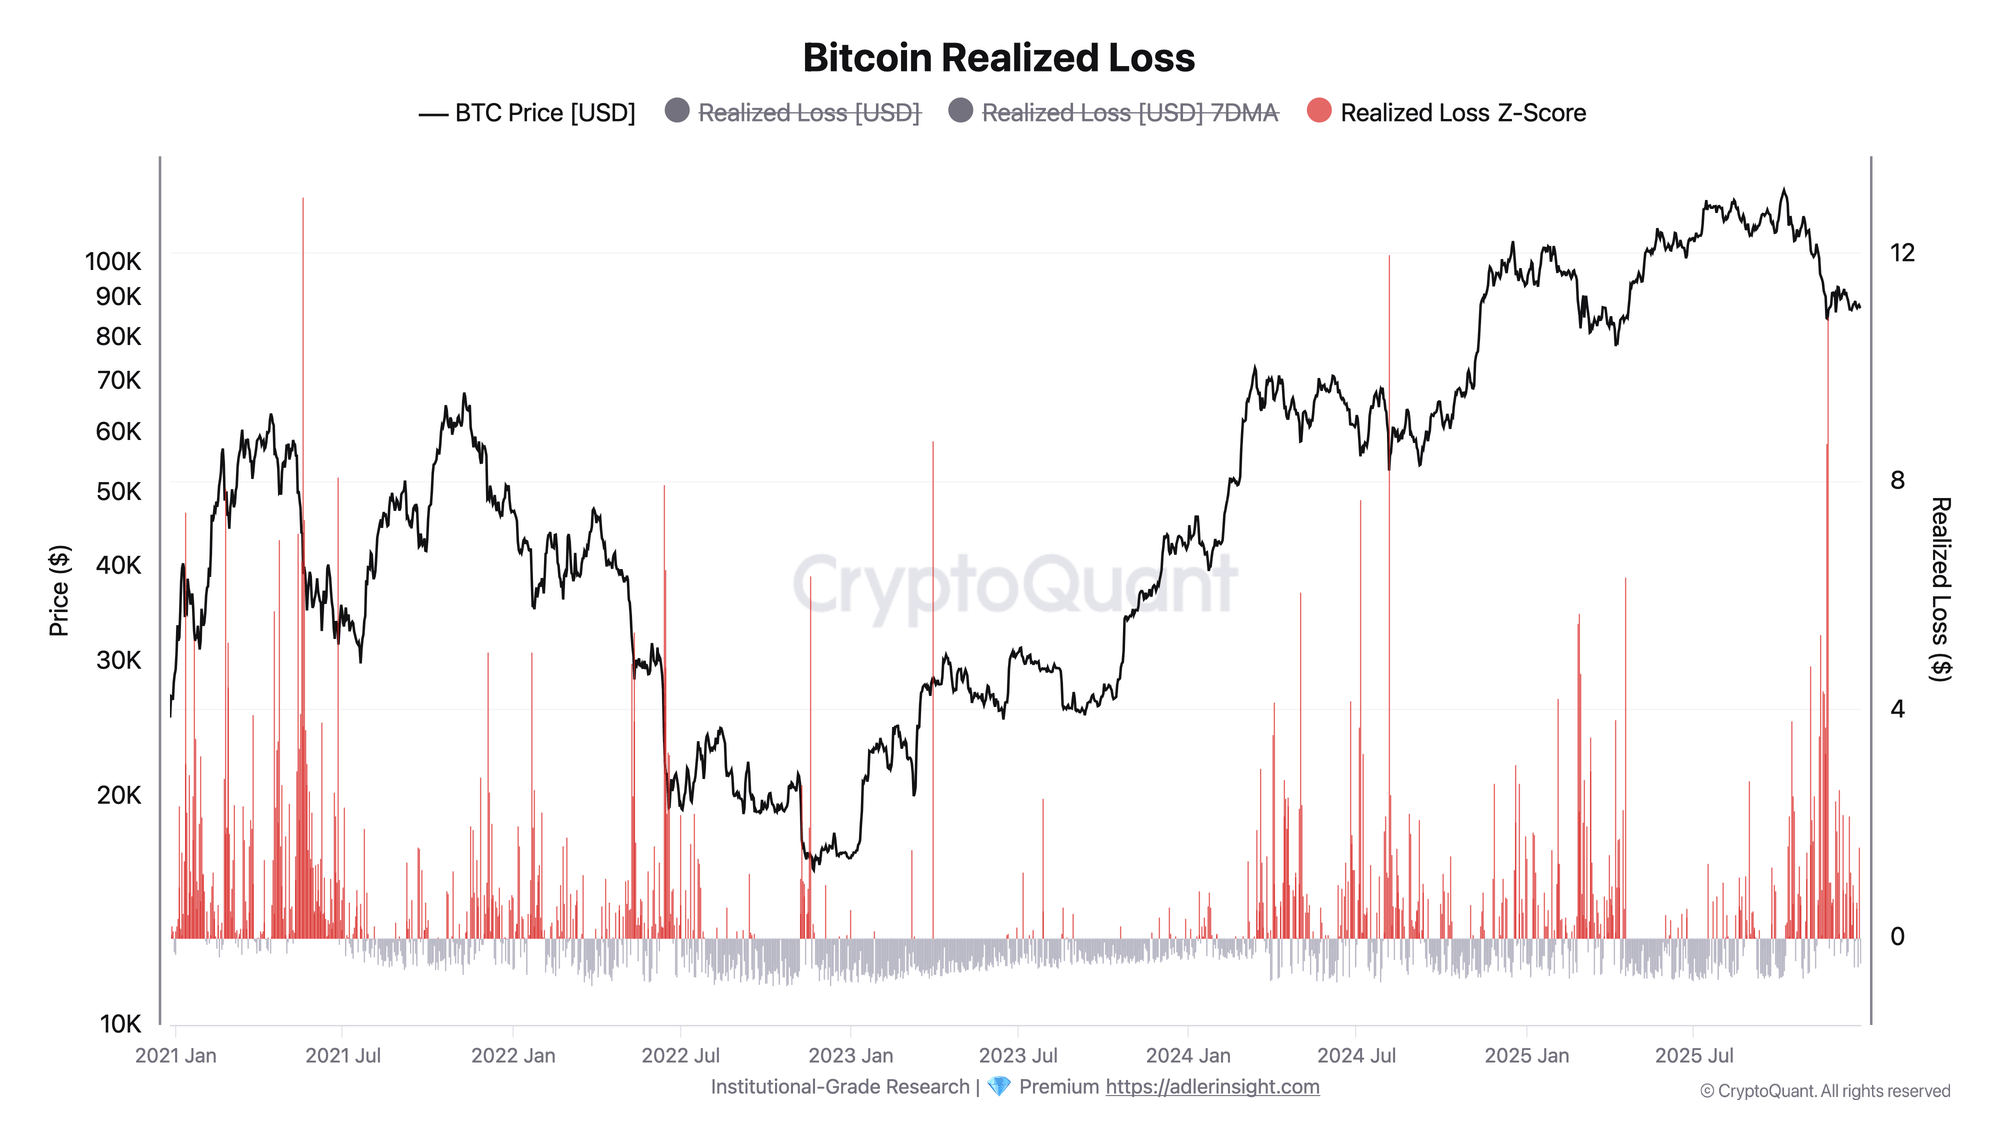
Bitcoin Realized Loss (Z-Score) | Source: Axel Adler

This metric measures the volume of losses realized when coins move, with the z-score used to identify stress extremes within the market.

November marked the peak of selling pressure. On November 21–22, the realized loss z-score surged to between 8.7 and 10.9, with daily losses exceeding $5 billion. In comparison, the late-December spike on December 26, which reached a z-score near 1.6, appears relatively minor. More importantly, weekly realized losses have collapsed from roughly $2.4 billion at the peak to around $0.5 billion, returning to levels last seen in September and October.

According to Adler, this sharp decline points to structural seller exhaustion rather than a temporary lull. Historically, markets often stabilize after such conditions, suggesting that while the price remains weak, downside pressure may be fading.

Bitcoin Indicator Signals Fading Downside Pressure

Adler’s report also highlights Bitcoin’s Net Realized Profit/Loss (P/L) metric, smoothed using a seven-day moving average, offering further insight into the market’s internal dynamics. This indicator tracks the balance between realized profits and realized losses over time. When the value is negative, losses dominate and capital is being destroyed; when positive, profit-taking outweighs loss realization.

Currently, Bitcoin’s net realized P/L remains in negative territory, confirming that the market has not fully exited a risk-off regime. However, the direction of travel is notable. Over the final week of December, the depth of negative net P/L shrank by nearly half, signaling a meaningful reduction in loss intensity.
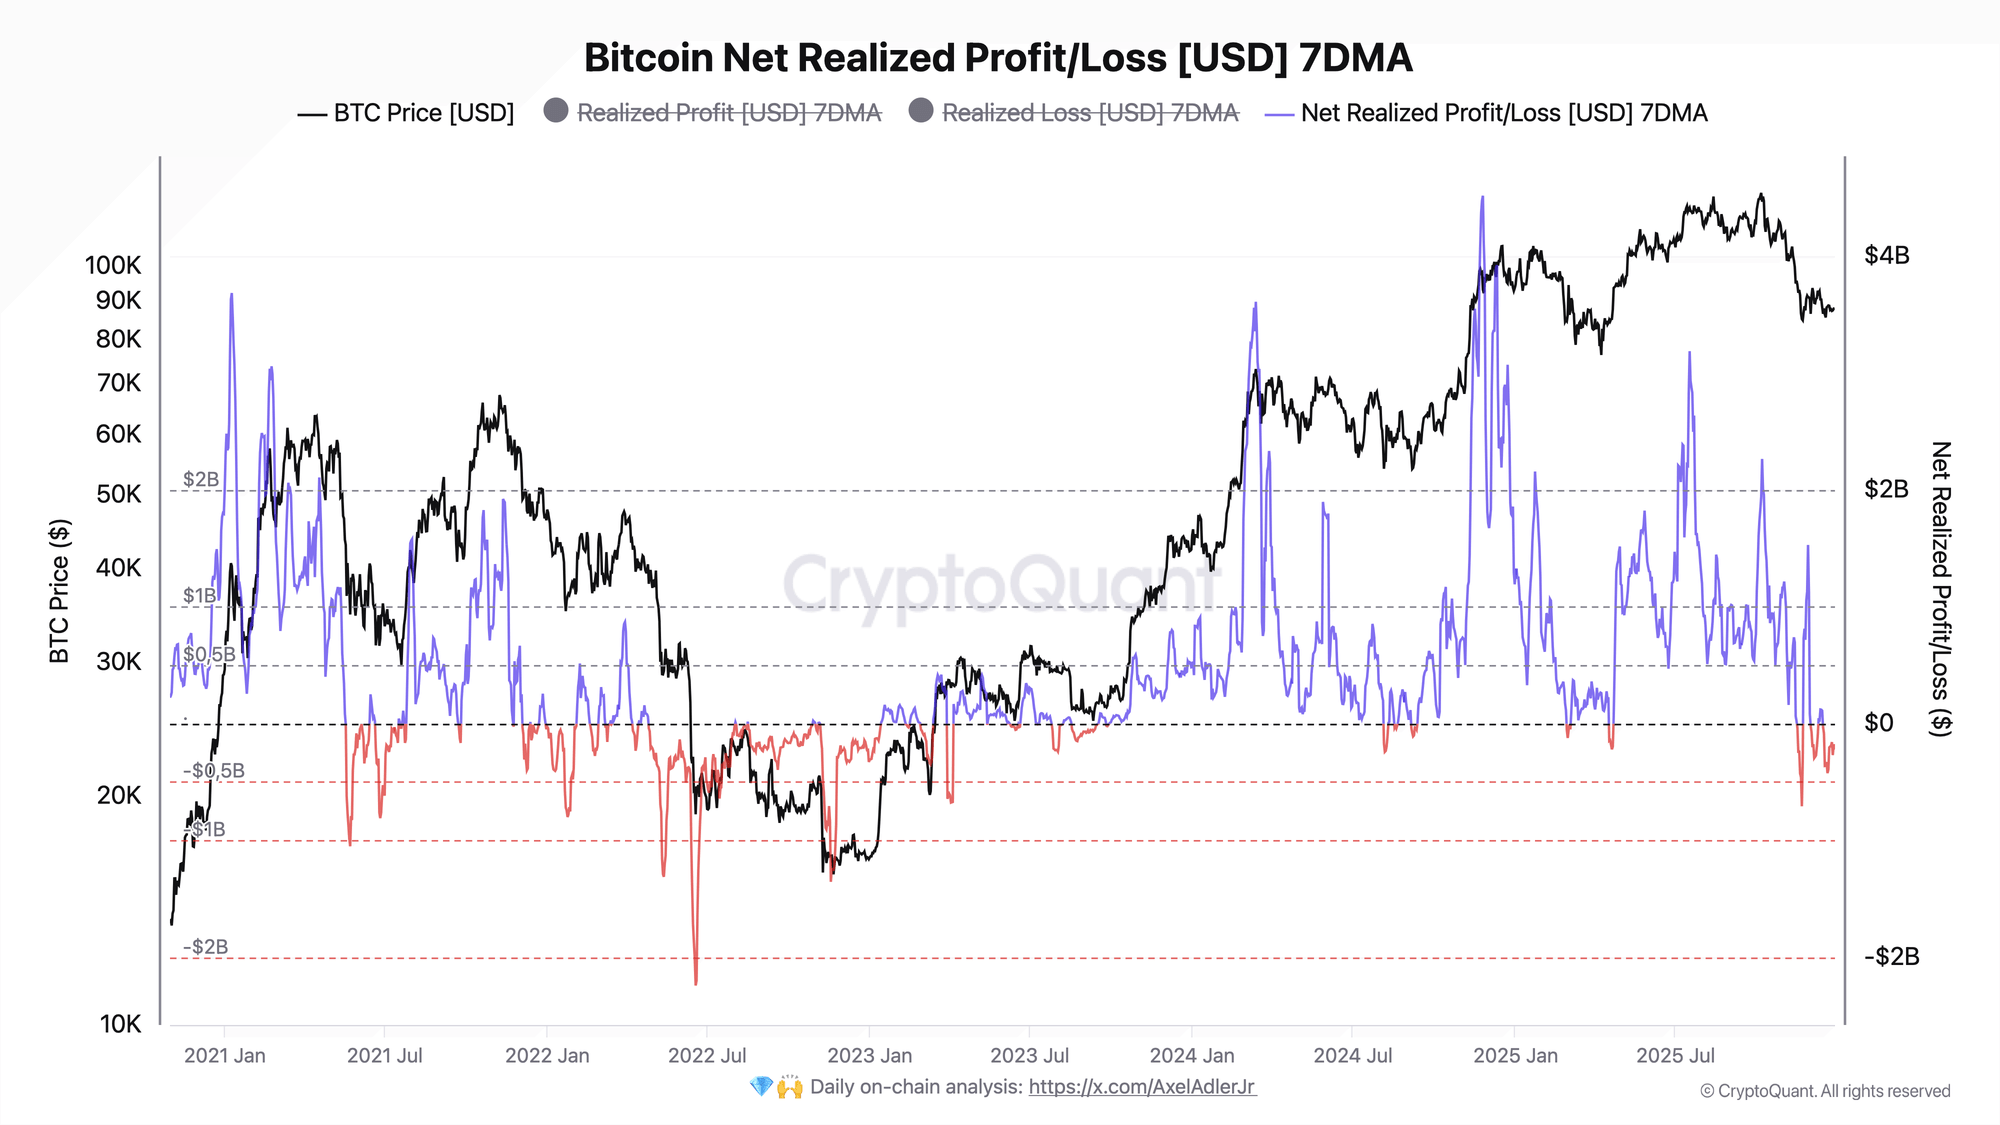
Bitcoin Net Realized Profit/Loss | Source: CryptoQuant

Importantly, this improvement has unfolded without a strong price recovery, suggesting that the change is driven by seller exhaustion rather than an artificial price squeeze or short-term speculation.

According to Adler, this behavior is structurally significant. When net realized P/L trends upward toward the zero line, it reflects a transition phase in which forced selling subsides, and marginal supply weakens. Historically, a sustained move back into positive territory has coincided with the early stages of local market recoveries.

Taken together, the realized loss and net P/L charts present a consistent narrative. November appears to have absorbed the majority of weak hands, December functioned as an absorption and stabilization phase, and January could represent a potential inflection point—provided new demand begins to enter the market.


Trending Cryptos

Related Questions

QWhat does the on-chain data indicate about Bitcoin's selling pressure in December compared to November?

AThe on-chain data shows a sharp decline in selling pressure in December. The realized loss z-score dropped from peaks of 8.7-10.9 in November to around 1.6 in late December, and weekly realized losses collapsed from roughly $2.4 billion to around $0.5 billion, indicating an 80% reduction in selling pressure.

QAccording to analyst Axel Adler, what does the collapse in weekly realized losses signify for the Bitcoin market?

AAccording to Axel Adler, the collapse in weekly realized losses points to structural seller exhaustion rather than a temporary lull. Historically, markets often stabilize after such conditions, suggesting that downside pressure may be fading.

QWhat is the significance of Bitcoin's Net Realized Profit/Loss metric trending upward toward the zero line?

AWhen Bitcoin's Net Realized P/L trends upward toward the zero line, it reflects a transition phase where forced selling subsides and marginal supply weakens. Historically, a sustained move back into positive territory has coincided with the early stages of local market recoveries.

QHow did the market behavior in the final week of December demonstrate a reduction in loss intensity?

AIn the final week of December, the depth of negative net realized P/L shrank by nearly half, signaling a meaningful reduction in loss intensity. This improvement occurred without a strong price recovery, indicating it was driven by seller exhaustion rather than artificial price movements.

QWhat three-phase narrative do the realized loss and net P/L charts present for the Bitcoin market?

AThe charts present a narrative where November absorbed the majority of weak hands (capitulation), December functioned as an absorption and stabilization phase, and January could represent a potential inflection point—provided new demand begins to enter the market.

Related Reads

After R&D Investment Catches Up with the U.S., Is the Sino-U.S. Chip Competition Still Just About Money?

The article examines the significance of recent data showing China's total R&D expenditure, measured by purchasing power parity (PPP), catching up to or slightly surpassing that of the United States in 2024. It argues that while this milestone reflects China's immense capacity to mobilize research resources, the competition in semiconductors now extends far beyond sheer financial input. The analysis highlights key differences: China's R&D is heavily skewed towards experimental development (over 80%), focusing on product engineering and industrialization, whereas the U.S. allocates a proportionally larger share (about 15%) to basic research. Furthermore, leading U.S. semiconductor firms reinvest a significant portion of their substantial global sales revenue into R&D, creating a sustainable commercial innovation cycle that is difficult to replicate. The article emphasizes that semiconductor progress depends on converting R&D into commercially viable products that pass rigorous customer validation and achieve repeat orders, not just on spending levels. It concludes that as China enters the top tier of R&D spenders, the critical challenges shift to improving resource allocation efficiency, fostering long-term basic research, and building effective mechanisms to bridge the gap between laboratory discoveries and reliable, market-ready industrial capabilities.

marsbit10m ago

After R&D Investment Catches Up with the U.S., Is the Sino-U.S. Chip Competition Still Just About Money?

marsbit10m ago

Top 10% of American Households Capture 88% of Wealth, How Is the AI Era Cake Divided?

AI Worsens Wealth Inequality as Top 10% of US Families Garner 88% of Stock Gains (2019-2026) A report from the China Finance 40 Forum highlights that the AI boom is significantly widening wealth inequality in the United States. From 2019 to Q1 2026, wealth from directly held stocks by US households nearly doubled from $29 trillion to approximately $55 trillion, with rapid growth concentrated post-2023, coinciding with the AI-driven stock market surge. The distribution of these gains has been starkly uneven. Between 2022 and Q1 2026, the wealth increase of about $21 trillion was captured almost entirely by the wealthiest families: the top 10% secured roughly 88% ($18.5 trillion), while the bottom 50% received only about 1% ($0.2 trillion). This has contributed to a growing disparity in disposable income shares. The report, referencing economic historian Robert Allen, draws parallels to historical technological shifts like the "Engels' Pause" during the First Industrial Revolution, where worker wages stagnated despite productivity gains. It suggests AI could induce a similar period where capital收益 outpace labor income, exacerbating inequality. Huang Yiping of Peking University identifies four mechanisms through which AI impacts income distribution: capital-bias (reducing labor's income share), task polarization (hollowing out middle-skill jobs), skill-based digital divides, and wealth amplification through assets. He warns that if this trend continues, strong supply growth driven by AI could be undermined by persistently weak consumer demand, threatening sustainable economic growth. To address these challenges, the report proposes a three-pronged strategy: 1) Defensive measures like strengthening social safety nets and antitrust enforcement; 2) Empowering workers through education reform and lifelong learning to collaborate with AI; and 3) Rebalancing via policies such as potential taxes on AI超额收益 and mechanisms for broader sharing of technology's benefits, ensuring AI's红利 are more equitably distributed.

marsbit15m ago

Top 10% of American Households Capture 88% of Wealth, How Is the AI Era Cake Divided?

marsbit15m ago

Trading

Spot

Hot Articles

What is $BITCOIN

DIGITAL GOLD ($BITCOIN): A Comprehensive Analysis Introduction to DIGITAL GOLD ($BITCOIN) DIGITAL GOLD ($BITCOIN) is a blockchain-based project operating on the Solana network, which aims to combine the characteristics of traditional precious metals with the innovation of decentralized technologies. While it shares a name with Bitcoin, often referred to as “digital gold” due to its perception as a store of value, DIGITAL GOLD is a separate token designed to create a unique ecosystem within the Web3 landscape. Its goal is to position itself as a viable alternative digital asset, although specifics regarding its applications and functionalities are still developing. What is DIGITAL GOLD ($BITCOIN)? DIGITAL GOLD ($BITCOIN) is a cryptocurrency token explicitly designed for use on the Solana blockchain. In contrast to Bitcoin, which provides a widely recognized value storage role, this token appears to focus on broader applications and characteristics. Notable aspects include: Blockchain Infrastructure: The token is built on the Solana blockchain, known for its capacity to handle high-speed and low-cost transactions. Supply Dynamics: DIGITAL GOLD has a maximum supply capped at 100 quadrillion tokens (100P $BITCOIN), although details regarding its circulating supply are currently undisclosed. Utility: While precise functionalities are not explicitly outlined, there are indications that the token could be utilized for various applications, potentially involving decentralized applications (dApps) or asset tokenization strategies. Who is the Creator of DIGITAL GOLD ($BITCOIN)? At present, the identity of the creators and development team behind DIGITAL GOLD ($BITCOIN) remains unknown. This situation is typical among many innovative projects within the blockchain space, particularly those aligning with decentralized finance and meme coin phenomena. While such anonymity may foster a community-driven culture, it intensifies concerns about governance and accountability. Who are the Investors of DIGITAL GOLD ($BITCOIN)? The available information indicates that DIGITAL GOLD ($BITCOIN) does not have any known institutional backers or prominent venture capital investments. The project seems to operate on a peer-to-peer model focused on community support and adoption rather than traditional funding routes. Its activity and liquidity are primarily situated on decentralized exchanges (DEXs), such as PumpSwap, rather than established centralized trading platforms, further highlighting its grassroots approach. How DIGITAL GOLD ($BITCOIN) Works The operational mechanics of DIGITAL GOLD ($BITCOIN) can be elaborated on based on its blockchain design and network attributes: Consensus Mechanism: By leveraging Solana’s unique proof-of-history (PoH) combined with a proof-of-stake (PoS) model, the project ensures efficient transaction validation contributing to the network's high performance. Tokenomics: While specific deflationary mechanisms have not been extensively detailed, the vast maximum token supply implies that it may cater to microtransactions or niche use cases that are still to be defined. Interoperability: There exists the potential for integration with Solana’s broader ecosystem, including various decentralized finance (DeFi) platforms. However, the details regarding specific integrations remain unspecified. Timeline of Key Events Here is a timeline that highlights significant milestones concerning DIGITAL GOLD ($BITCOIN): 2023: The initial deployment of the token occurs on the Solana blockchain, marked by its contract address. 2024: DIGITAL GOLD gains visibility as it becomes available for trading on decentralized exchanges like PumpSwap, allowing users to trade it against SOL. 2025: The project witnesses sporadic trading activity and potential interest in community-led engagements, although no noteworthy partnerships or technical advancements have been documented as of yet. Critical Analysis Strengths Scalability: The underlying Solana infrastructure supports high transaction volumes, which could enhance the utility of $BITCOIN in various transaction scenarios. Accessibility: The potential low trading price per token could attract retail investors, facilitating wider participation due to fractional ownership opportunities. Risks Lack of Transparency: The absence of publicly known backers, developers, or an audit process may yield skepticism regarding the project's sustainability and trustworthiness. Market Volatility: The trading activity is heavily reliant on speculative behavior, which can result in significant price volatility and uncertainty for investors. Conclusion DIGITAL GOLD ($BITCOIN) emerges as an intriguing yet ambiguous project within the rapidly evolving Solana ecosystem. While it attempts to leverage the “digital gold” narrative, its departure from Bitcoin's established role as a store of value underscores the need for a clearer differentiation of its intended utility and governance structure. Future acceptance and adoption will likely depend on addressing the current opacity and defining its operational and economic strategies more explicitly. Note: This report encompasses synthesised information available as of October 2023, and developments may have transpired beyond the research period.

1.1k Total ViewsPublished 2025.05.13Updated 2025.05.13

What is $BITCOIN

Discussions

Welcome to the HTX Community. Here, you can stay informed about the latest platform developments and gain access to professional market insights. Users' opinions on the price of BTC (BTC) are presented below.

活动图片