Bitcoin Created An Imperfection And The Price Will Crash Lower To Fill It

bitcoinistPublished on 2026-04-24Last updated on 2026-04-24

Abstract

Bitcoin's recent rally to over $79,000 created a price imbalance, or "imperfection," that analysts argue is likely to be filled. According to crypto analyst Minga, a head-and-shoulders pattern is forming on the 4-hour chart, with a rejection zone between $76,800 and $77,400. If completed, this bearish pattern could lead to a breakdown, targeting support near $70,450. Key levels to watch are the monthly high of $76,053; a break below it would confirm the downtrend, while a push above $78,332 could invalidate the bearish outlook and target the fair value gap above $79,000. Bitcoin is currently trading near the upper rejection zone at around $77,640.

Bitcoin’s recent price has carried the price action into a zone that one analyst believes was never meant to hold. The cryptocurrency climbed to $78,000 over the weekend and even pushed above $79,380 in the past 24 hours.

Technical analysis shows that in doing so, it left behind an unresolved imperfection, which is a price imbalance that markets have a well-documented tendency to revisit.

The Weekend Rally Left Behind A Debt

Crypto analyst Minga, writing on X, identified a dynamic playing out on Bitcoin’s 4-hour candlestick timeframe chart. According to the analyst, BTC is currently in the process of filling the imbalance created over the weekend. The development visible on Minga’s chart is the formation of a head-and-shoulders pattern, which is one of the most reliable bearish reversal signals in technical analysis.

The left shoulder and the head have already formed, and Bitcoin is now in the process of completing the right shoulder. The analyst identified a rejection zone between $76,800 and $77,400, which is shown on the chart below in red, as the area where that right shoulder is most likely to top out.
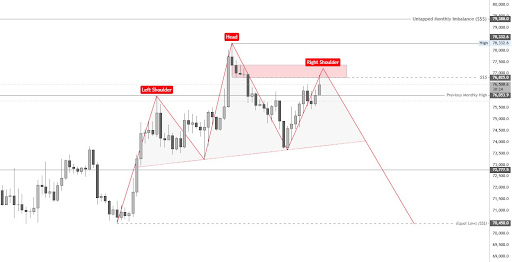
Source: Chart from Minga on X

If this formation completes, it would signal a change from upward momentum into distribution, where larger players begin offloading positions. The neckline of this pattern sits around the mid-$73,000 region, which also coincides with a rising trendline that has supported price in recent sessions.

Where Does Bitcoin Go From Here?

This technical analysis proposes that the current push higher might only be a retest, and once the right shoulder is complete, the structure calls for a breakdown. The important level to watch on the way down is the previous monthly high, currently sitting at $76,053.

According to Minga, a rejection at the $76,800 to $77,400 red box must be followed by a break below that monthly high on the subsequent revisit. Should the pattern play out as the analyst projected, the chart points toward two notable downside reference points. The first reference point is the equal low level around $70,450, which is labeled on the chart above as a liquidity target.

Failure to break below the previous monthly high at $76,053 would invalidate the bearish scenario and give us another push toward the highs to take out the Monthly FVG above $79,000.

The second reference point is an untapped monthly imbalance of $79,388, which represents the opposing scenario. If Bitcoin instead breaks above $78,332 and acceptance is established above that level, the monthly fair value gap becomes the next logical target to the upside.

At the time of writing, Bitcoin is trading at $77,640, just above the rejection zone between $76,800 and $77,400.

BTC trading at $77,371 on the 1D chart | Source: BTCUSDT on Tradingview.com

Trending Cryptos

Related Questions

QWhat is the main technical pattern that analyst Minga identifies on Bitcoin's 4-hour chart, and what does it typically signal?

AMinga identifies a head-and-shoulders pattern forming on Bitcoin 4-hour chart, which is one of the most reliable bearish reversal signals in technical analysis, indicating a potential change from upward momentum into distribution.

QAccording to the analyst, what is the specific price rejection zone where the right shoulder of the pattern is likely to top out?

AThe analyst identified a rejection zone between $76,800 and $77,400 as the area where the right shoulder is most likely to top out.

QWhat is the critical neckline level for the head-and-shoulders pattern, and what other significant level does it coincide with?

AThe neckline of the pattern sits around the mid-$73,000 region, which also coincides with a rising trendline that has supported the price in recent sessions.

QWhat are the two key downside reference points mentioned if the bearish pattern completes, and what is the first one labeled as?

AThe two downside reference points are the equal low level around $70,450, which is labeled as a liquidity target, and the untapped monthly imbalance at $79,388, which represents the opposing bullish scenario.

QWhat price level would need to be broken to invalidate the bearish scenario and lead to another push toward the highs?

AA failure to break below the previous monthly high at $76,053 would invalidate the bearish scenario and lead to another push toward the highs to take out the Monthly FVG (Fair Value Gap) above $79,000.

Related Reads

Will the Fed Definitely Raise Interest Rates in September? How Will Crypto and U.S. Stocks Withstand the Pressure?

The market's expectation for a September Fed rate hike surged dramatically in early August, jumping from under 50% to over 80% within a week. This shift followed a contentious July FOMC meeting, where a 9-3 vote to hold rates revealed growing dissent from hawkish members advocating for an immediate hike to combat persistent inflation. The primary catalyst for this repricing is rising oil prices, driven by renewed geopolitical tensions around the Strait of Hormuz, which threaten global supply. Energy costs directly influence inflation metrics, making the upcoming July CPI report (due August 12th) a critical data point. If it shows inflation reaccelerating, the probability of a September hike will solidify. For Bitcoin and crypto assets, this is typically bearish news. Bitcoin continues to behave as a high-beta, liquidity-sensitive risk asset. A rate hike raises the opportunity cost of holding non-yielding assets and could drive capital toward money markets, pressuring crypto prices in the short term. However, historical patterns suggest that if a hike is perceived as the end of a tightening cycle rather than the start, any negative price impact may be brief. U.S. stocks, particularly crypto-linked equities like Coinbase and growth-oriented tech stocks, are also vulnerable. Higher rates increase discount rates in valuation models, putting pressure on high-multiple companies. This coincides with a pivotal tech earnings season where investor focus has shifted from massive AI capital expenditure to tangible revenue and cash flow generation. Companies with negative cash flow and weak growth narratives could face heightened volatility if borrowing costs rise in September. In summary, a September Fed hike has evolved into a mainstream market scenario. Key factors to watch are oil prices, the July CPI report, and Fed communications, which will determine the final decision and its impact on volatile crypto and equity markets.

marsbit5m ago

Will the Fed Definitely Raise Interest Rates in September? How Will Crypto and U.S. Stocks Withstand the Pressure?

marsbit5m ago

A 'Overlooked' Market Event: Joint US-Japan-South Korea Intervention, Rare US Treasury Involvement, and Bessent's Quiet 'Market Rescue'?

Summary: The United States, Japan, and South Korea executed their largest coordinated foreign exchange intervention in nearly 30 years. The action targeted depreciation pressure on the Japanese yen and South Korean won. This move is seen as a significant effort by the US to stabilize the financial markets of its key allies and prevent the spillover of risks. Key details: * Japan reportedly intervened on July 30 using approximately 8.45 trillion yen (about $52.8 billion). South Korean authorities also intervened that day, selling dollars to support the won. * Notably, the US Treasury Department intervened directly in yen markets for the first time in roughly 30 years. The New York Fed, reportedly acting on behalf of the Treasury, sold euros to buy yen via Goldman Sachs and Morgan Stanley on July 31. Analysts view the use of the euro-yen pair as a way to alleviate yen pressure without adding selling pressure to the US dollar. * Prior to the action, the New York Fed conducted "rate checks" on both USD/JPY and EUR/JPY, a newer signaling tool that falls between verbal and physical intervention. The intervention is interpreted as going beyond traditional currency stabilization. Analysts, such as Michael Hartnett of Bank of America, suggest it resembles a "Price Keeping Operation" for the AI era. The core US objectives are perceived to be: 1. Preventing rapid yen depreciation from triggering a sharp rise in Japanese government bond yields. 2. Containing financial stress from spreading across Asian markets like South Korea and Japan. 3. Reducing the risk of disorderly capital flows impacting the US bond market. This coordinated action underscores the importance of Japan and South Korea as critical partners in the US semiconductor and AI supply chain. Stabilizing their financial markets is seen as vital to mitigating risks to the broader tech industry and the US market itself. The intervention coincides with market pressures, including the KOSDAQ index hitting a low since October 2022. While seen as a move to control volatility, some analysts caution it may not fundamentally reverse existing market trends.

marsbit8m ago

A 'Overlooked' Market Event: Joint US-Japan-South Korea Intervention, Rare US Treasury Involvement, and Bessent's Quiet 'Market Rescue'?

marsbit8m ago

Will the Federal Reserve Definitely Raise Interest Rates in September? How Will Cryptocurrencies and US Stocks Bear the Pressure?

In early August 2024, market expectations for a September Federal Reserve rate hike surged dramatically, from below 50% to over 80%, driven by renewed inflation concerns. This shift followed a contentious July FOMC meeting where a 9-3 vote to hold rates revealed a growing hawkish faction advocating for an immediate hike, citing prolonged above-target inflation. The key catalyst is escalating conflict near the Strait of Hormuz, which has pushed oil prices up approximately 20% in July, threatening to reignite inflation. The next critical data point is the July CPI report on August 12th; a hot reading could solidify hike expectations. For crypto assets, particularly Bitcoin, this represents near-term pressure. Bitcoin continues to exhibit high-beta, risk-on characteristics, making it sensitive to tightening liquidity and higher opportunity costs. However, historical precedent suggests that if a hike is perceived as the cycle's end rather than its start, the negative impact may be brief, with markets quickly pivoting to anticipate future rate cuts. U.S. stocks, especially crypto-linked equities like Coinbase and high-valuation tech stocks, face amplified volatility. Higher rates increase discount rates in valuation models, pressuring growth stocks. This coincides with a pivotal tech earnings season where investor focus has shifted from massive AI capital expenditures to demonstrable revenue and cash flow generation. Companies with negative cash flows and weak growth narratives could see severe pressure if a September hike materializes, as financing costs would rise. Key indicators to watch include oil prices, upcoming inflation data, and Fed commentary at events like the Jackson Hole symposium.

Odaily星球日报8m ago

Will the Federal Reserve Definitely Raise Interest Rates in September? How Will Cryptocurrencies and US Stocks Bear the Pressure?

Odaily星球日报8m ago

Trading

Spot

Hot Articles

What is $BITCOIN

DIGITAL GOLD ($BITCOIN): A Comprehensive Analysis Introduction to DIGITAL GOLD ($BITCOIN) DIGITAL GOLD ($BITCOIN) is a blockchain-based project operating on the Solana network, which aims to combine the characteristics of traditional precious metals with the innovation of decentralized technologies. While it shares a name with Bitcoin, often referred to as “digital gold” due to its perception as a store of value, DIGITAL GOLD is a separate token designed to create a unique ecosystem within the Web3 landscape. Its goal is to position itself as a viable alternative digital asset, although specifics regarding its applications and functionalities are still developing. What is DIGITAL GOLD ($BITCOIN)? DIGITAL GOLD ($BITCOIN) is a cryptocurrency token explicitly designed for use on the Solana blockchain. In contrast to Bitcoin, which provides a widely recognized value storage role, this token appears to focus on broader applications and characteristics. Notable aspects include: Blockchain Infrastructure: The token is built on the Solana blockchain, known for its capacity to handle high-speed and low-cost transactions. Supply Dynamics: DIGITAL GOLD has a maximum supply capped at 100 quadrillion tokens (100P $BITCOIN), although details regarding its circulating supply are currently undisclosed. Utility: While precise functionalities are not explicitly outlined, there are indications that the token could be utilized for various applications, potentially involving decentralized applications (dApps) or asset tokenization strategies. Who is the Creator of DIGITAL GOLD ($BITCOIN)? At present, the identity of the creators and development team behind DIGITAL GOLD ($BITCOIN) remains unknown. This situation is typical among many innovative projects within the blockchain space, particularly those aligning with decentralized finance and meme coin phenomena. While such anonymity may foster a community-driven culture, it intensifies concerns about governance and accountability. Who are the Investors of DIGITAL GOLD ($BITCOIN)? The available information indicates that DIGITAL GOLD ($BITCOIN) does not have any known institutional backers or prominent venture capital investments. The project seems to operate on a peer-to-peer model focused on community support and adoption rather than traditional funding routes. Its activity and liquidity are primarily situated on decentralized exchanges (DEXs), such as PumpSwap, rather than established centralized trading platforms, further highlighting its grassroots approach. How DIGITAL GOLD ($BITCOIN) Works The operational mechanics of DIGITAL GOLD ($BITCOIN) can be elaborated on based on its blockchain design and network attributes: Consensus Mechanism: By leveraging Solana’s unique proof-of-history (PoH) combined with a proof-of-stake (PoS) model, the project ensures efficient transaction validation contributing to the network's high performance. Tokenomics: While specific deflationary mechanisms have not been extensively detailed, the vast maximum token supply implies that it may cater to microtransactions or niche use cases that are still to be defined. Interoperability: There exists the potential for integration with Solana’s broader ecosystem, including various decentralized finance (DeFi) platforms. However, the details regarding specific integrations remain unspecified. Timeline of Key Events Here is a timeline that highlights significant milestones concerning DIGITAL GOLD ($BITCOIN): 2023: The initial deployment of the token occurs on the Solana blockchain, marked by its contract address. 2024: DIGITAL GOLD gains visibility as it becomes available for trading on decentralized exchanges like PumpSwap, allowing users to trade it against SOL. 2025: The project witnesses sporadic trading activity and potential interest in community-led engagements, although no noteworthy partnerships or technical advancements have been documented as of yet. Critical Analysis Strengths Scalability: The underlying Solana infrastructure supports high transaction volumes, which could enhance the utility of $BITCOIN in various transaction scenarios. Accessibility: The potential low trading price per token could attract retail investors, facilitating wider participation due to fractional ownership opportunities. Risks Lack of Transparency: The absence of publicly known backers, developers, or an audit process may yield skepticism regarding the project's sustainability and trustworthiness. Market Volatility: The trading activity is heavily reliant on speculative behavior, which can result in significant price volatility and uncertainty for investors. Conclusion DIGITAL GOLD ($BITCOIN) emerges as an intriguing yet ambiguous project within the rapidly evolving Solana ecosystem. While it attempts to leverage the “digital gold” narrative, its departure from Bitcoin's established role as a store of value underscores the need for a clearer differentiation of its intended utility and governance structure. Future acceptance and adoption will likely depend on addressing the current opacity and defining its operational and economic strategies more explicitly. Note: This report encompasses synthesised information available as of October 2023, and developments may have transpired beyond the research period.

1.4k Total ViewsPublished 2025.05.13Updated 2025.05.13

What is $BITCOIN

Discussions

Welcome to the HTX Community. Here, you can stay informed about the latest platform developments and gain access to professional market insights. Users' opinions on the price of BTC (BTC) are presented below.

活动图片