Bitcoin flashes 3 macro-bottom signals – But can BTC reach $70K?

ambcryptoPublished on 2026-07-22Last updated on 2026-07-22

Abstract

The article discusses Bitcoin's recent price movement above $66,000 and a shift in market analysis from focusing on a local bottom to a potential macro-cycle bottom. It cites a crypto analyst noting that BTC has flashed three historical technical signals that previously coincided with major market bottoms in 2015, 2019, and 2022, suggesting the current zone could be a strong long-term accumulation area. However, the article also highlights a significant challenge: despite the price breakout, on-chain data shows a lack of supporting liquidity. Stablecoin dominance is rising while the total stablecoin market cap is shrinking, with capital continuing to leave exchanges. This divergence indicates that while the technical setup is bullish, the rally may struggle to sustain enough momentum for a decisive move into the $70,000 region without an influx of fresh capital.

The market narrative is finally shifting from a local bottom to a macro bottom.

From a technical standpoint, Bitcoin’s breakout above $66,000 has sparked a wave of bullish sentiment.

Many analysts are arguing that the cycle low may already be in. While BTC was stuck consolidating between $60k- $65k, the discussion largely revolved around whether it was simply a local bottom.

Now, however, the focus is gradually shifting toward a move into the $70,000 region.

Looking at the charts, that shift isn’t entirely without merit.

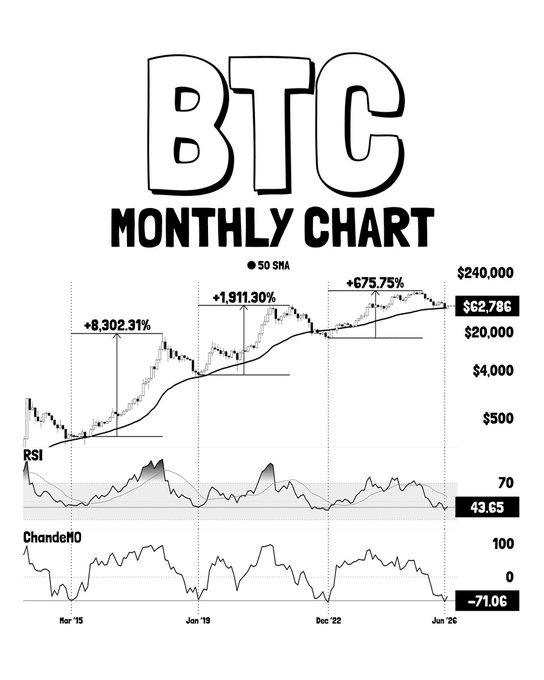
According to crypto analyst Ali Martinez, Bitcoin has once again flashed the same three technical signals that have historically coincided with macro cycle bottoms.

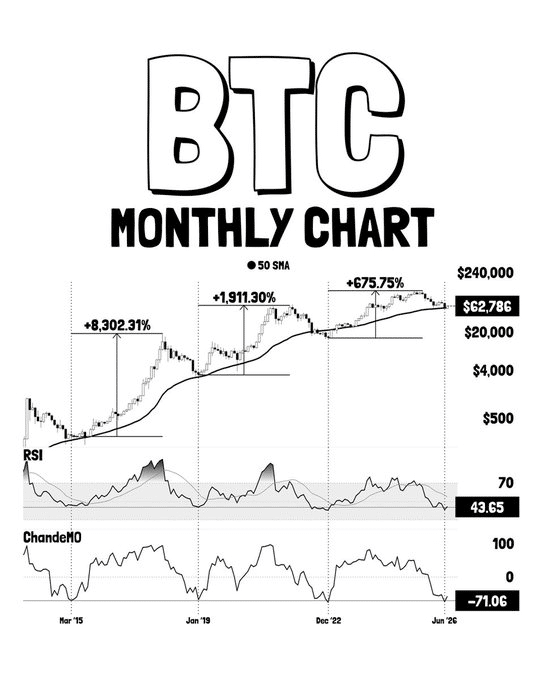
Those signals include the monthly RSI dropping to around 43.65, the Chande Momentum Oscillator (CMO) falling to roughly -71, and Bitcoin trading near its 50-month moving average.
Source: X

Notably, the pattern has repeated across previous cycles.

In 2015, the setup appeared around $235 before Bitcoin [BTC] went on to rally more than 8,300%.

In early 2019, it flashed near $3,333, preceding a gain of 1,900%. The same technical cluster returned in late 2022, around $16k, shortly after Bitcoin bottomed near $15k, before the market rallied 675%.

Interestingly, Bitcoin’s correction to $58k last month triggered this same setup once again.

So, if history is any guide, this alignment has consistently marked one of Bitcoin’s strongest long-term accumulation zones, adding weight to the idea that the market may already be transitioning from a local bottom to a macro one.

Liquidity remains Bitcoin’s biggest test

Bullish continuation ultimately depends on liquidity, and that’s where Bitcoin’s rally could still face a key test.

From a technical standpoint, stablecoin dominance has climbed to around 13%, narrowing the gap with Ethereum’s 10%+ market dominance.

At the same time, the total stablecoin market cap has fallen by more than $10 billion over the past month, suggesting capital is still flowing out rather than back into the crypto.

Notably, on-chain data supports this trend.

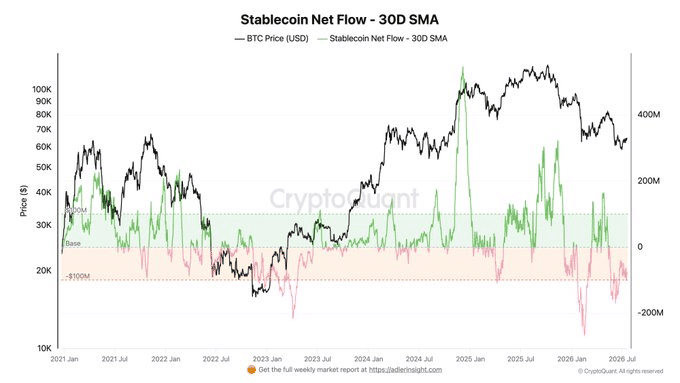
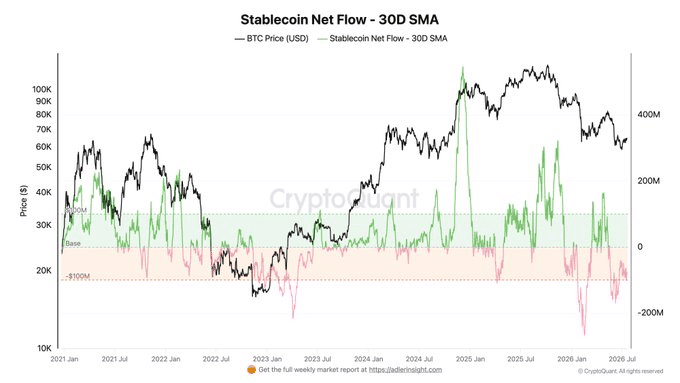
As the chart below shows, Bitcoin is holding above $65,000, but the liquidity needed to sustain the rally appears to be fading. Stablecoins have been leaving exchanges for 35 consecutive days, while Bitcoin has yet to see a meaningful pickup in spot accumulation.
Source: CryptoQuant

In other words, price is breaking out, but liquidity isn’t following.

Against this backdrop, the shift from a local bottom to a macro bottom may still need stronger confirmation.

While Bitcoin’s breakout above $66,000 is technically bullish. However, the lack of fresh liquidity suggests the move could struggle to sustain enough momentum for a decisive breakout into the $70k zone.


Final Summary


Trending Cryptos

Related Questions

QWhat are the three technical signals that, according to analyst Ali Martinez, have historically coincided with Bitcoin's macro cycle bottoms?

AThe three signals are: the monthly RSI dropping to around 43.65, the Chande Momentum Oscillator (CMO) falling to roughly -71, and Bitcoin trading near its 50-month moving average.

QWhat does the current trend in stablecoin data suggest about liquidity for a potential Bitcoin rally?

AThe stablecoin market cap has fallen by over $10 billion, and stablecoins have been leaving exchanges for 35 consecutive days. This suggests capital is flowing out of crypto, and the liquidity needed to sustain a rally may be fading.

QBased on the article, what is the main challenge Bitcoin faces in reaching the $70,000 zone despite its technical breakout?

AThe main challenge is a lack of fresh liquidity. While the price is breaking out, on-chain data shows liquidity isn't following, which could prevent the rally from sustaining enough momentum for a decisive breakout above $70,000.

QAccording to historical patterns mentioned, what typically followed the appearance of the three technical signals in previous Bitcoin cycles?

AHistorically, the appearance of these signals marked strong long-term accumulation zones and preceded major rallies. For example, after the signals appeared in 2015, Bitcoin rallied over 8,300%; in 2019, it gained 1,900%; and in late 2022, the market rallied 675%.

QWhat shift in market narrative is discussed in the beginning of the article?

AThe market narrative is shifting from debating whether a recent low was just a local bottom to considering that Bitcoin may be forming a macro cycle bottom, with focus moving toward a potential push into the $70,000 region.

Related Reads

Can Japan Buy Growth with AI? Will the Bond Market Believe It?

Japan's cabinet has introduced the 2026 Basic Policy on Economic and Fiscal Management and Reform, shifting its primary fiscal target. The new framework moves away from the traditional annual primary balance goal and instead prioritizes a stable reduction of the debt-to-GDP ratio. This change is tied to a strategy of increased "responsible proactive fiscal" spending, aiming to boost long-term growth through investments in strategic sectors like AI, semiconductors, energy, and robotics. The government estimates total public and private investment in 62 key technologies could exceed 370 trillion yen by 2040. The market reaction has been mixed and cautious. While equity markets may respond to policy signals, bond markets are focused on fiscal credibility. Concerns center on whether the weakening of the clear primary balance anchor could lead to looser fiscal discipline. If investors doubt that these strategic investments will generate sufficient productivity gains, tax revenue, and nominal growth to outpace rising interest costs, they may demand higher yields on Japanese Government Bonds (JGBs). Recent volatility in the yen and JGB yields, with the 10-year yield briefly reaching 2.9%, reflects this skepticism. The success of this new framework hinges on two factors: whether Japan can achieve a nominal growth rate consistently higher than its long-term interest rates, and whether future budgets demonstrate disciplined control over bond issuance. The government's narrative is that strategic investment is essential to break Japan's cycle of low growth, aging, and labor shortages. However, the bond market will continuously assess the credibility of this plan, pricing the risk that it may represent fiscal expansion rather than a viable growth strategy.

marsbit20m ago

Can Japan Buy Growth with AI? Will the Bond Market Believe It?

marsbit20m ago

Misjudged A-Shares: Resilience, Expectations, and Confidence

China's A-share market recently faced selling pressure, especially in tech sectors, initially triggered by a global tech sell-off that began in South Korea. However, the article argues this is a case of "mistaken injury" and highlights the market's underlying resilience. This resilience stems from three main pillars: **1) Tech Sector Fundamentals:** Unlike Korea's market dominated by a few memory chip stocks, China's tech sector is diversified across computing, communications, electronics, and semiconductors, supported by dual narratives of global AI supply chains and domestic substitution. Core areas like optical modules and fiber optics continue to show strong earnings growth. **2) "National Team" Support:** State-backed institutions and large corporations have made significant market purchases and announced buybacks, providing liquidity and signaling confidence. This is seen as a stabilizing policy signal, often associated with market bottoms. **3) Broader Market Pillars:** Other major sectors are showing endogenous recovery momentum. Consumer stocks benefit from stabilizing CPI and signs of sector recovery (e.g., liquor price hikes). Cyclical sectors like aluminum have high earnings, potential price increases due to tight supply, and low valuations. The financial sector offers stable dividends and low valuations. The conclusion is that the sell-off was driven by external contagion, not a collapse in fundamentals. With strong policy support and recovering momentum across key sectors, the A-share market possesses the toughness to regain stability.

marsbit51m ago

Misjudged A-Shares: Resilience, Expectations, and Confidence

marsbit51m ago

Trading

Spot

Hot Articles

What is $BITCOIN

DIGITAL GOLD ($BITCOIN): A Comprehensive Analysis Introduction to DIGITAL GOLD ($BITCOIN) DIGITAL GOLD ($BITCOIN) is a blockchain-based project operating on the Solana network, which aims to combine the characteristics of traditional precious metals with the innovation of decentralized technologies. While it shares a name with Bitcoin, often referred to as “digital gold” due to its perception as a store of value, DIGITAL GOLD is a separate token designed to create a unique ecosystem within the Web3 landscape. Its goal is to position itself as a viable alternative digital asset, although specifics regarding its applications and functionalities are still developing. What is DIGITAL GOLD ($BITCOIN)? DIGITAL GOLD ($BITCOIN) is a cryptocurrency token explicitly designed for use on the Solana blockchain. In contrast to Bitcoin, which provides a widely recognized value storage role, this token appears to focus on broader applications and characteristics. Notable aspects include: Blockchain Infrastructure: The token is built on the Solana blockchain, known for its capacity to handle high-speed and low-cost transactions. Supply Dynamics: DIGITAL GOLD has a maximum supply capped at 100 quadrillion tokens (100P $BITCOIN), although details regarding its circulating supply are currently undisclosed. Utility: While precise functionalities are not explicitly outlined, there are indications that the token could be utilized for various applications, potentially involving decentralized applications (dApps) or asset tokenization strategies. Who is the Creator of DIGITAL GOLD ($BITCOIN)? At present, the identity of the creators and development team behind DIGITAL GOLD ($BITCOIN) remains unknown. This situation is typical among many innovative projects within the blockchain space, particularly those aligning with decentralized finance and meme coin phenomena. While such anonymity may foster a community-driven culture, it intensifies concerns about governance and accountability. Who are the Investors of DIGITAL GOLD ($BITCOIN)? The available information indicates that DIGITAL GOLD ($BITCOIN) does not have any known institutional backers or prominent venture capital investments. The project seems to operate on a peer-to-peer model focused on community support and adoption rather than traditional funding routes. Its activity and liquidity are primarily situated on decentralized exchanges (DEXs), such as PumpSwap, rather than established centralized trading platforms, further highlighting its grassroots approach. How DIGITAL GOLD ($BITCOIN) Works The operational mechanics of DIGITAL GOLD ($BITCOIN) can be elaborated on based on its blockchain design and network attributes: Consensus Mechanism: By leveraging Solana’s unique proof-of-history (PoH) combined with a proof-of-stake (PoS) model, the project ensures efficient transaction validation contributing to the network's high performance. Tokenomics: While specific deflationary mechanisms have not been extensively detailed, the vast maximum token supply implies that it may cater to microtransactions or niche use cases that are still to be defined. Interoperability: There exists the potential for integration with Solana’s broader ecosystem, including various decentralized finance (DeFi) platforms. However, the details regarding specific integrations remain unspecified. Timeline of Key Events Here is a timeline that highlights significant milestones concerning DIGITAL GOLD ($BITCOIN): 2023: The initial deployment of the token occurs on the Solana blockchain, marked by its contract address. 2024: DIGITAL GOLD gains visibility as it becomes available for trading on decentralized exchanges like PumpSwap, allowing users to trade it against SOL. 2025: The project witnesses sporadic trading activity and potential interest in community-led engagements, although no noteworthy partnerships or technical advancements have been documented as of yet. Critical Analysis Strengths Scalability: The underlying Solana infrastructure supports high transaction volumes, which could enhance the utility of $BITCOIN in various transaction scenarios. Accessibility: The potential low trading price per token could attract retail investors, facilitating wider participation due to fractional ownership opportunities. Risks Lack of Transparency: The absence of publicly known backers, developers, or an audit process may yield skepticism regarding the project's sustainability and trustworthiness. Market Volatility: The trading activity is heavily reliant on speculative behavior, which can result in significant price volatility and uncertainty for investors. Conclusion DIGITAL GOLD ($BITCOIN) emerges as an intriguing yet ambiguous project within the rapidly evolving Solana ecosystem. While it attempts to leverage the “digital gold” narrative, its departure from Bitcoin's established role as a store of value underscores the need for a clearer differentiation of its intended utility and governance structure. Future acceptance and adoption will likely depend on addressing the current opacity and defining its operational and economic strategies more explicitly. Note: This report encompasses synthesised information available as of October 2023, and developments may have transpired beyond the research period.

972 Total ViewsPublished 2025.05.13Updated 2025.05.13

What is $BITCOIN

Discussions

Welcome to the HTX Community. Here, you can stay informed about the latest platform developments and gain access to professional market insights. Users' opinions on the price of BTC (BTC) are presented below.

活动图片