This week, the daily-level wave B adjustment of Bitcoin continues, with the price having dipped to the level of $62,268. Whether it can find support in the key zone of $60,900~$61,500 is the core of this week's structural validation. HYPE, on the other hand, has moved to the key support zone of $50~$52 at the end of the daily wave C. Oversold signals have been triggered consecutively, and a short-term repair window is approaching, but the direction has not yet been confirmed. Below is a multi-cycle structural review of BTC and HYPE for this week, operational strategies, and market verification of last week's short-term trades, for reference.
Summary of Core Trading Views for This Week:
• BTC Multi-cycle Trend Structure Analysis (Detailed in Part 1)
• BTC Market Forecast and Mid/Short-term Operational Strategies for This Week (Detailed in Part 2)
• HYPE Daily-level Trend Structure Analysis (Detailed in Part 3)
• HYPE Market Forecast and Short-term Operational Strategy for This Week (Detailed in Part 4)
Market Verification of Last Week's Trading Strategy and Core Views:
• Market Verification of BTC Trend Forecast: Last week's article clearly stated: pay attention to the support strength when the price probes the $60,950~$61,500 zone. From the actual market movement, the price showed signs of halting decline and rebounding near the low of $62,268, validating our forecast.
• BTC Short-term Trading Performance: Bitcoin completed one short-term short position operation (1x leverage) last week, successfully achieving a profit of approximately 2.58%. (Detailed in Part 5)
• Market Verification of HYPE Trend Forecast: Reviewing last week's analysis, we proposed two potential technical paths for HYPE's subsequent evolution. The current actual market movement aligns highly with the second path, namely the scenario where "the price failed to end the adjustment at $56.47, instead constructing a declining pivot before continuing to probe lows."
1. Bitcoin Multi-cycle Trend Structure Analysis
1.1 Bitcoin Daily-level Trend Structure Analysis: (Based on post-May 6th price action)
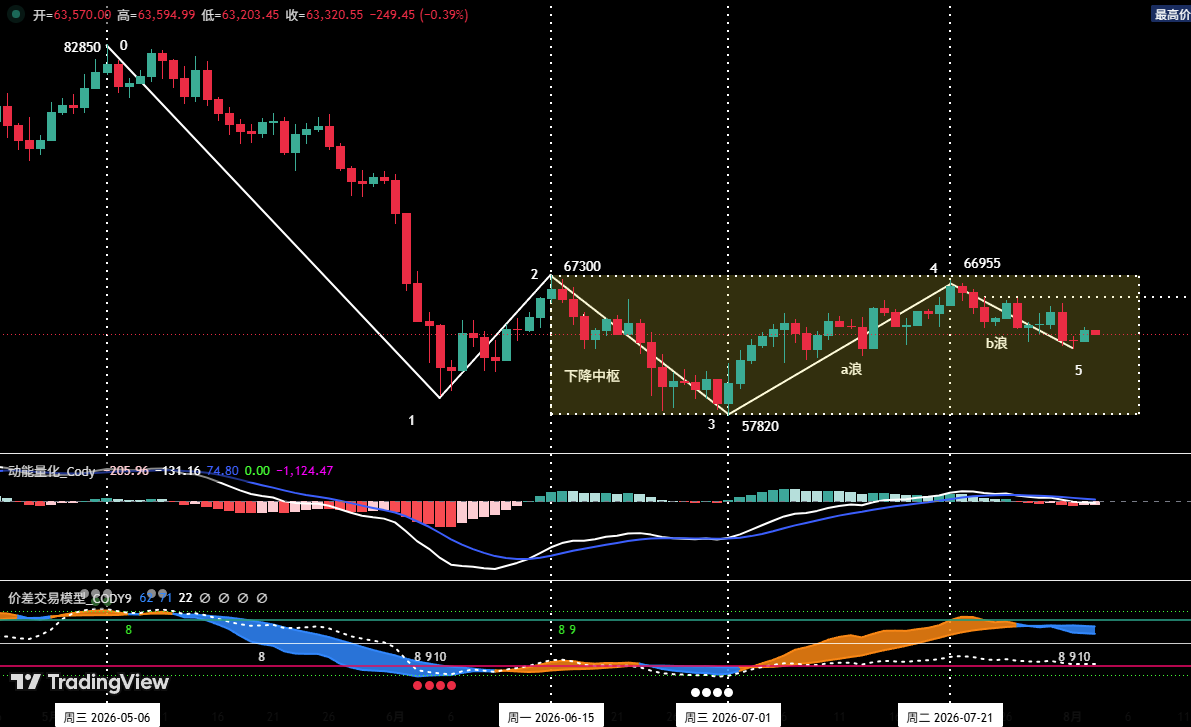
Figure 1 Bitcoin Daily K-line Chart
1. As shown in (Figure 1): The corrective move initiated from the May 6th high of $82,850 has clearly presented a five-wave corrective structure comprising (0-1), (1-2), (2-3), (3-4), (4-5) on the daily chart.
2. Daily Structure Analysis: (From the July 1st low rebound to present)
• Wave a (Rebound Segment): From July 1st (~$57,820) to July 21st (~$66,955), lasting 21 days, with a maximum gain of ~15.8%.
• Wave b (Corrective Segment): From July 21st (~$66,955) to present. It has now run for 12 days, with the lowest probe at $62,268. This retracement has approached approximately 61.8% of the wave a rebound, (Fibonacci level around $61,310). Therefore, from an amplitude perspective, the wave b correction is largely meeting technical requirements.
• Potential Wave c (Rebound Segment): Once the wave b correction concludes (prerequisite being the low does not break below the wave a low of $57,820), the market有望 to initiate a potential wave c rebound. This segment有望 to challenge the resistance zone around $67,300 again.
1.2 Deep Dive into Bitcoin Hourly-level Trend Structure: (Using 4-hour as analysis cycle)
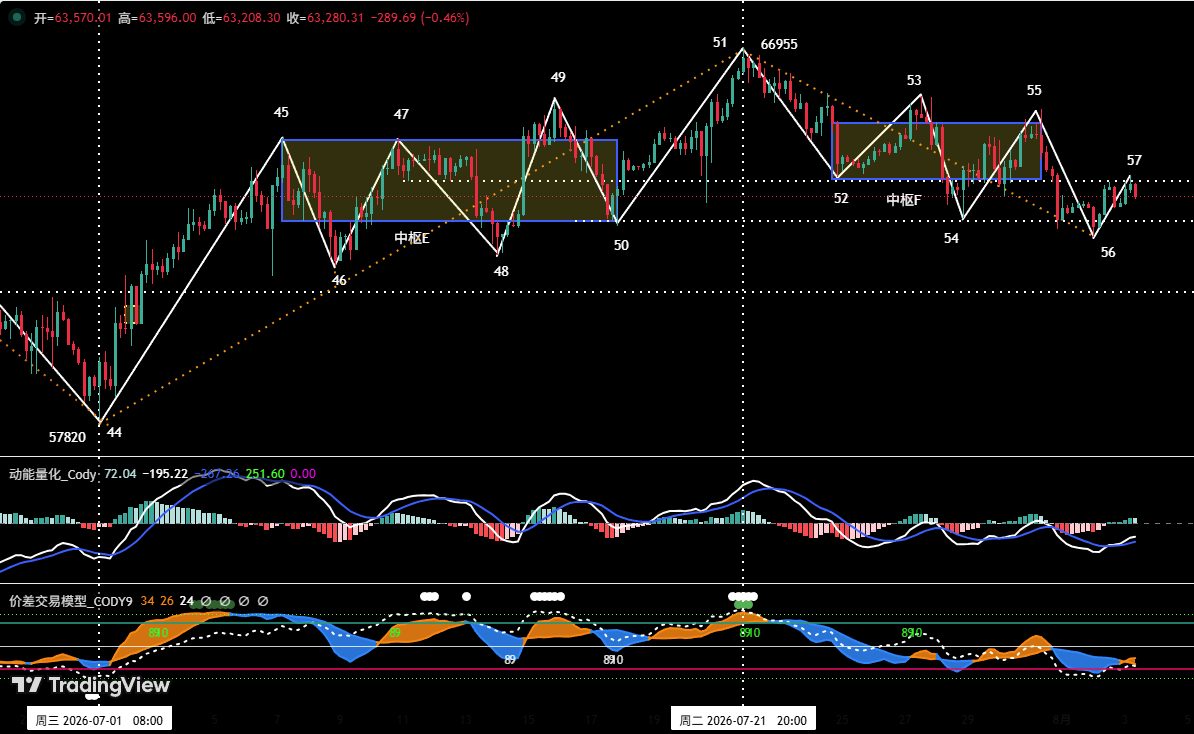
Figure 2 Bitcoin 4-hour K-line Chart
1. In the 4-hour chart, the daily wave b correction initiated from the July 21st high (Endpoint 51, ~$66,955) can be clearly divided into six segments from (51-52) to (56-57). Among them, segments (52-53), (53-54), (54-55) overlap, constituting Pivot F.
2. The market is currently running the (56-57) rebound segment. If subsequent price does not fall below "Endpoint 56" again and initiates sustained反弹 after effectively stabilizing above $63,600, the probability of the daily wave b correction ending at "Endpoint 56" (~$62,268) increases significantly. Otherwise, the market may continue probing lows, with a key focus on the $60,900-$61,500 support zone.
2. Bitcoin Market Forecast and Operational Strategy for This Week
2.1 BTC Market Trend Forecast for This Week:
Core View This Week: Closely monitor whether the daily wave b correction concludes above the key $60,900-$61,500 zone, with the prerequisite that the low does not break $57,820.
2.2 Core Resistance Levels:
• First Resistance Zone: Around $63,600 (previous important resistance)
• Second Resistance Zone: $65,700~$67,300 zone (previous important resistance)
• Third Resistance Zone: $69,500~$71,000 zone (previous important resistance)
2.3 Core Support Levels:
• First Support Zone: $60,950~$61,500 zone (previous important support)
• Second Support Level: Around $57,820 (previous important support)
2.4 This Week's Operational Strategy (Excluding Sudden News Impact)
1. Mid-term Strategy:
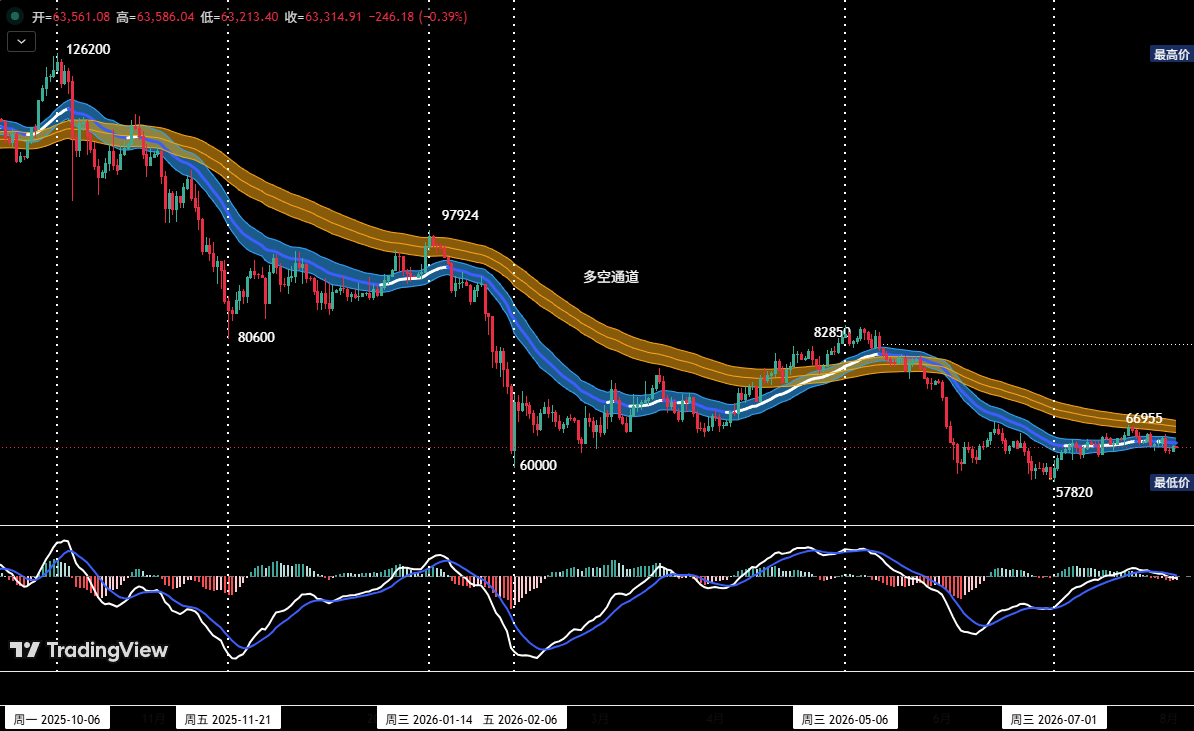
Position Monitoring Model: As shown in (Figure 3), the current price has effectively broken below the "Bull-Bear Channel," confirming a shift to a bear-dominated market structure. The current mid-term short position is approximately 40%.
If the price effectively stabilizes above $63,600 and initiates sustained反弹, it is suggested to reduce the mid-term short position to below 20%.
2. Short-term Strategy: Utilize 30% of capital, set stop-loss points, and look for "spread" opportunities based on support and resistance levels. (Use 30-minute/60-minute as operation cycle).
3. To dynamically应对 the complex market evolution in short-term operations, we have pre-formulated two specific operational plans: Plan A/B.
• Plan A: Tentative Longs Above Effective Support.
• Entry: If the price continues反弹 early in the week and effectively stabilizes above $63,600, combined with quantitative model signals, a long position of around 30% can be established.
• Risk Control: Set initial stop-loss.
• Exit: When approaching major resistance levels combined with quantitative model signals, gradually close positions to take profits.
• Plan B: Light Longs in Strong Support Zone.
• Entry: If the price continues to adjust and shows signs of halting decline and stabilizing above the previous low of $57,820, combined with quantitative model bottom signals, a long position of around 30% can be established.
• Risk Control: Set initial stop-loss.
• Exit: When反弹至 important resistance levels combined with model signals, gradually close positions to take profits.
3. HYPE Daily-level Trend Structure Analysis
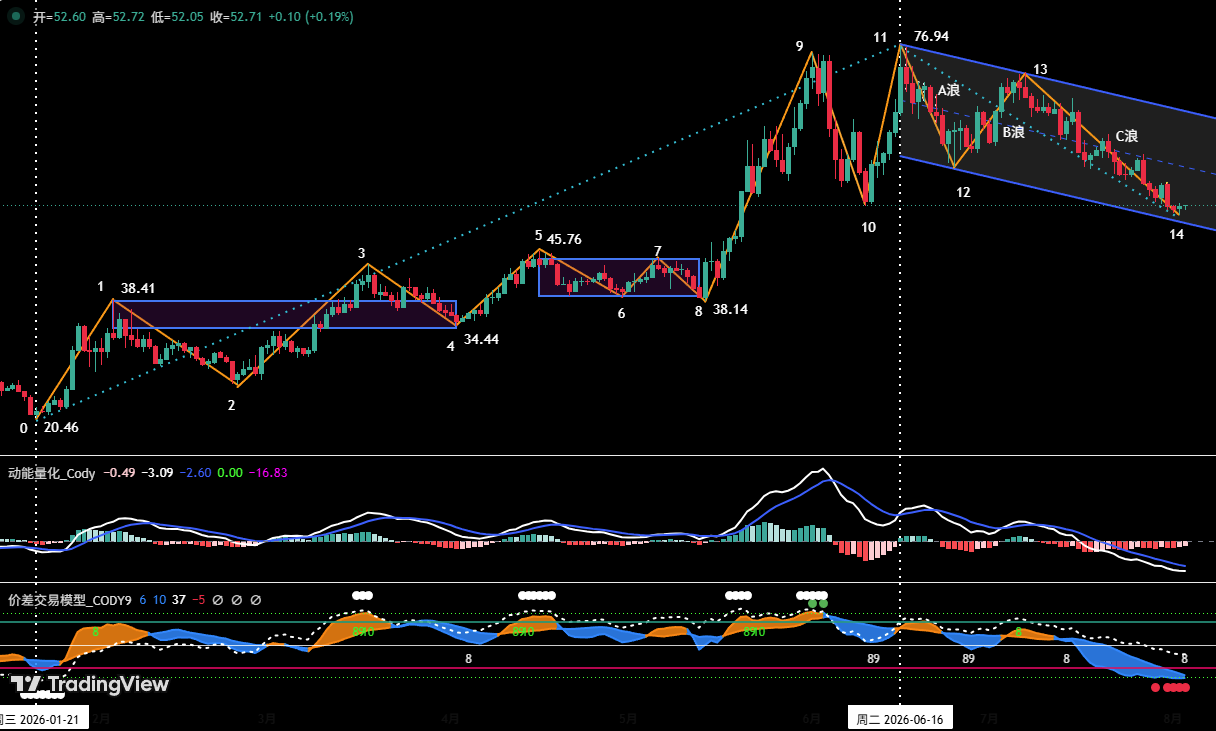
Figure 4 HYPE Daily K-line Chart
1. As shown in (Figure 4), the corrective行情 initiated from the June 16th high of $76.94 for HYPE has clearly presented an A-B-C three-wave corrective structure on the daily chart. Specifically:
1. Wave A (Decline Segment): From the June 16th high (~$76.94) to the June 25th low (~$58.50), lasting 9 days, with a cumulative decline of 23.97%.
2. Wave B (Rebound/Repair Segment): From the June 25th low (~$58.50) to the July 7th high (~$72.97), lasting 12 days, with a反弹幅度 of 24.74%.
3. Wave C (Decline Segment): Initiated from the July 7th high (~$72.97), it has now run for 27 days, with the price having probed as low as $51.11.
2. Currently, the daily wave C has descended to the key support zone of $50~$52. As the market has undergone consecutive adjustments, multiple technical indicators have entered oversold territory, and our proprietary "Spread Trading Model" has consecutively triggered bottom warning signals (red dots), indicating short-term technical repair需求. Therefore, blindly chasing shorts at the current price is not advisable. It is suggested to patiently wait for confirmation signals of a daily-level wave D修复性反弹行情.
4. HYPE Market Forecast and Short-term Operational Strategy for This Week
4.1 HYPE Market Trend Forecast for This Week:
1. Core Resistance Levels:
• First Resistance Level: $58.5~$60 zone
• Second Resistance Level: $63.5~$66 zone
• Third Resistance Level: Around $72.97
2. Core Support Levels:
• First Support Zone: $50~$52 zone;
• Second Support Level: Around $45;
Core View This Week:
Closely monitor the testing results of price support strength in the $50~$52 zone.
4.2 HYPE Short-term Operational Strategy for This Week:
This Week's Short-term Operation:
If the price发出止跌企稳 signals in the $50~$52 zone, it is suggested that investors may consider entering light long positions for testing, strictly adhering to stop-loss discipline, with仓位控制在 within 20%.
5. Bitcoin Short-term Operation Review
We strictly followed the operational plan and executed one short-term (short) trade last week based on signals from our self-constructed "Spread Trading Model" and "Momentum Quantitative Model," achieving a total trading profit of approximately 2.58%.
5.1 Short-term Trading Record: (See Table 1)
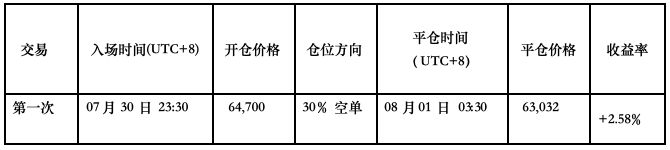
Table 1 Bitcoin Short-term Trading Details Summary: (Leverage*1x)
5.2 Short-term Trade Review: (See Figure 5)
• Entry Strategy:
a、 When the price反弹至 around $65,700, signs of stalling appeared, with K-line forming a "Top Pivot" pattern;
b、 The "Spread Trading Model" triggered a strong top warning signal (white dot + green dot), followed by the signal band (blue) in the chart breaking below the skyline (green),发出下跌信号; concurrently overlapping with the "Momentum Quantitative Model" adjustment signal resonance.
Therefore, we established a 30% short position at $64,700.
• Exit Strategy:
a、 When the price fell to above $62,000 and showed signs of halting decline, with K-line forming a "Bottom Pivot" pattern;
b、 The "Spread Trading Model" consecutively triggered bottom warning signals (white dot + red dot), followed by the signal band (orange-yellow) in the chart breaking above the horizon (purple-red), forming a bottom resonance signal with the "Momentum Quantitative Model."
Therefore, we closed all positions around $63,032.
• Summary: This trade successfully盈利约 2.58%.
5.3 Short-term Trade Illustration
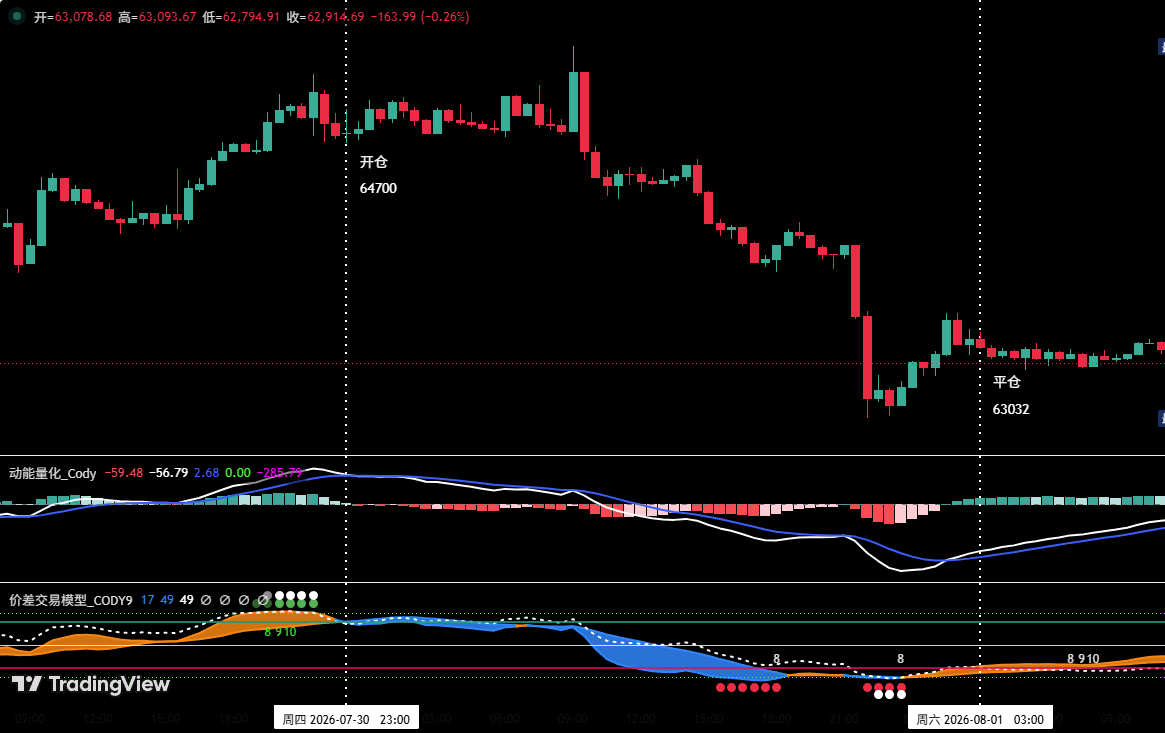
Figure 5 BTC_30-minute K-line Chart: (Momentum Quantitative Model + Spread Trading Model)
6. Special Notes:
1. Upon Entry: Immediately set the initial stop-loss.
2. When Profit Reaches 1%: Move the stop-loss to the entry cost price (breakeven point) to ensure capital safety.
3. When Profit Reaches 2%: Move the stop-loss to the 1% profit position.
4. Continuous Tracking: Thereafter, for every additional 1% profit, move the stop-loss同步移动 1%, dynamically protecting and locking in profits.
Financial markets are ever-changing. All market analysis and trading strategies require dynamic adjustment. All views, analytical models, and operational strategies mentioned in this article originate from personal technical analysis and are solely for personal trading log purposes. They do not constitute any investment advice or operational basis. The market carries risks, investment requires caution. Please do not make decisions based on this.