Original Author: Darko, IOSG
ETF inflows are often seen as a thermometer of institutional money's confidence in Bitcoin. But week after week, it measures something else more: a hidden interest rate trade that's repeatedly switched on and off. This article explains how to identify it, how big this trade actually is, and why it's quietly winding down.
TL;DR
- Week to week, ETF flows are primarily driven by a hidden arbitrage trade, not faith. Cash-and-carry traders buy the ETF while shorting futures on the CME, hedging out price risk, but are indistinguishable from genuine bulls in the data. About half of the weekly flow volatility can be explained by hedge funds' new short futures positions alone, with a correlation as high as 0.70.
- Bitcoin's weekly price change explains almost none of the flows. Using price returns to predict ETF flows yields a result statistically indistinguishable from zero. Weekly flows are not chasing price performance; they move in lockstep with a hedged interest rate trade.
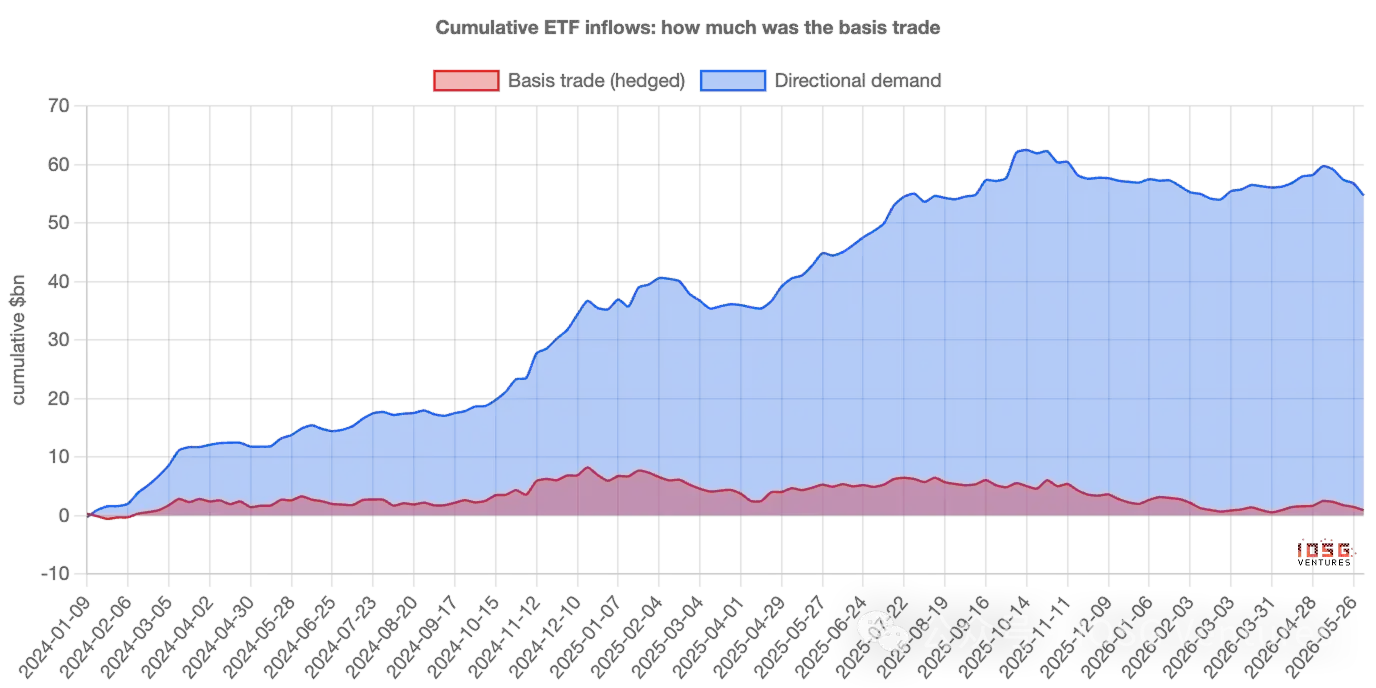
- Arbitrage dominates weekly "volatility," but has never been the main component of the "stock." Of the approximately $55 billion in cumulative ETF inflows, the arbitrage trade's net position currently accounts for only about $1 billion. The rest is stable, directional buying—around $400 million per week—compounded over two years to form nearly the entire "mountain."
- The accurate statement is: ETF flows overestimate the "volatility" of faith, not its "level." The weekly ebbs and flows are largely "rented"—arbitrage capital comes and goes; the assets that truly settle are mostly "owned."
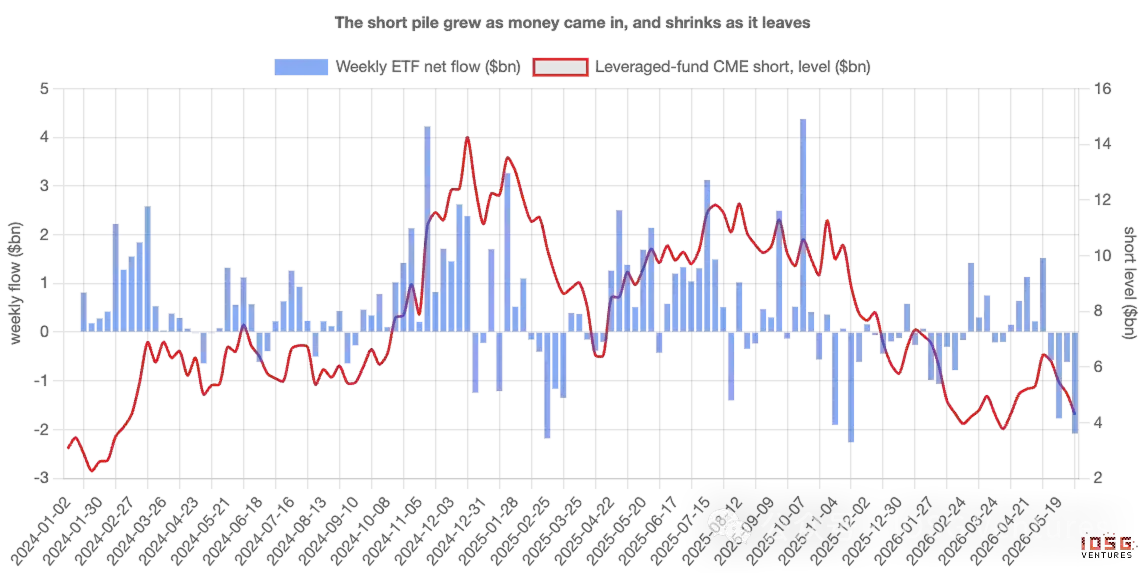
- This trade is winding down, and has been for two years. Leveraged funds' short positions grew from around $3 billion at launch to about $14 billion by late 2024, before steadily declining to roughly $4.5 billion. Once the basis compresses to unprofitability, inflows and shorts retreat in sync—don't misinterpret the resulting outflows as the market passing judgment on Bitcoin.
I. The Number Everyone Watches
Every week, Bitcoin ETFs announce how much money flowed in or out, and this number is often taken as a verdict. Large inflows mean institutions are piling in; outflows signal shaken confidence. Flow data has quietly become the headline metric for measuring market faith.
The problem is that not everyone buying an ETF is betting on Bitcoin. Some of the biggest buyers don't care which way the price goes—and once you account for them, the weekly flow number measures their activity more than anyone's belief. To understand why, you first need to meet a different kind of buyer.
A Buyer Who Doesn't Care About Price
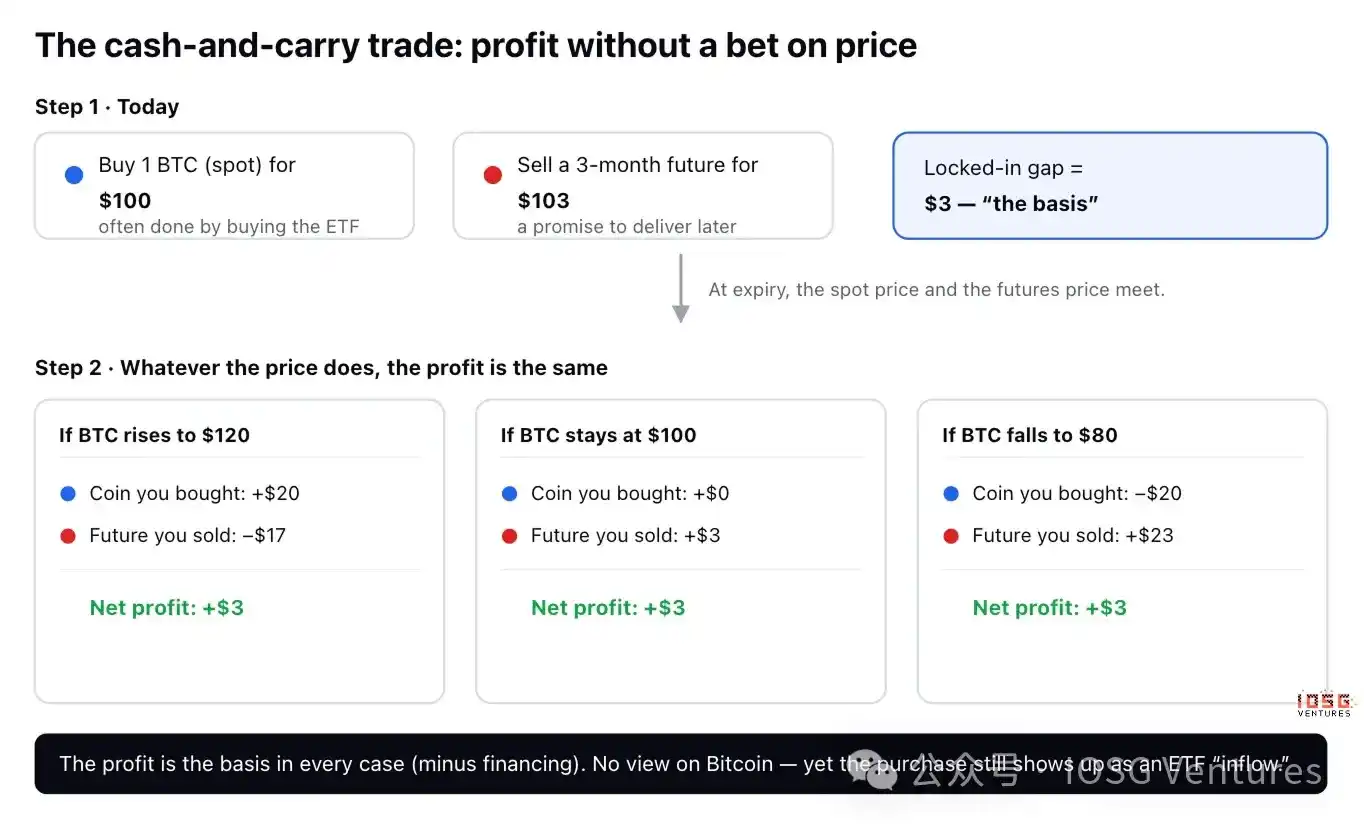
There is a classic, boring trade called cash-and-carry arbitrage. A Bitcoin "future" is simply a contract to buy or sell Bitcoin at a set price on a future date, and most of the time, the futures price is slightly higher than the current spot price—say Bitcoin is $100 now, but a contract expiring in three months sells for $103.
A trader can pocket that $3 difference without having any view on price:
- Buy 1 Bitcoin today for $100 (often achieved by buying the ETF).
- Sell a future for $103, promising delivery in three months.
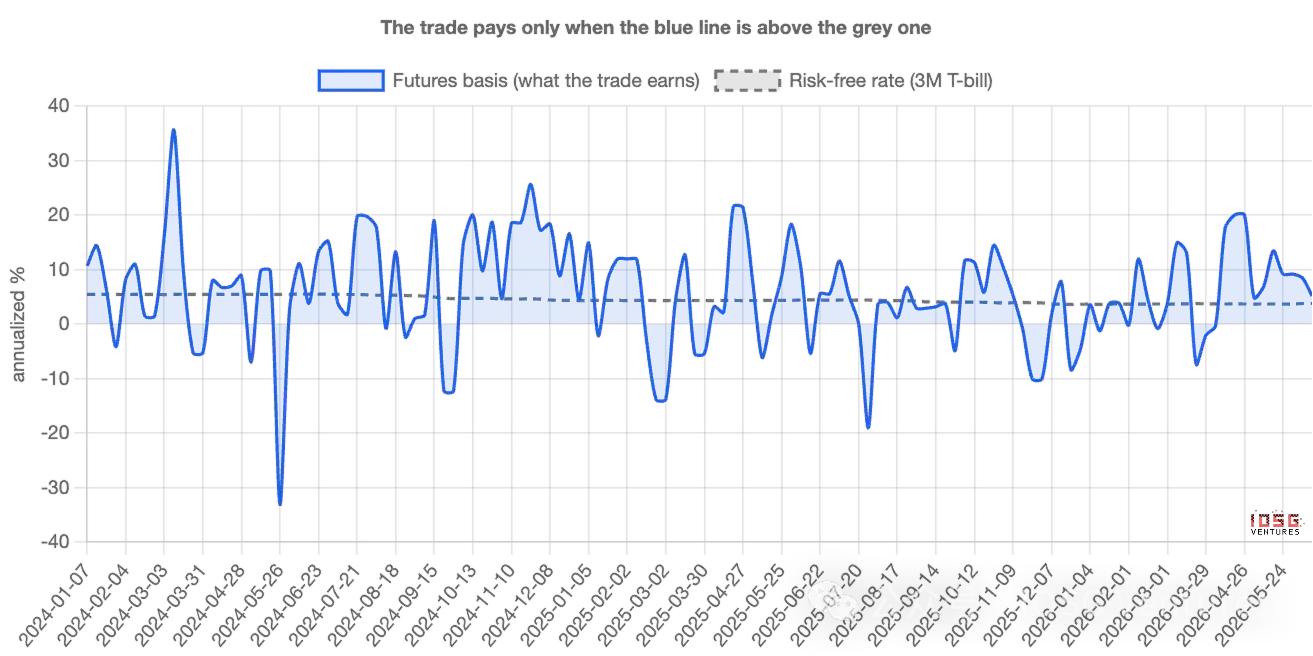
Look at what happens at expiration. If Bitcoin surges to $120, the trader makes $20 on the coin but loses $17 on the contract—net $3. If it crashes to $80, the trader loses $20 on the coin but gains $23 on the contract—still net $3. If it stays flat, still $3. The profit is the same in every scenario. The direction is hedged out; traders call this "delta neutral." This $3 spread, expressed as an annualized rate, is the basis—essentially, it's the interest a trader earns for parking capital in this trade; as long as it's higher than the risk-free yield available from US Treasuries (T-bills), the trade is worth doing.
Why This Pollutes the Headline Number
Here's the key. The first leg—buy 1 Bitcoin—is very commonly done by buying the ETF. Thus, a delta-neutral trader with no view on Bitcoin appears in the data as an ETF inflow, indistinguishable on the surface from a true believer.
When a lot of cash-and-carry arbitrage is set up, inflows look strong, and the narrative that "institutions are adding" naturally follows—even though these funds are hedged and will reverse the moment the trade is no longer profitable. In other words, the flow number measures not just faith, it measures the activity of arbitrage desks. The challenge is separating the two—and how big each one really is.
How to Tell Them Apart
Cash-and-carry arbitrageurs leave a second footprint. For every $1 of Bitcoin they buy, they go short $1 of futures on the CME (the regulated US exchange where institutions trade Bitcoin futures). The true believer leaves only the first footprint; the arbitrageur leaves both.
And the second footprint is public. US derivatives regulators publish a weekly report detailing the size of long and short positions held by different trader types on the CME. One category—leveraged funds, essentially hedge funds—is where these arbitrageurs congregate. So you can line up, week by week, the money flowing into ETFs and the new short positions these funds establish. If the "demand" were truly faith, the two shouldn't correlate much; if a large portion of it is that hidden trade, they should move together.
II. What the Data Says: Week-to-Week, Flows Follow Futures, Not Price
They move tightly together. In every week since the ETF launch, the more new futures shorts were added that week, the more ETF money flowed in—almost one-for-one. About half of all weekly flow volatility can be explained by just this one thing: how much shorting the funds did. The correlation is 0.70, the kind of strength you'd see between two things clearly related, not coincidental.
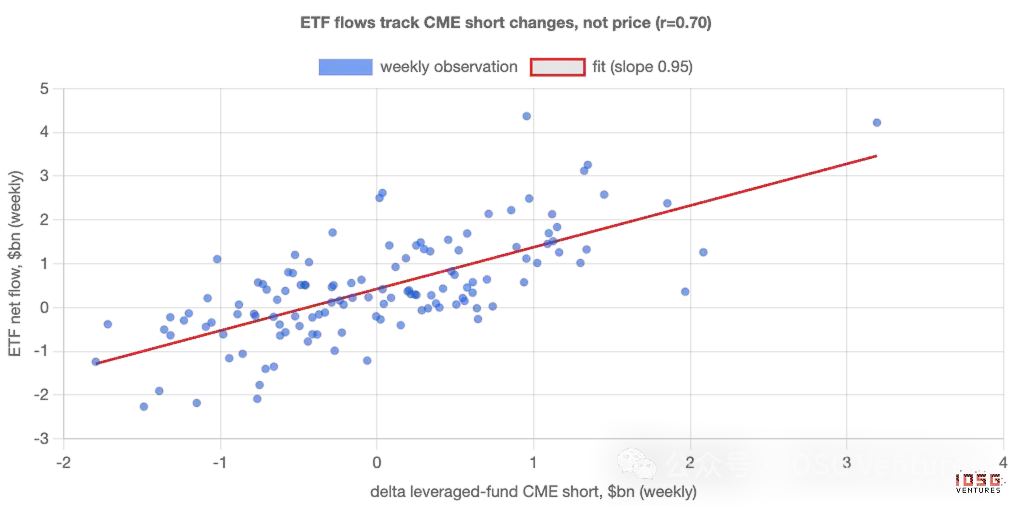
The most sobering point for believers: price itself explains almost nothing. Testing whether Bitcoin's weekly return can predict ETF flows yields an answer statistically indistinguishable from zero. Weekly money isn't chasing performance; it's moving in lockstep with a hedged interest rate trade.
So, as a week-to-week signal, ETF "demand" is mostly arbitrage. The flow number is a poor thermometer for faith because its ups and downs are the result of a basis trade being switched on and off, not anyone changing their mind about Bitcoin.
But How Much of the Money Is Actually This Trade?
This is where the simplistic claim—"it's all fake"—falls apart, and the real story is more interesting. The basis trade dominates weekly volatility, but was never the main component of the stock of money.
Break weekly inflows into the part explained by futures shorts (hedged) and the remainder (directional), then accumulate from launch. Of the roughly $55 billion in cumulative ETF inflows, the basis trade's current net position is only about $1 billion—the rest is stable, directional buying. That buying is about $400 million per week, week after week, regardless of basis or price, compounding over two years to form almost the entire mountain.
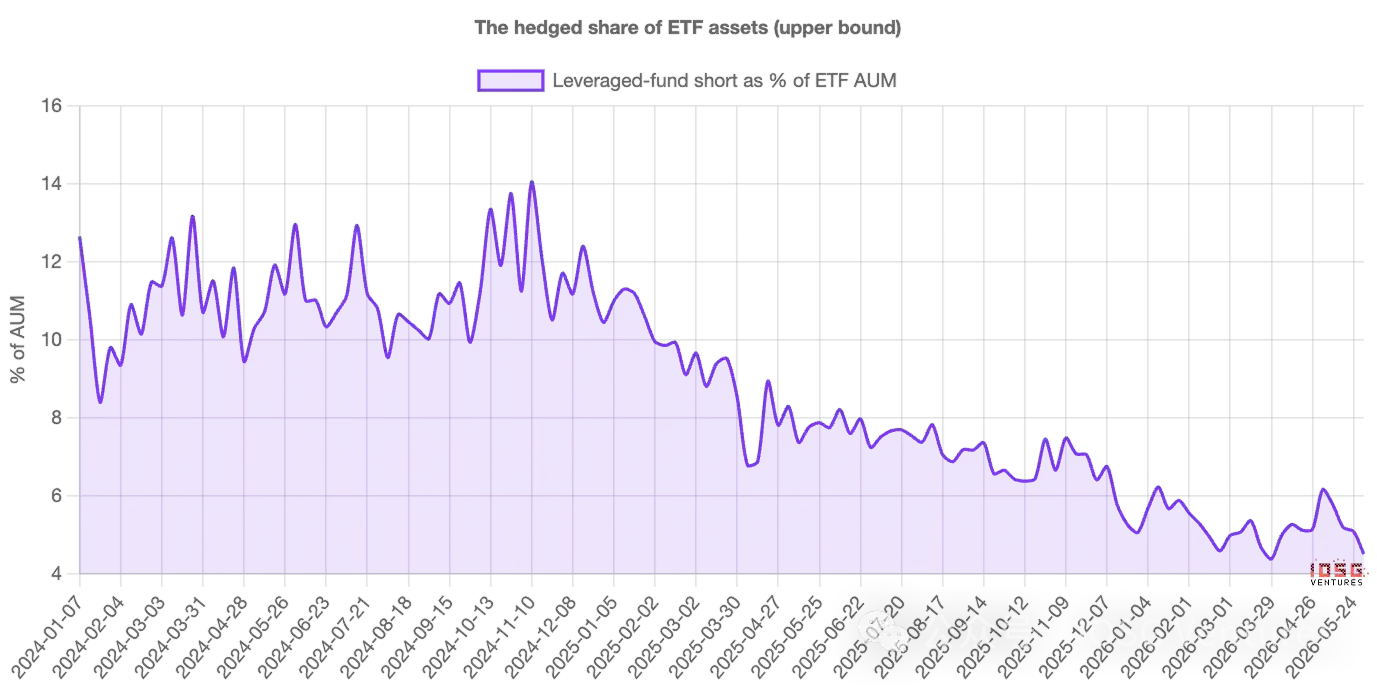
Looking at asset share rather than flows paints the same picture: the hedged portion approached 14% of ETF assets at its peak in 2024, and is now about 4%–5%. It was a non-negligible minority at its peak; now it's a small slice.
So, a more precise statement is: ETF flows overestimate the volatility of faith, not its level. The weekly ebbs and flows are largely "rented"—arbitrage capital comes and goes; but the assets that truly settle are mostly "owned." This trade stirs up the flow data but was never the majority of the balance.
And This Trade Is Winding Down
The hedged portion isn't just small—it's been shrinking for two years. Leveraged funds' short positions grew from around $3 billion at launch, peaked at about $14 billion by late 2024, and have steadily declined to around $4.5 billion. This arbitrage trade has been unwinding throughout the entire period, not just recently.
This matters for interpreting the present. Heading into June, the hedged position roughly halved again—funds' shorts shrunk from about $6.4 billion to $4.3 billion—while ETFs saw daily outflows of $300–500 million. Viewed superficially, that looks like panicked capitulation. But with futures data, it's just the routine cleanup of an interest rate trade that's no longer profitable. The same outflow numbers, two starkly different stories.
When the Basis Compresses, Demand Retreats
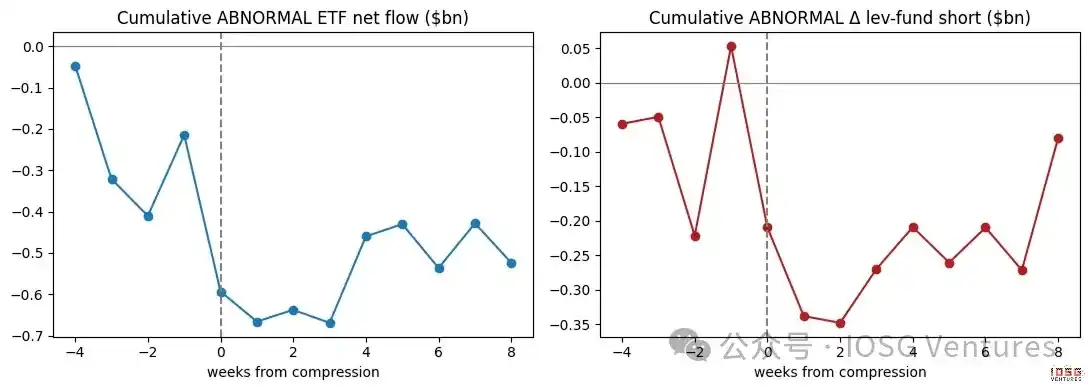
The cleanest proof is what happens when the trade stops being profitable. When that $3 spread narrows to almost match what traders can earn risk-free, the trade isn't worth doing. If a large chunk of weekly demand truly is this trade, then weekly demand should weaken exactly when the spread compresses—and it does. Detrend each series and observe moments around a compression: ETF inflows drop below their normal rhythm, and funds simultaneously cover shorts, both happening in sync. Demand and the trade breathe together.
True believers wouldn't care about the futures basis. And this weekly "demand" clearly does.
III. What Comes First, and Who's Really Doing It
First, the relationship is contemporaneous—tightest within the same week, with no clear lead or lag; and what little directional evidence exists actually points the opposite way: ETF flows appear to drive shorts, not the other way around. This fits the logic of a paired trade: buy the ETF first, then follow with the futures hedge, rather than shorting magically "creating" an inflow. Second, the arbitrage crowd isn't the sole driver. Flows track leveraged fund shorts most closely, but they also resonate with directional institutional positions—both types of buyers are active. The argument here is not that every inflow is hedged; it's that the hedged trade is the tightest, most reliable driver of week-to-week volatility.
Ethereum: The Same Trade, But the Math Barely Works
Applying the same test to Ethereum ETFs, the signature is still there but weaker—the link to futures shorts is looser, and the underlying stable directional buying is almost non-existent. The reason is clear. Holding spot Ethereum instead of a future means forgoing the staking yield Ethereum offers, roughly 3%–4% annually. After deducting that, Ethereum's basis is often negative—the arbitrage trade often can't even clear its hurdle rate. So Ethereum ETFs have neither strong conviction buying nor robust arbitrage positions underpinning them; they are just smaller and noisier than their Bitcoin counterparts.
IV. How to Read ETF Flows from Now On
The point isn't a judgment on price, but a method for reading flows. When the basis is rich, expect "institutional demand" to appear strong and largely hedged—don't mistake that strength for faith. When the basis compresses, expect inflows and shorts to retreat together—don't misinterpret the resulting outflows as the market passing judgment on Bitcoin. The two numbers worth watching are: the level of the annualized basis yield relative to the T-bill rate, and the net short position of leveraged funds in the weekly CME report. They will tell you how much of the next "demand" headline is real.
How We Measured It
A few honest limitations. The basis is constructed from the front-month CME futures contract against spot, excluding the final few days before each expiration (where the extremely short time-to-expiry can amplify rounding errors into spurious spikes). Building the series contract-by-contract would sharpen the exact numbers but wouldn't change the conclusion. The relationship between flows and shorts is a strong co-movement, not proof of one causing the other—the key point is they are two halves of the same trade. The futures short number is an upper bound on how much ETF buying is hedged, because some shorting hedges coins held elsewhere.
None of this changes the main narrative. Week-to-week, Bitcoin ETF "demand" is mostly a hidden interest rate trade, not faith—flows measure the activity of arbitrage participation far more accurately than they measure conviction. And that real buying is genuine, patient, and now constitutes almost all that's left, because the "rented" portion has spent two years quietly heading home.