M2 money supply could be a better measure of inflation than CPI

cryptoslatePublished on 2022-11-11Last updated on 2022-11-11

Abstract

The M2 is a measure of the money supply in an economy that includes cash and checking deposits.

When markets turn red and inflation starts soaring, both regulators and consumers turn to CPI as a gauge for the damage done by soaring prices but in the chaos that ensues as markets enter into a recession, one metric always seems to be overlooked — the M2 money supply.

The M2 is a measure of the money supply in an economy that includes cash and checking deposits, savings deposits, money market securities, and various other time deposits. The assets included in M2 are less liquid than M1, which includes just cash and checking deposits, but are usually liquid and can be quickly converted to cash.

Central banks use M2 to shape monetary policy when inflation arises, making it one of the most important metrics when economies start to slow down.

Looking at the data from the U.S. Federal Reserve shows that M2 has been growing exponentially since 1980. Every time the Federal Reserve attempted to reduce its balance sheet recession ensued. Periods of recession have historically sped up the growth of M2, as the Fed’s quantitative easing approach increased the supply of money in the economy.

This is evident in the Fed’s data — gray areas on the graph below indicate periods of recession and show the increase in M2.

fed m2
fed m2

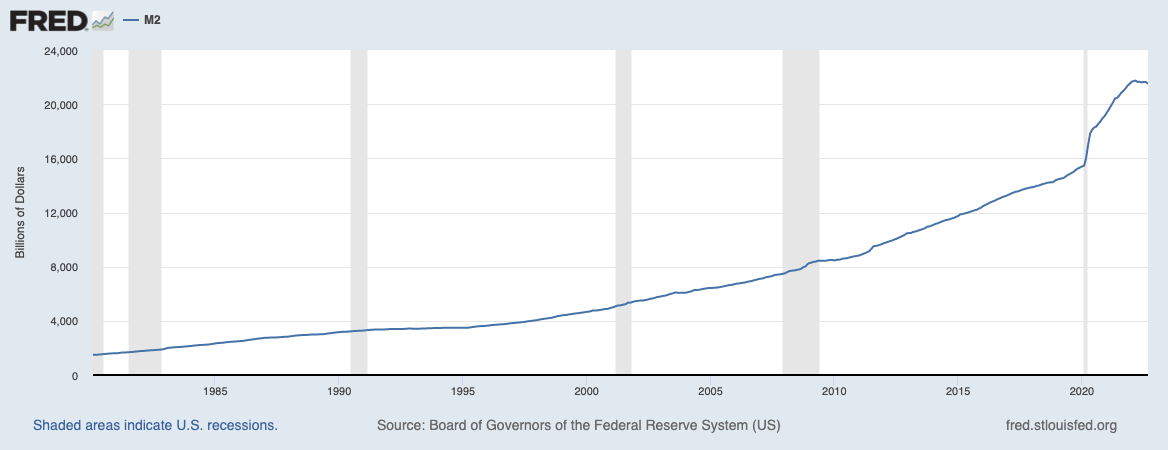
Graph showing the M2 money supply in the U.S. from 1980 to 2022 (Source: The Federal Reserve)

Many economists believe that M2 is a much better gauge for inflation than CPI. The coveted consumer price index tracks the average increase across a basket of consumer products and is used to estimate the average increase in prices consumers experience.

However, CPI presents average increases and has a tendency to show a much lower price increase than consumers actually experience.

The latest numbers put the CPI increase at around 8%. However, consumers have felt a price increase that far exceeds 8%. Looking at the increase in M2 paints a much more realistic picture of price increases.

The year-over-year increase in M2 currently stands at above 25% and feels more in line with what consumers experience.

m2 bitcoin
m2 bitcoin

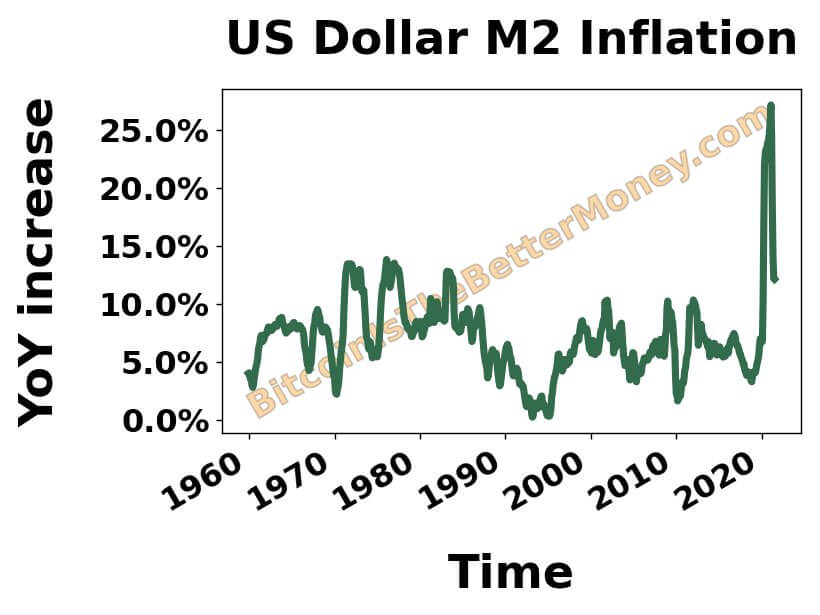
Graph showing the YOY increase in M2 (Source: BitcoinIsTheBetterMoney.com)

The growing M2 money supply isn’t only a gauge for inflation — it’s also a solid indicator of Bitcoin’s performance.

The global M2 plays a key role in Bitcoin’s price movements — when it shrinks, Bitcoin’s price drops. When the M2 grows, Bitcoin’s price grows as well.

Looking at the data for the Federal Reserve, the European Central Bank (ECB), and the Bank of Japan (BOJ) shows the correlation between M2 and Bitcoin’s performance. Every time the global M2 grew Bitcoin’s price saw a parabolic run that triggered a bull market. Every time it decreased, Bitcoin experienced a slump that led to a bear market.

In 2015, 2019, and 2022 the Federal Reserve embarked on an aggressive quantitative tightening spree. Each of those years Bitcoin’s price hit a bottom.

global m2 bitcoin
global m2 bitcoin

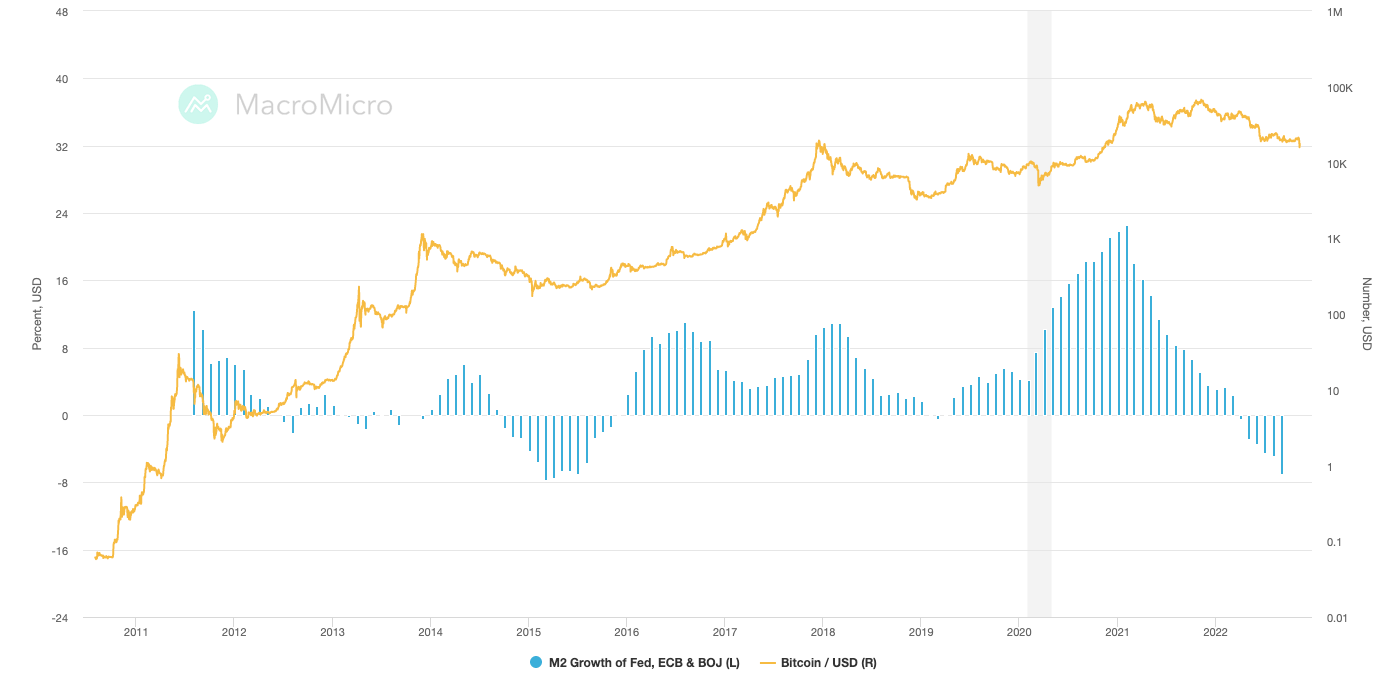
Graph showing the M2 growth of the Federal Reserve, ECB, and BOJ compared to Bitcoin’s price from 2011 to 2022 (Source: MacroMicro)

It’s still too early to predict how Bitcoin will react in this cycle of quantitative tightening. The current M2 money supply in the U.S. stands at around $21.5 trillion and is continuing to slightly decrease since peaking at $21.7 trillion in March this year.

The dropping M2 correlates with Bitcoin’s price slump. If it continues the downward trend Bitcoin’s price could fail to recover and regain its yearly high. However, for the current credit-based economy in the U.S. to remain a credit-based economy, the supply of U.S. dollars must continue to rise. In the long run, the endless cycle of printing money could be good for Bitcoin.

Trending Cryptos

Related Reads

With Labour Changing Leaders, Is the Long-Suppressed UK Crypto Market About to Turn Around?

Labour leader change: Hope for UK crypto market? With Keir Starmer's resignation as Prime Minister and Labour leader, a leadership contest has begun. Andy Burnham, the former Mayor of Greater Manchester and now the overwhelming favourite to succeed, has sparked cautious optimism within the UK cryptocurrency industry. Industry figures hope Burnham, seen as more receptive to digital assets than much of the Labour establishment, could shift the party's traditionally harder line. The leadership transition is expected to be swift, with prediction markets like Polymarket assigning a 97% probability to Burnham becoming the next Prime Minister. However, this political shift comes as a comprehensive regulatory framework for crypto, established by law earlier this year, is in its final implementation phase. The Financial Conduct Authority (FCA) is finalizing detailed rules covering trading, custody, stablecoins, and market abuse, with the full regime set to go live in October 2027. While a new Prime Minister can reshuffle ministers and adjust policy priorities, the core regulatory architecture is now law and unlikely to be fundamentally overturned without significant, deliberate government intervention. The main industry hope is that a Burnham government, focusing on economic growth, will ensure the FCA's implementation is pragmatic and growth-oriented. Industry advocates seek proportionate capital requirements, a streamlined licensing process, and clear rules for staking and stablecoins. They argue that embracing the crypto sector could attract investment and listings to London's struggling markets. Despite the optimism, concerns remain that regulatory implementation may still be influenced by more sceptical factions within the Labour party.

Foresight News9m ago

With Labour Changing Leaders, Is the Long-Suppressed UK Crypto Market About to Turn Around?

Foresight News9m ago

A 60-Day Window Depresses Oil Prices, So Why Is the Market Falling Instead?

International oil prices continued to decline on June 23, extending significant losses from the previous session. The market shifted focus from Middle East military risks to actual supply changes following a temporary U.S.-Iran arrangement. The immediate trigger was the resumption of traffic through the Strait of Hormuz, a critical oil shipping chokepoint, with two tankers passing through, signaling eased near-term supply disruption fears. Prices retreated as the "worst-case scenario" was temporarily averted. A reported 60-day window in a U.S.-Iran understanding allows Iran to sell oil during this period, further dampening supply concerns. However, this arrangement is temporary, linked to nuclear talks, and does not guarantee a long-term solution. Market sentiment remains cautious because the deal could still unravel, potentially reinstating sanctions or disrupting shipping. While these developments have lowered immediate risk premiums, prices have not fully returned to pre-conflict levels. Geopolitical news, particularly regarding the stability of the Strait of Hormuz or the progress of negotiations, could quickly reverse the price drop. Additionally, low U.S. strategic petroleum reserves limit the emergency buffer available if supply shocks reemerge. Therefore, the current price decline reflects a reduction in near-term panic, not a complete elimination of Middle East supply risks.

marsbit25m ago

A 60-Day Window Depresses Oil Prices, So Why Is the Market Falling Instead?

marsbit25m ago

SK Hynix Market Cap Exceeds Samsung for First Time in 26 Years, Korean Broker Calls for 50% More Upside

SK Hynix's market capitalization surpassed Samsung Electronics for the first time in 26 years on June 22, reaching 208.1 trillion won. The shift reflects a market trend where companies directly benefiting from AI infrastructure, like SK Hynix, are receiving higher valuation premiums than diversified giants. The surge is driven by AI-driven demand for High Bandwidth Memory (HBM), where SK Hynix holds a dominant 70-80% market share. Its Q1 2026 revenue exceeded 50 trillion won for the first time, with an operating profit margin of 72%. Hanwha Investment & Securities significantly raised its price target for SK Hynix to 430,000 won, the highest among Korean brokerages. The key rationale is that Long-Term Supply Agreements (LTAs) and robust HBM demand have fundamentally reduced the company's historical profit volatility. Several other brokers have also raised targets, arguing the valuation framework for memory semiconductors is being rewritten, moving away from a cyclical model. Despite the bullish outlook, the stock experienced a pullback of over 5% in regular trading on June 23 after briefly surpassing 3 million won pre-market, amid broader tech sector weakness. Some analysts caution that the市值 overtaking Samsung, whose profit scale and growth forecasts remain higher, could signal short-term overheating. However, high-return investors viewed the dip as a buying opportunity.

marsbit43m ago

SK Hynix Market Cap Exceeds Samsung for First Time in 26 Years, Korean Broker Calls for 50% More Upside

marsbit43m ago

GPU Rental Prices Drop 30% in Three Weeks: AI Value Chain Migrating from Nvidia to Memory Chips

GPU rental prices for Nvidia's flagship B200 chip have fallen by approximately 30% over three weeks, dropping from a high of $6.11/hour to $4.22/hour. This decline signals a potential easing of the "compute scarcity" narrative that has long supported AI hardware valuations. Concurrently, the semiconductor market is witnessing a significant divergence: while the VanEck Semiconductor ETF (SMH) has risen 15% in the past month, with memory giants Micron and SanDisk each surging nearly 60%, Nvidia's stock has declined about 3% over the same period. Analysts suggest this shift indicates that the AI value chain's bottleneck and profits are migrating from compute (GPUs) to memory. Demand for high-bandwidth memory (HBM) remains intensely strong, with contract prices soaring over 100% in H1 2026, granting memory manufacturers significant pricing power. In contrast, increased B200 supply from improved manufacturing yields and competitive pressure from new cloud providers are softening GPU rental rates. While long-term contracts, like SpaceX's $30 billion deal with Google, show sustained large-scale demand for Nvidia hardware, the softening spot prices pressure the margins of cloud providers and could eventually impact Nvidia's order flow if chip prices don't adjust. The key takeaway for investors is not a weakening AI thesis, but a recalibration within the sector: pricing power appears to be strengthening for memory chipmakers while showing signs of strain for leading GPU suppliers.

marsbit52m ago

GPU Rental Prices Drop 30% in Three Weeks: AI Value Chain Migrating from Nvidia to Memory Chips

marsbit52m ago

Trading

Spot
Futures

Hot Articles

What is $BITCOIN

DIGITAL GOLD ($BITCOIN): A Comprehensive Analysis Introduction to DIGITAL GOLD ($BITCOIN) DIGITAL GOLD ($BITCOIN) is a blockchain-based project operating on the Solana network, which aims to combine the characteristics of traditional precious metals with the innovation of decentralized technologies. While it shares a name with Bitcoin, often referred to as “digital gold” due to its perception as a store of value, DIGITAL GOLD is a separate token designed to create a unique ecosystem within the Web3 landscape. Its goal is to position itself as a viable alternative digital asset, although specifics regarding its applications and functionalities are still developing. What is DIGITAL GOLD ($BITCOIN)? DIGITAL GOLD ($BITCOIN) is a cryptocurrency token explicitly designed for use on the Solana blockchain. In contrast to Bitcoin, which provides a widely recognized value storage role, this token appears to focus on broader applications and characteristics. Notable aspects include: Blockchain Infrastructure: The token is built on the Solana blockchain, known for its capacity to handle high-speed and low-cost transactions. Supply Dynamics: DIGITAL GOLD has a maximum supply capped at 100 quadrillion tokens (100P $BITCOIN), although details regarding its circulating supply are currently undisclosed. Utility: While precise functionalities are not explicitly outlined, there are indications that the token could be utilized for various applications, potentially involving decentralized applications (dApps) or asset tokenization strategies. Who is the Creator of DIGITAL GOLD ($BITCOIN)? At present, the identity of the creators and development team behind DIGITAL GOLD ($BITCOIN) remains unknown. This situation is typical among many innovative projects within the blockchain space, particularly those aligning with decentralized finance and meme coin phenomena. While such anonymity may foster a community-driven culture, it intensifies concerns about governance and accountability. Who are the Investors of DIGITAL GOLD ($BITCOIN)? The available information indicates that DIGITAL GOLD ($BITCOIN) does not have any known institutional backers or prominent venture capital investments. The project seems to operate on a peer-to-peer model focused on community support and adoption rather than traditional funding routes. Its activity and liquidity are primarily situated on decentralized exchanges (DEXs), such as PumpSwap, rather than established centralized trading platforms, further highlighting its grassroots approach. How DIGITAL GOLD ($BITCOIN) Works The operational mechanics of DIGITAL GOLD ($BITCOIN) can be elaborated on based on its blockchain design and network attributes: Consensus Mechanism: By leveraging Solana’s unique proof-of-history (PoH) combined with a proof-of-stake (PoS) model, the project ensures efficient transaction validation contributing to the network's high performance. Tokenomics: While specific deflationary mechanisms have not been extensively detailed, the vast maximum token supply implies that it may cater to microtransactions or niche use cases that are still to be defined. Interoperability: There exists the potential for integration with Solana’s broader ecosystem, including various decentralized finance (DeFi) platforms. However, the details regarding specific integrations remain unspecified. Timeline of Key Events Here is a timeline that highlights significant milestones concerning DIGITAL GOLD ($BITCOIN): 2023: The initial deployment of the token occurs on the Solana blockchain, marked by its contract address. 2024: DIGITAL GOLD gains visibility as it becomes available for trading on decentralized exchanges like PumpSwap, allowing users to trade it against SOL. 2025: The project witnesses sporadic trading activity and potential interest in community-led engagements, although no noteworthy partnerships or technical advancements have been documented as of yet. Critical Analysis Strengths Scalability: The underlying Solana infrastructure supports high transaction volumes, which could enhance the utility of $BITCOIN in various transaction scenarios. Accessibility: The potential low trading price per token could attract retail investors, facilitating wider participation due to fractional ownership opportunities. Risks Lack of Transparency: The absence of publicly known backers, developers, or an audit process may yield skepticism regarding the project's sustainability and trustworthiness. Market Volatility: The trading activity is heavily reliant on speculative behavior, which can result in significant price volatility and uncertainty for investors. Conclusion DIGITAL GOLD ($BITCOIN) emerges as an intriguing yet ambiguous project within the rapidly evolving Solana ecosystem. While it attempts to leverage the “digital gold” narrative, its departure from Bitcoin's established role as a store of value underscores the need for a clearer differentiation of its intended utility and governance structure. Future acceptance and adoption will likely depend on addressing the current opacity and defining its operational and economic strategies more explicitly. Note: This report encompasses synthesised information available as of October 2023, and developments may have transpired beyond the research period.

431 Total ViewsPublished 2025.05.13Updated 2025.05.13

What is $BITCOIN

Discussions

Welcome to the HTX Community. Here, you can stay informed about the latest platform developments and gain access to professional market insights. Users' opinions on the price of BTC (BTC) are presented below.

活动图片