深入分析Alameda Research财务情况:SBF的“杠杆飞轮”还玩得转吗?

PanewsPublished on 2022-11-08Last updated on 2022-11-08

Abstract

该公司最大的资产是 SBF 的另一家公司发行的加密代币,其资产中有很大一部分是其他关联方发行的代币。

该公司最大的资产是 SBF 的另一家公司发行的加密代币,其资产中有很大一部分是其他关联方发行的代币。

Sam Bankman-Fried,更为人所知的是 SBF,以成为房间里最聪明的人而闻名。这位加密货币亿万富翁控制着最大的加密货币对冲基金之一 Alameda Research 和最大的加密货币交易所之一 FTX。他出现在多家加密货币公司的失败中,救助了加密货币贷方 Blockfi,并在各自失败后收购了 Voyager Digital 的大部分资产。有些人甚至将他在最近的加密货币溃败中的角色与 1907 年危机期间的摩根大通进行了比较。然而,最近的一次泄露表明 SBF 的加密帝国建立在一些有问题的基础之上。

11 月 2 日,Coindesk 的一份报告分享了 Alameda Research 的一些关键财务细节,Alameda Research 是加密货币大亨 Sam Bankman-Fried(「SBF」)控制的加密货币对冲基金。Coindesk 报告说,他们已经获得了对冲基金第二季度资产负债表的副本。根据他们的报告,该公司的资产负债表包括:

总资产:146 亿美元。这包括 58 亿美元的 FTT 代币、12 亿美元的 Solana 代币 (SOL)、33.7 亿美元的身份不明的「持有的加密货币」、20 亿美元的「股本证券投资」。这留下了大约 22 亿美元的资产。根据我们的消息来源,数亿美元的剩余资产由 Alameda 持有的 Serum (SRM)、Oxygen (OXY)、MAPS 和 FIDA 代币组成,所有这些都来自其他 SBF 项目。根据这份资产负债表,2022 年 6 月,Alameda 手头只有 1.34 亿美元现金。

总负债:80 亿美元,其中 74 亿美元是「贷款」,另外还欠价值 2.92 亿美元的 FTT 代币。Coindesk 文章未确认其余部分。

据称 Alameda 财务数据的泄露表明,该公司最大的资产是其持有的「FTX 代币 (FTT)」,该代币 由 SBF 的 FTX 交易所发行。Alameda 资产负债表上的 FTT 代币约占其总资产的 1/3,相当于 Alameda 净资产的 88%。换句话说,该公司最大的资产是 SBF 的另一家公司发行的加密代币,其资产中有很大一部分是其他关联方发行的代币。

就好像 SBF 找到了破解金融系统的方法,凭空印制了数十亿美元,他可以借此从未知的交易对手那里借入巨额资金。几乎就像他发现了一台金融永动机一样……

也许是飞轮?

飞轮方案的基本架构

飞轮计划,以我最喜欢的飞轮计划者的名字命名

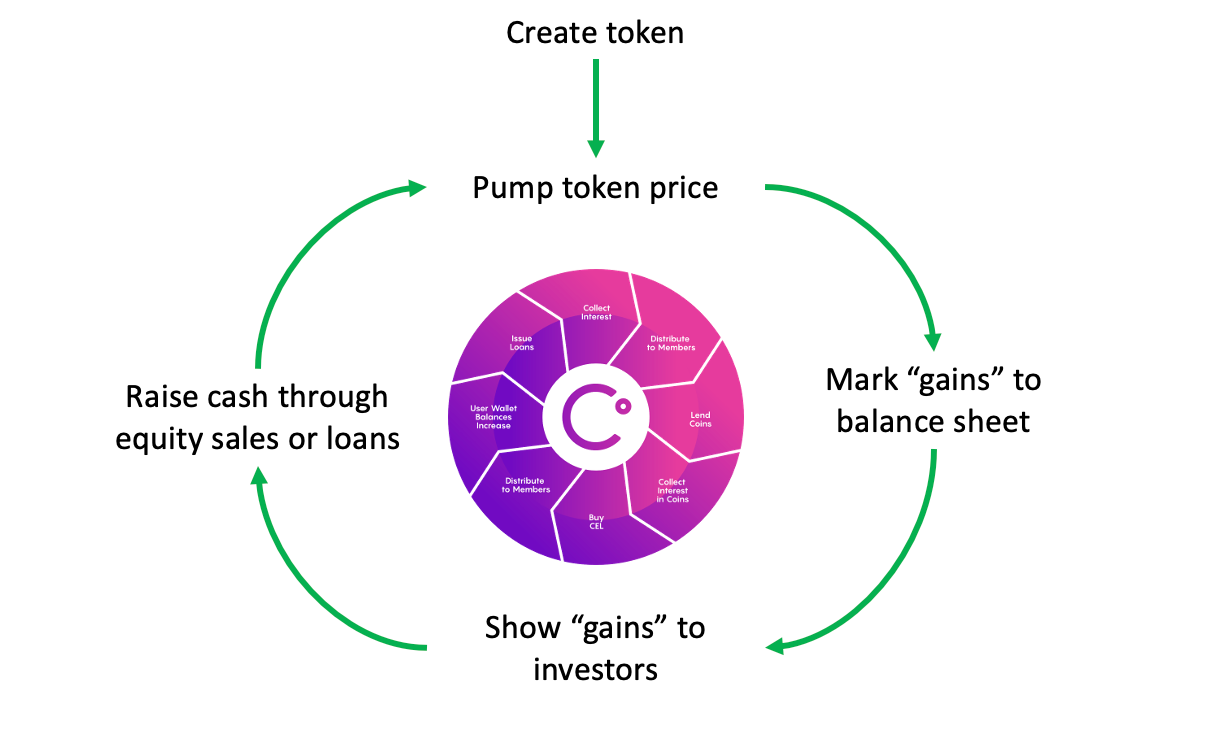
该网站的读者会记得,现已解散的 Celsius Network 是一家价值数十亿美元的加密借贷公司(庞氏骗局),与 SBF 有非常密切的联系,部分被其代币 CEL 摧毁。Celsius Network 是围绕 CEL 代币建立的,其绝妙的想法是它可以用来旋转数十亿美元的免费资产。飞轮方案的结构非常简单:

创建代币:代币实际上只是区块链上的一小段代码。吸盘并开始滚动的程序。确保将大部分代币保留在资产负债表上,以实现最大程度的飞轮。

推动代币价格:保留「做市商」。使用您客户的资产购买代币。把它洗到无穷大。不惜一切代价将这个价格推高!而且由于您为自己保留了大部分代币,因此可以抽出的代币要少得多。

将这些婴儿标记为市场:没错!现在你获得了回报;至少,在纸面上。现在,您可以在资产负债表上显示数十亿美元的「资产」。

炫耀你的成功:现在是兑现的时候了。吸引一些精明的投资者(吸盘),比如养老基金,为你的股权大幅多付,或者让你用你的代币抵押大笔贷款。

保持飞轮旋转:现在您拥有真正的美元。给自己买点好东西,比如体育场冠名权、政治家或失败的加密公司。但不要忘记:如果飞轮停止旋转,您将度过一段糟糕的时光。

当然,没有什么事情真的这么简单。事实证明,飞轮计划只是另一种不可持续的金融工程,原因有几个。首先,随着您将代币价格推高,保持价格上涨的成本开始增加;拥有代币的人越来越有动力卖光,迫使你以更高的价格购买更多代币。最终,你要么没钱,要么拥有所有存在的代币,要么停止购买。这是你不能做的,因为如果你停下来,一切都会崩溃。

更关键的是,事实证明,将大量完全非流动性的资产投放市场只会在纸面上产生财富。摄氏尽管持有超过负债的数亿 CEL,但无法在不将代币价格降至零的情况下清算这些代币的任何重要部分。当没有人想要拥有它们时,这就是控制超过 90% 的流通代币的危险!

如果您认为我们不公平或愤世嫉俗,请阅读 Sam Bankman-Fried 本人在接受彭博社采访时如何描述代币计划。

FTT 代币是另一个愚蠢的飞轮

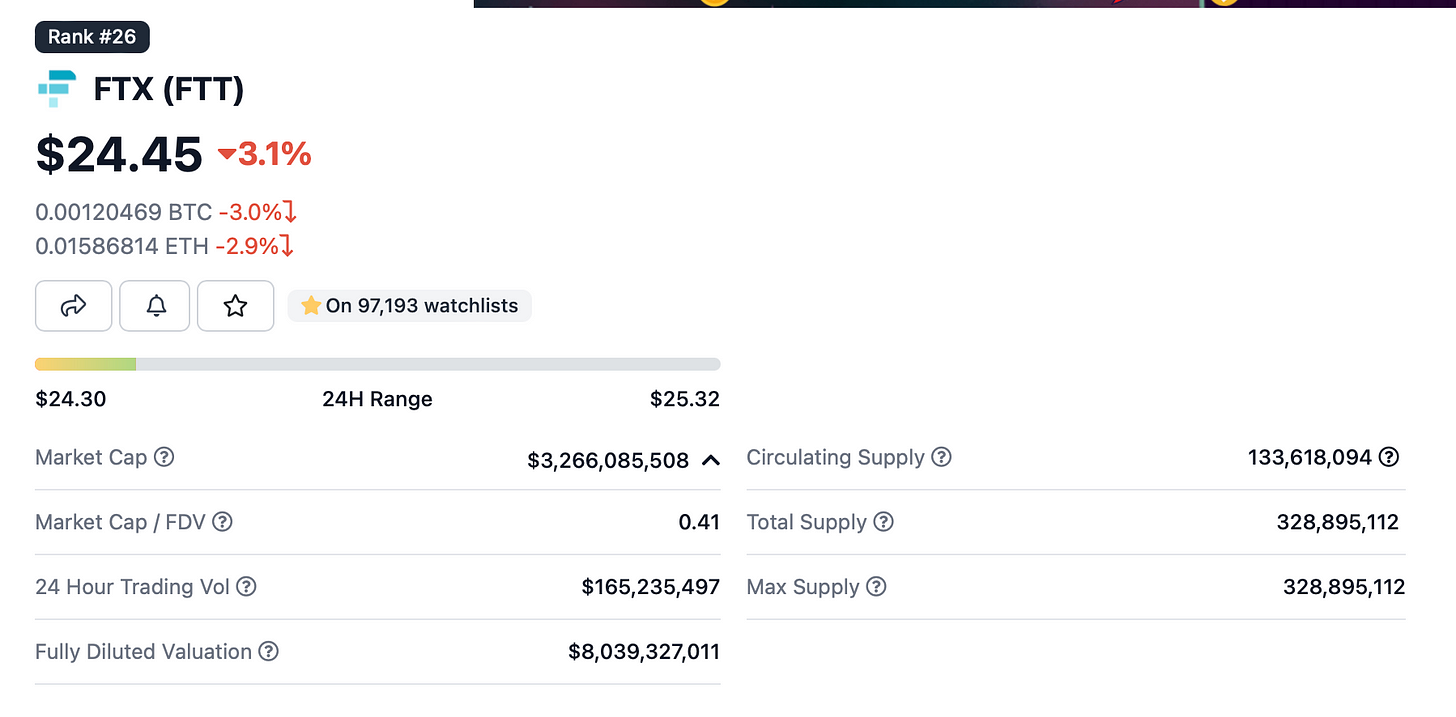
根据 Coindesk 的报告,Alameda 在 2022 年 6 月拥有 58 亿美元的 FTT 代币。根据市场聚合商 CoinGecko 的数据,这相当于代币总流通供应量的 180%:

180%。让它沉入水中。

对区块链的扫描确认 FTT 所有权高度集中,仅 10 个地址持有 93% 的代币:

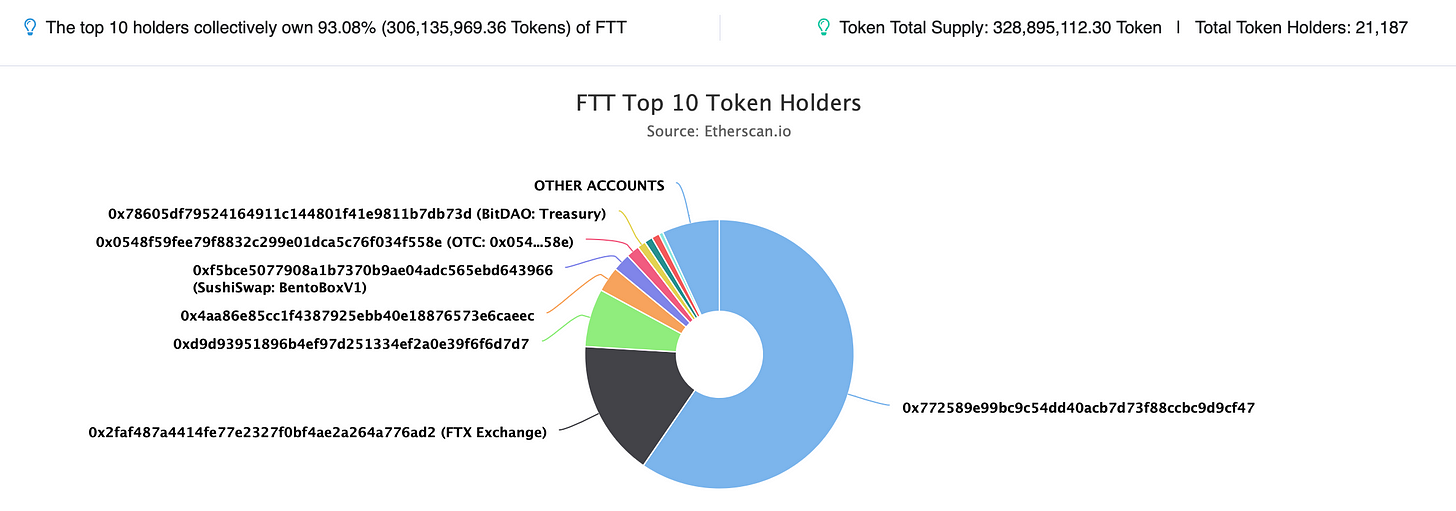
FTT 代币分配的以太坊数据(Etherscan)

更令人担忧的是,区块链分析公司 Messari 显示,只有 180-200 个地址在 FTT 代币中进行活跃交易。一个异常值发生在 2022 年 8 月 5 日,当时突然有大约 10,000 个地址短暂活跃(???)。这进一步表明个人 FTT 持有者的数量非常少,以及对该代币的总体需求较低:
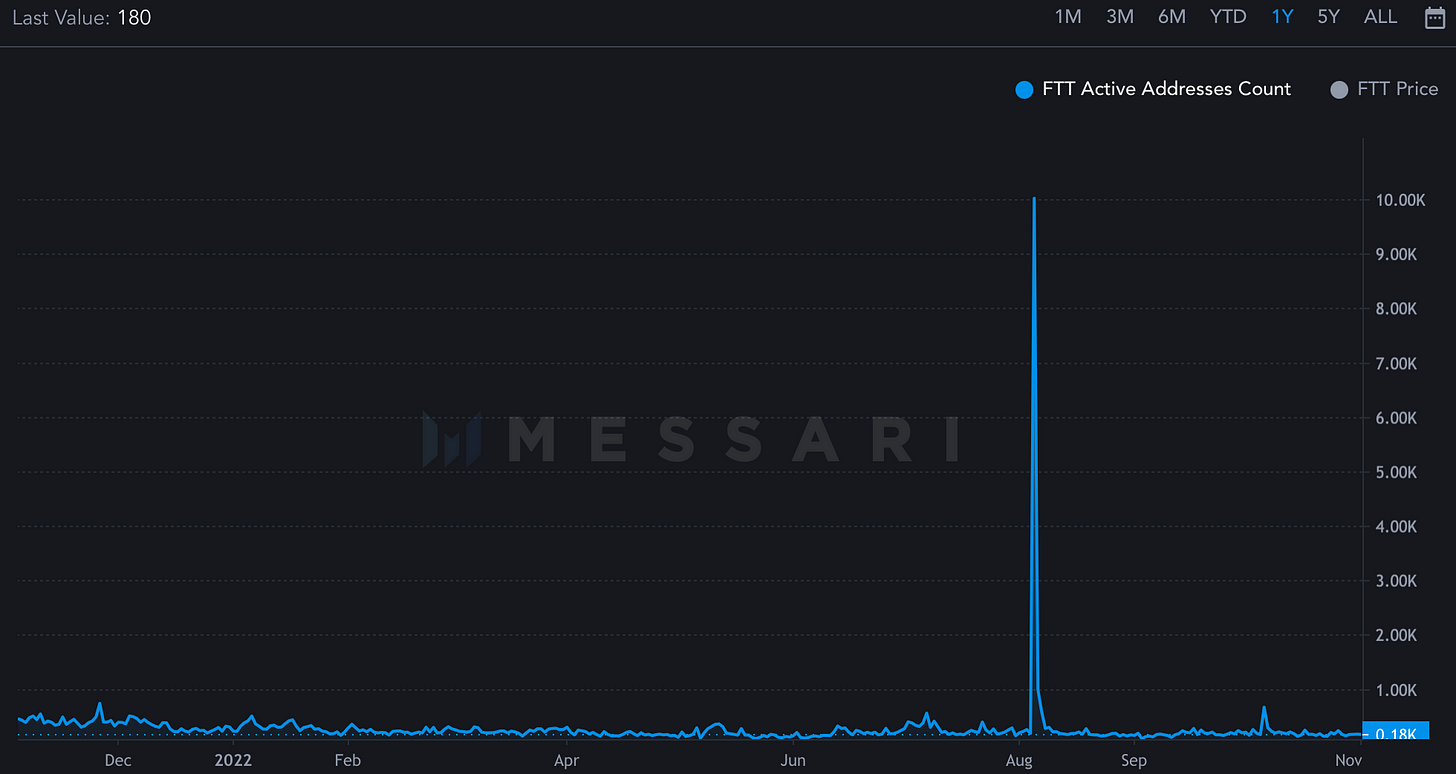
Messari FTT 活跃钱包计数

为了比较,让我们看一下市值相似的加密代币 Chainlink (LINK)。活跃的 LINK 钱包是 FTT 钱包的十倍以上:

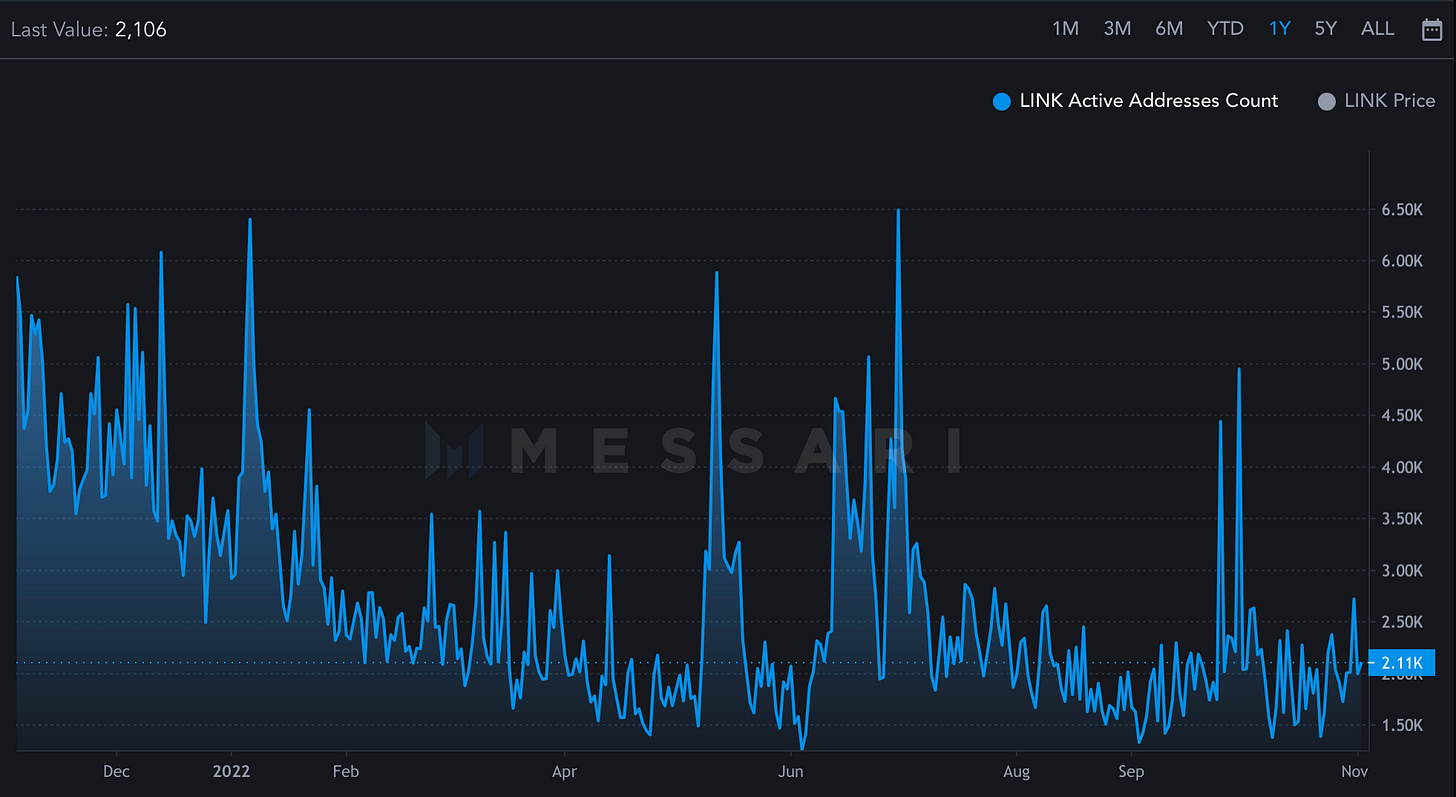
过去 1 年的 Messari 活跃 LINK 地址数

FTT 的交易量说明其缺乏人气。上个月,FTT 的日交易量在 600 万美元到 4200 万美元之间波动,相当于 AlamedaFTT 总持股量的 0.1% - 0.8%。作为比较,Messari 显示 LINK 的实际交易量在 2500 万美元到 1.73 亿美元之间,大约是 FTT 的四倍。

FTX 承认自己是 FTT 代币的积极买家,声称每周花费「FTX 市场产生的费用的 33%」购买 FTT。FTX 然后「烧掉」这些代币以减少总供应量。在过去的几个月里,FTX 每周购买 FTT 的金额在 2.5 美元到 500 万美元之间。

让我们来看看过去一个月通过 FTT 交易所(FTT 交易量最多的主机)的 FTT 区块链流量:

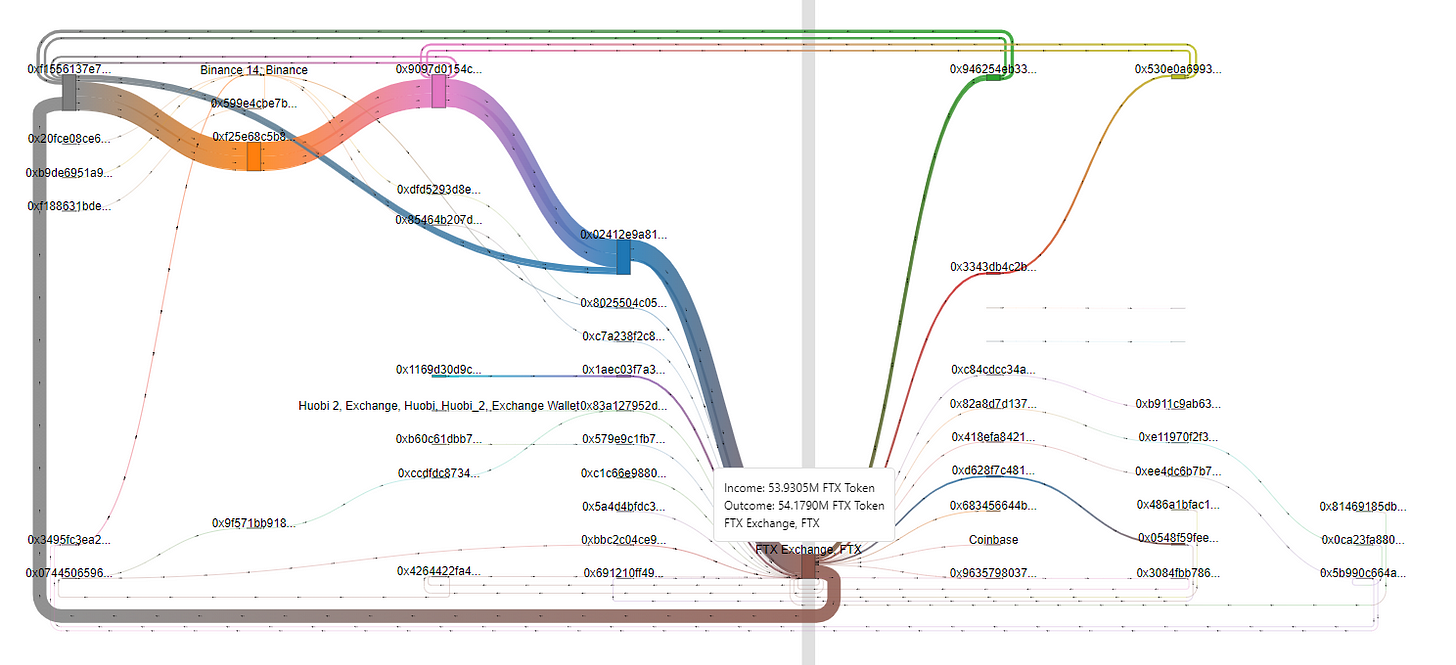
FTT 代币在过去 30 天内流经 FTX 交易所。

嗯,所有的代币都围成一个大圆圈。这肯定表明有机市场需求。我以前从未见过这个!顺便说一句:通过最大钱包的代币数量意味着这是Alameda通过交易所搅动数百万 FTT 代币。出于什么目的?

所有这一切都表明,Alameda将永远无法兑现大部分 FTT 来偿还债务。买家很少,最大的买家似乎是与 Alameda 关系最密切的公司。这种情况的现实是,Alameda 为 FTT 代币积累的绝大多数价值是无法实现的,在大额销售的情况下,他们的 FTT 的公平市场价值将迅速接近 0 美元。

那么其他 SBF 项目代币呢?

Alameda 还在其资产负债表上显示了来自其他几个与 SBF 相关的加密项目的代币。其中包括 Serum (SRM),SBF 的 Solana 区块链上的去中心化交易所;MAPS,带有 DeFi 插件的地图应用程序的代币(lol,lmao);Oxygen(OXY),「区块链上的主要经纪商」;和 Bonfida (FIDA),另一个与 Solana 相关的项目,托管「Solana 名称服务」。令人震惊的是,这些项目中的大多数都是哑弹。

根据我们的消息来源,Alameda 在其资产负债表上至少持有这四种代币「价值」数亿美元。

SRM、OXY、MAPS 和 FIDA 的总流通市值为 3.21 亿美元。也就是说,Alameda 持有的这些代币再次远超目前流通的代币总量。这是可能的,因为这些项目的大多数代币仍然「锁定」并且尚未流通。例如,到 2027 年,SRM 代币最终将拥有 100 亿代币的总流通量:
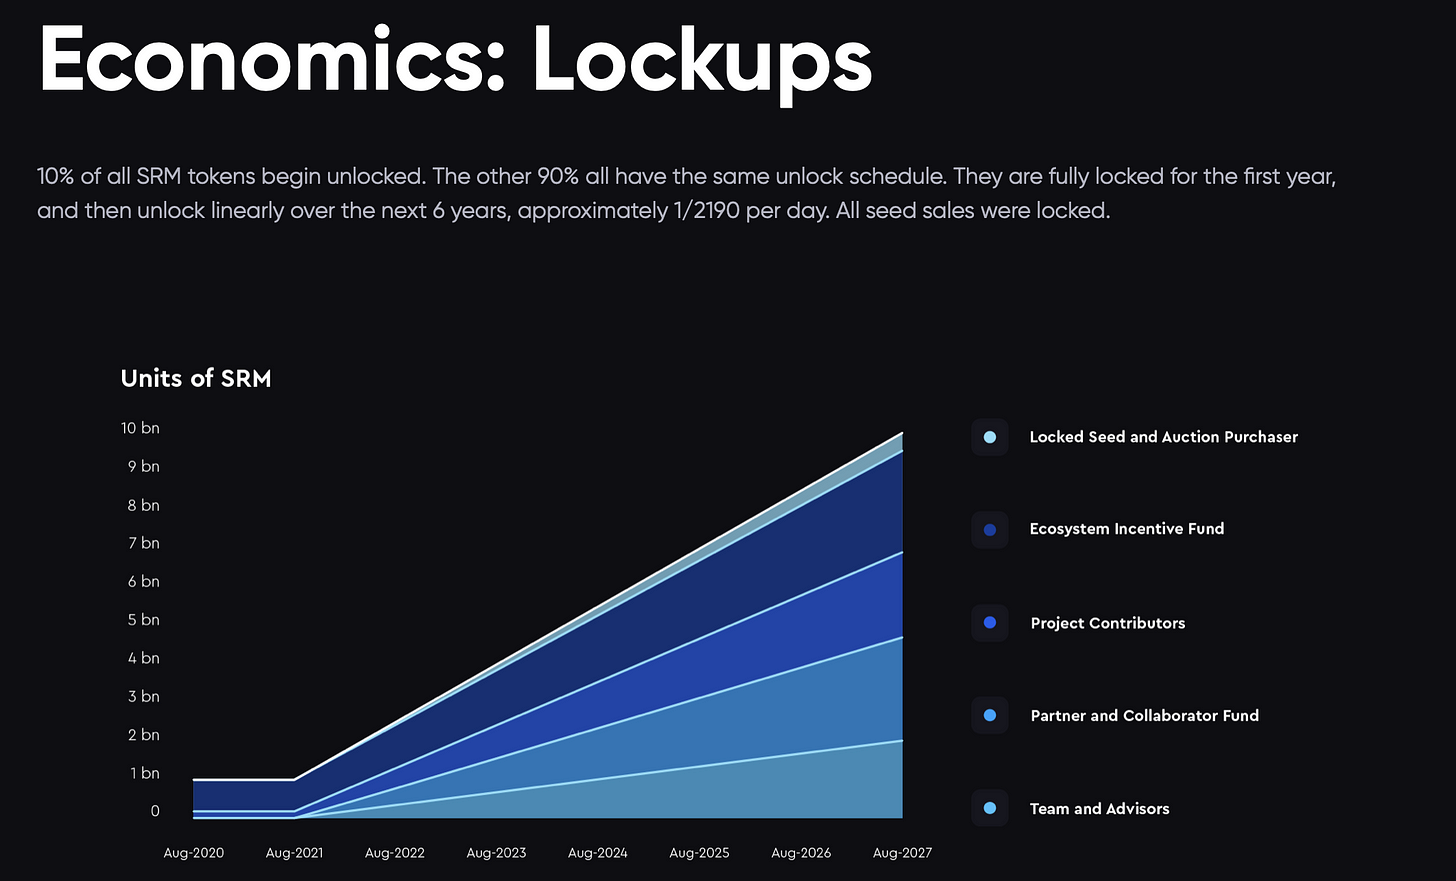
哎呀,我想知道价格会发生什么变化?

同样,Alameda实际上不可能在不将这些代币价格推高至接近 0 美元的情况下清算这些「资产」的任何重要部分以偿还债务。没有人想要它们,因为没有人关心这些失败的项目。让我们快速浏览一下这些代币的数据:

SRM:SBF 在其 Solana 区块链网络上进行去中心化交易的代币。SRM 在过去 30 天内的实际每日交易量在 1.6 至 800 万美元之间波动。SRM 的总流通市值仅为 1.89 亿美元;这只是 SRM 总「市值」的一小部分,按今天的价格计算,该市值约为 70 亿美元。根据我们的分析和消息来源,Alameda 持有的流动性和锁定的 SRM 远远超过代币的总流通市值。

MAPS:Maps.me 是一个「地图应用程序」,它以某种方式具有 DeFi 功能和一个塞进项目的代币。当然,几乎没有人使用这个东西;MAPS 在 Twitter 上只有 28,000 名关注者。(相比之下,我们有将近 21,000 个!)
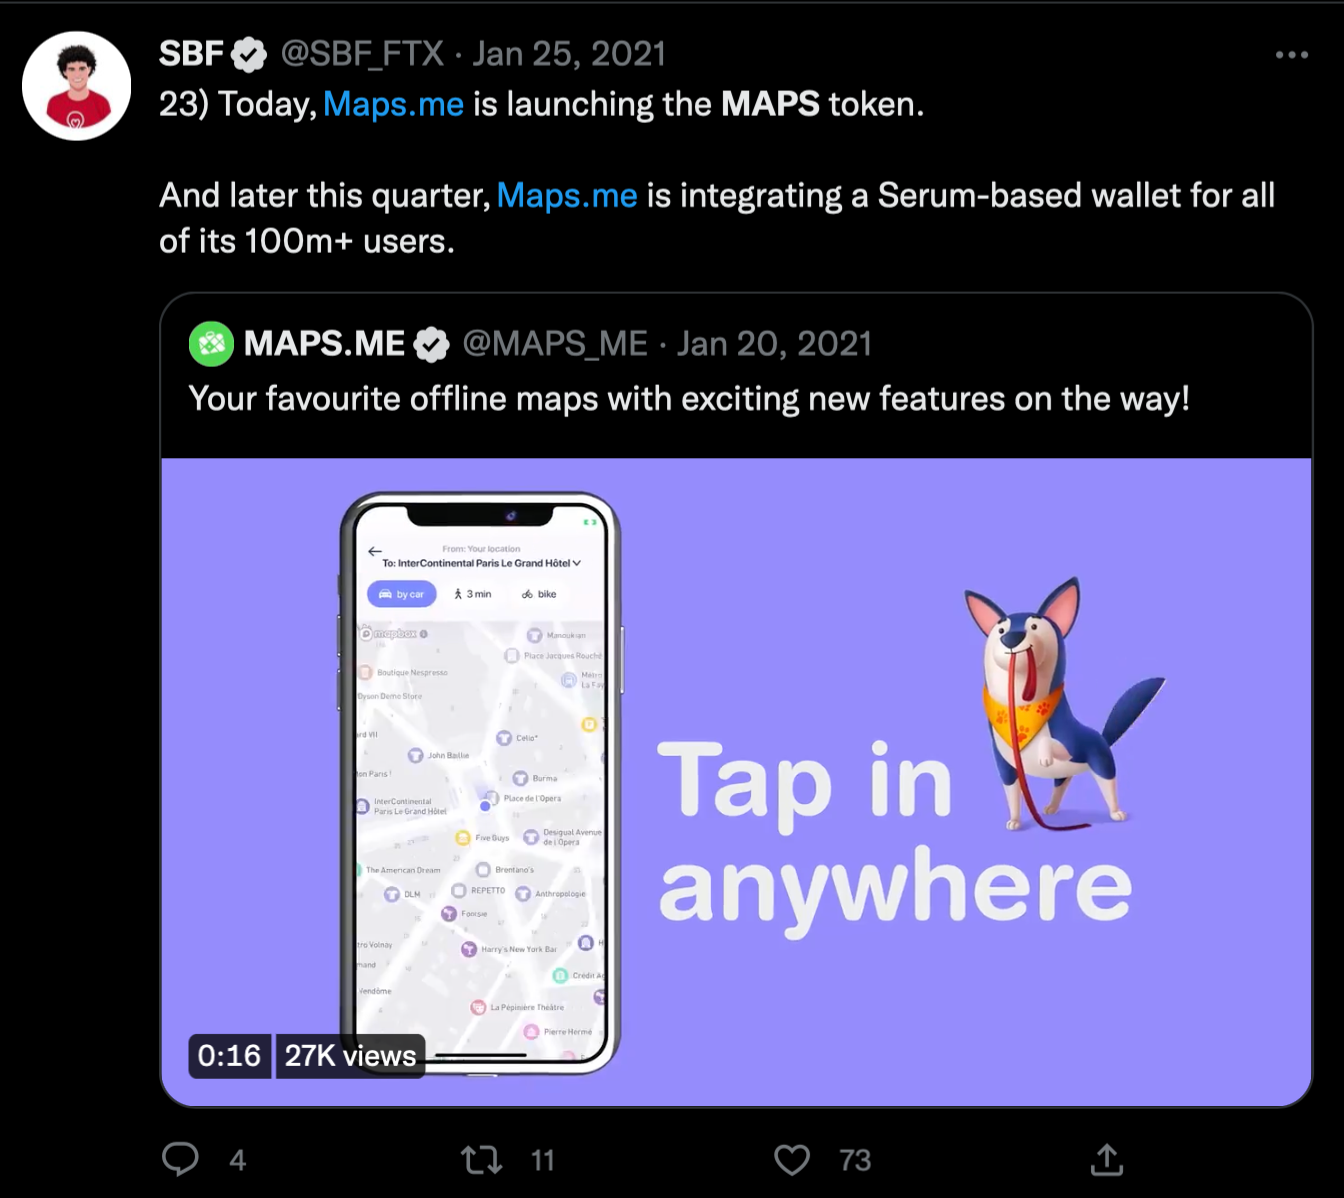
嗯。也许不是下一个 PayPal?

该项目一直如此不活跃,以至于 2022 年 8 月,他们在 Twitter 上发布了此消息,称他们对「有一段时间没有联系」表示「抱歉」,并为他们的项目引入了「新功能」:

看看那些订婚数字!Maps.me 的代币参与度也同样低迷。他们上个月的日交易量从 3,000 美元到高达 350,000 美元不等;这与仅 1000 万美元的流通市值相悖。然而,Alameda 选择在其资产负债表上专门列出这项资产……与 SRM 一样,存在 100 亿个此类代币,其中大部分仍「锁定」。同样,我们的数据表明,Alameda 持有的代币远远超过流通市值,超过这个数量的 10 倍。MAPS 从历史最高点下跌了 93%。

OXY 的流通市值仅为 800 万美元,解锁后的最高市值为 4.4 亿美元。它的每日交易量在 800 美元到 31,000 美元之间(哈哈,lmao)。它比历史最高点下跌了约 98%。Alameda 持有的代币似乎是目前流通市值的数倍。

FIDA:每日交易量为 280,000 至 400 万美元,流通市值为 2500 万美元。它从历史最高点下跌了 96%。FIDA 似乎是唯一一个 Alameda 的市值不超过总流通市值的例子;但是,他们持有的代币占流通中的大部分代币。

Coda:谁持有价值数十亿美元的Alameda无担保债务?

如果这个泄露的资产负债表是准确的,Alameda Research公司拥有 66 亿美元的净资产。根据我们的消息来源和保守估计,Alameda 的净资产超过了分配给其非流动性持有的 FTT、SRM、OXY、FIDA 和 MAPS 的价值。正如我们已经证明的那样,FTT 市场流动性极差,由 Alameda 和 FTX 主导。其他代币与不受欢迎和失败的项目有关,这些项目没有吸引力、参与度很低,并且都比历史高点下跌了 90% 以上。换句话说,Alameda发现自己处于与Celsius Network几乎相同的境地。

这一分析甚至没有触及Alameda资产负债表中包含的 20 亿美元「股权投资」。鉴于当前的市场状况以及公共和私人市场的大规模减记,如果需要出售,Alameda很容易看到这些投资的数亿美元损失。此外,我们想知道这些股权投资中有多少百分比用于 Maps.me 等失败的项目?我们也没有提及 Alameda 的 Solana 持股(价值超过 11 亿美元)被合理估值的乐观假设(至少可以说是一个很大的假设!)。

令人惊讶的是,Alameda 的资产负债表列出了 74 亿美元的贷款,其中 22 亿美元以 FTT 代币为抵押。谁知道Alameda资产负债表上其他毫无价值的代币抵押了多少……

谁持有这笔债务?他们得到回报的机会有多大?

Trending Cryptos

Related Reads

Rented Faith: How Much of the Bitcoin ETF Inflows Is Real Money?

"Rented Conviction: How Much of Bitcoin ETF Flows Is Real Money" The weekly inflows into Bitcoin ETFs are often interpreted as a gauge of institutional belief. However, a significant portion of this activity is driven by a hidden arbitrage trade, not directional conviction. The core mechanism is a cash-and-carry arbitrage: traders buy spot Bitcoin (often via ETFs) while simultaneously shorting CME futures to lock in the price difference, or "basis." This delta-neutral trade is essentially an interest rate play. In weekly data, about half the fluctuation in ETF flows can be explained by new short positions added by leveraged funds (hedge funds), with a correlation of 0.70. Bitcoin's price movement in a given week shows no statistical power in predicting these flows. While this arbitrage trade drives weekly *volatility*, it is not the main component of the cumulative *stock*. Of the total ~$55 billion in net ETF inflows, the current net arbitrage position is only about $1 billion. The remainder is steady, directional buying averaging ~$400 million per week, which constitutes the vast majority of the accumulated "mountain" over two years. Thus, ETF flow data overstates the *volatility* of conviction, not its *level*. This arbitrage trade has been unwinding for nearly two years. Leveraged fund short positions peaked at ~$14 billion in late 2024 and have since declined to ~$4.5 billion. When the basis compresses to unprofitable levels, ETF inflows and short positions retreat together. Recent outflows should not be mistaken for a loss of faith but rather the routine unwinding of this rate trade. For Ethereum ETFs, the pattern is weaker. Accounting for staking yield makes the basis often negative, so neither strong conviction buying nor robust arbitrage supports its flows. To interpret ETF flows correctly, monitor the CME basis versus T-bill rates and leveraged fund net shorts. They reveal how much of the next "demand" headline is real. The real, patient buy-and-hold demand is what constitutes the enduring bulk of ETF assets.

marsbit18m ago

Rented Faith: How Much of the Bitcoin ETF Inflows Is Real Money?

marsbit18m ago

Soaring Over Tenfold Within the Year: The Frenzy Over SK Hynix Leveraged Products

South China Morning Post The leveraged ETF tracking SK Hynix has surged over tenfold year-to-date, fueled by intense market speculation on the memory chip sector. By June 22, the value of the 'South Korea 2x Long SK Hynix ETF' listed in Hong Kong had skyrocketed by more than 1,061% since the start of the year, while its asset size exploded over twenty times from the end of last year. The rally is driven by AI-driven demand for high-bandwidth memory (HBM), with SK Hynix recently sampling its next-generation HBM4E product. However, industry professionals warn of significant risks. Leveraged ETFs magnify both gains and losses. During a recent market correction, while the underlying SK Hynix stock fell 19.1%, its double-leveraged ETF dropped nearly 38%. Korean regulators noted that such products could theoretically lose 60% in a single day. Additionally, these ETFs face risks like time decay in volatile markets, liquidity spirals during mass redemptions, and extreme price dislocations from market-making failures, as seen in early June when an ETF moved opposite to its underlying stock. The trading is predominantly driven by retail investors, with institutional capital largely absent due to the products' high volatility. Analysts caution that with the semiconductor sector at elevated valuations and facing geopolitical and supply chain uncertainties, leveraged ETFs pose a substantial threat of amplified losses for uninformed investors.

marsbit1h ago

Soaring Over Tenfold Within the Year: The Frenzy Over SK Hynix Leveraged Products

marsbit1h ago

18 Months, Over 50x Surge: KIOXIA's Epic Comeback

KIOXIA, a NAND flash memory giant, staged a dramatic comeback driven by AI demand. After a period of significant losses, a failed merger, and missed HBM opportunities, its 2024 IPO began modestly. However, fueled by explosive demand for AI data storage, its stock price skyrocketed over 50 times within 18 months, making it Japan's most valuable company, surpassing Toyota. Its Q1 FY2026 profit guidance soared 30-fold year-over-year, with 2026 NAND capacity already sold out. Key to its success is its 3D NAND technology, BiCS FLASH. As the inventor of NAND, KIOXIA advanced its technology through generations, reaching over 200 layers by 2023. Key innovations include CBA (CMOS directly Bonded to Array), which separately manufactures control circuits and memory arrays for better performance, and OPS (On Pitch Select Gate) to increase density. The company is now developing high-capacity packages like an 8TB solution stacking 32 dies. Looking beyond NAND, KIOXIA is exploring 3D DRAM with its OCTRAM technology, using oxide semiconductor transistors for ultra-low leakage to reduce power consumption. This fundamental research differs from HBM and represents a long-term bet to extend its 3D expertise from NAND into future DRAM architectures. KIOXIA's story highlights how technological assets and shifting market cycles can rapidly transform a company's fortunes. While questions remain about sustaining growth beyond the current AI boom, its resurgence demonstrates that in semiconductors, being down does not necessarily mean being out.

marsbit1h ago

18 Months, Over 50x Surge: KIOXIA's Epic Comeback

marsbit1h ago

Market Trends in U.S. Stocks (June 23): Peak at Listing? SpaceX Loses Over $800 Billion in Three Days, Tech Stocks Experience Severe Internal Divergence

Stock Market Trends (June 23): Did SpaceX Peak at IPO? The company loses over $800 billion in market value in three days as a sharp divergence unfolds within the tech sector. SpaceX's post-IPO decline of over 20%, falling below its first-day close, reflects a swift market repricing. The catalyst is a clear shift in narrative from "AI platform potential" to concerns over rising capital costs, as its $8.57 billion IPO and subsequent $20 billion debt offering are earmarked for acquisitions and refinancing existing bridge loans rather than de-leveraging. While high-valuation tech stocks like Google, Meta, Amazon, and Microsoft faced pressure, Micron surged nearly 7% to a record high following a strategic supply deal with Anthropic for HBM and memory, highlighting robust, tangible demand in AI infrastructure. The broader market saw funds rotate into more defensive industrial and financial names. Macro factors included a dip in oil prices to a three-month low on news of a US-Iran framework deal, though logistical hurdles for resuming full Strait of Hormuz shipments remain. Key events ahead include Nvidia's shareholder meeting, Micron's earnings, and the May PCE inflation data. The latter will be crucial in determining whether the sell-off in high-valuation growth stocks, which appears to have just begun, will persist.

marsbit1h ago

Market Trends in U.S. Stocks (June 23): Peak at Listing? SpaceX Loses Over $800 Billion in Three Days, Tech Stocks Experience Severe Internal Divergence

marsbit1h ago

Trading

Spot
Futures

Hot Articles

Discussions

Welcome to the HTX Community. Here, you can stay informed about the latest platform developments and gain access to professional market insights. Users' opinions on the price of SOL (SOL) are presented below.

活动图片