Polkadot Price Depreciates, Will The Bulls Be Able To Defend This Support Line?

newsbtcPublished on 2022-10-29Last updated on 2022-10-29

Abstract

Polkadot price has retraced on its chart over the last 24 hours. The coin has started to register sideways movement on its one-day chart. During this period, the coin lost close to 2% of its market value.

Polkadot price has retraced on its chart over the last 24 hours. The coin has started to register sideways movement on its one-day chart. During this period, the coin lost close to 2% of its market value.

In the last week, DOT registered more than 6% appreciation, which caused the bulls to gain stamina and break past the consolidation phase.

The technical outlook for the coin remained positive; however, the indicators indicated that the bullish momentum was fading off the charts.

Bitcoin also retraced slightly on its chart. Many altcoins have also started to trade sideways following BTC’s price action.

Bulls for Polkadot price can make a comeback if the coin manages to push above the $6.70 price mark. Consistent lateral trading can cause the altcoin to dip further on its chart.

It is important that Polkadot price remains above its local support level of $6.30. If the coin loses that support line, then there could be a further downfall.

The broader market continues to show mixed trading signals, with some coins losing strength while the likes of Dogecoin and Shiba Inu gain further bullish momentum.

Polkadot Price Analysis: One-Day Chart

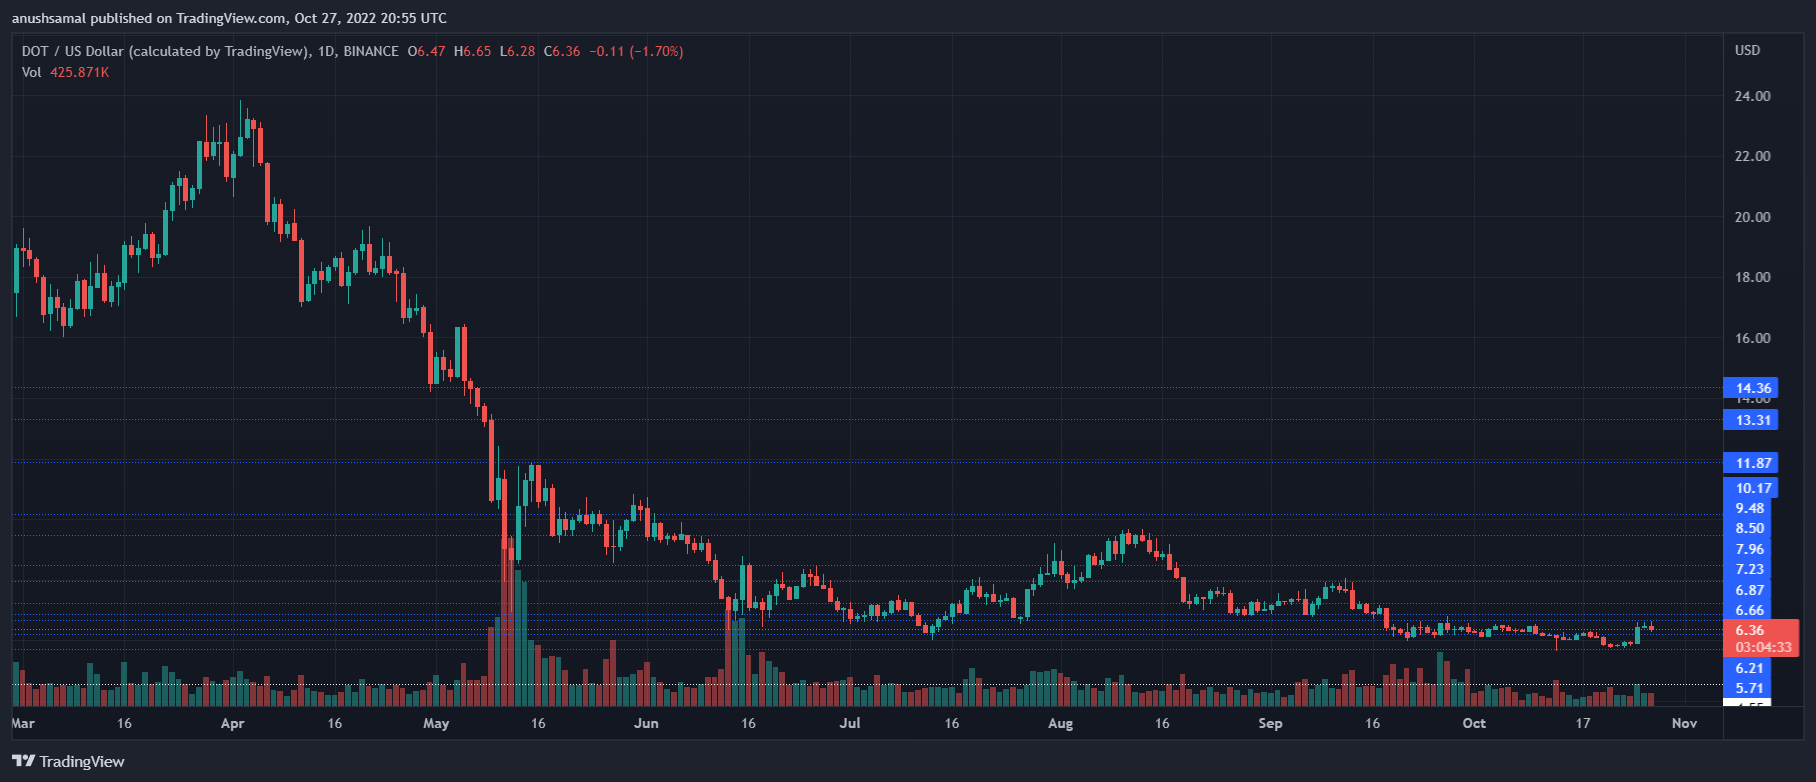
DOT was trading at $6.36 at the time of writing.

The altcoin had witnessed weeks of price consolidation until Bitcoin finally registered bullish price action.

Even though Polkadot’s bulls pushed hard to break past the $6 price mark, the coin has seemed to lose its bullish strength.

Immediate resistance for Polkadot stands at $6.70. Moving above that level can help DOT to trade closer to the $7 price mark.

That level can help the coin claim the bulls back again.

The closest support line that Polkadot has to defend is at $6.30. Losing this line will drag the price of the altcoin to $5.80. The amount of Polkadot traded in the last session fell slightly, indicating that selling pressure increased.

Technical Analysis

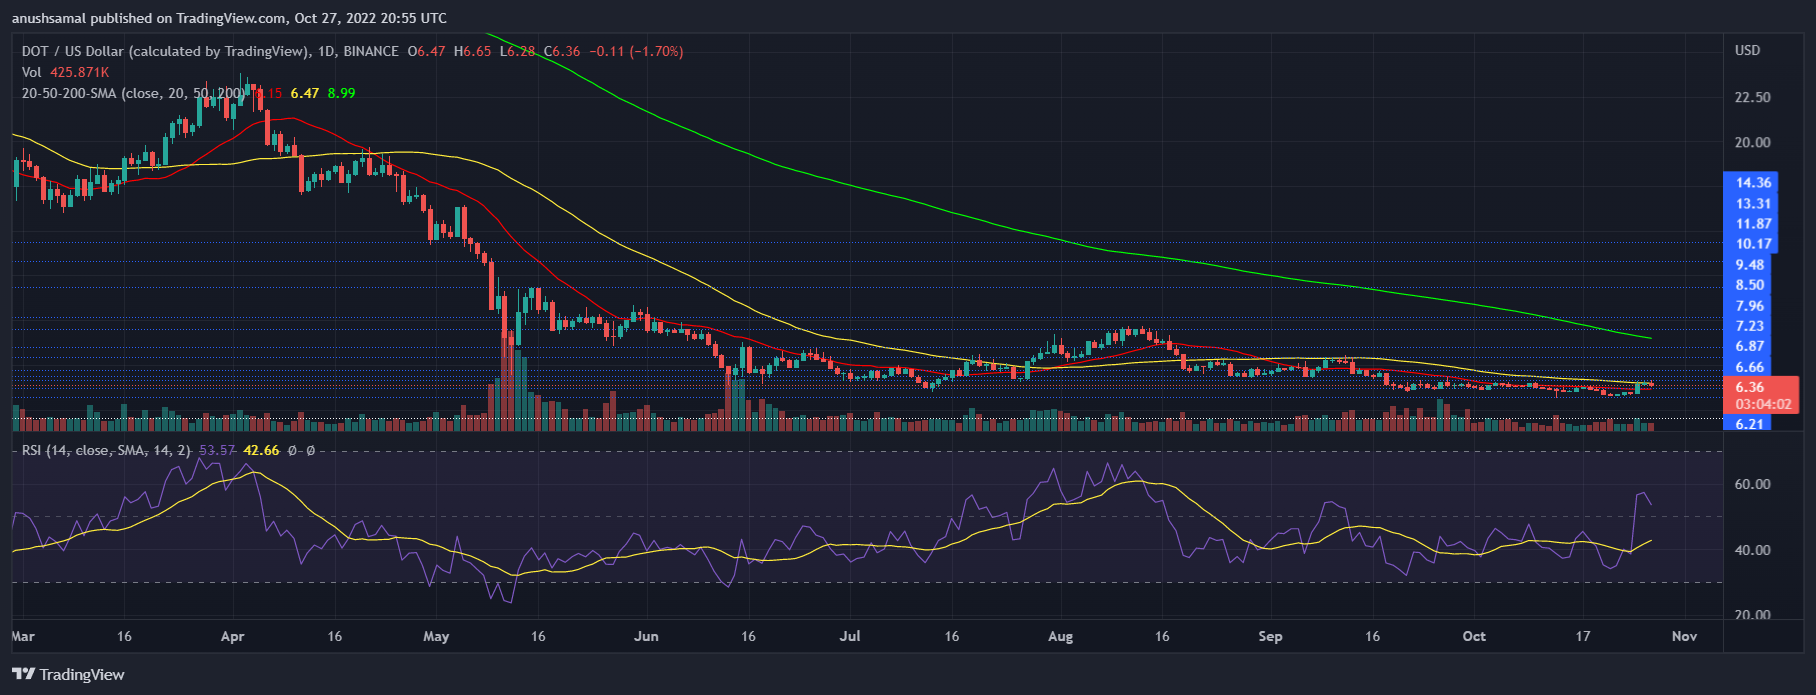
The altcoin swiftly moved into the positive buying zone as soon as it gained its value. However, at press time, it registered a downtick in buying pressure.

The Relative Strength Index was above the half-line but it displayed a downward movement, indicating a fall in buyers and demand for the altcoin.

Polkadot price was also moving below the 20-SMA line, indicating that demand was declining and that sellers were driving price momentum.

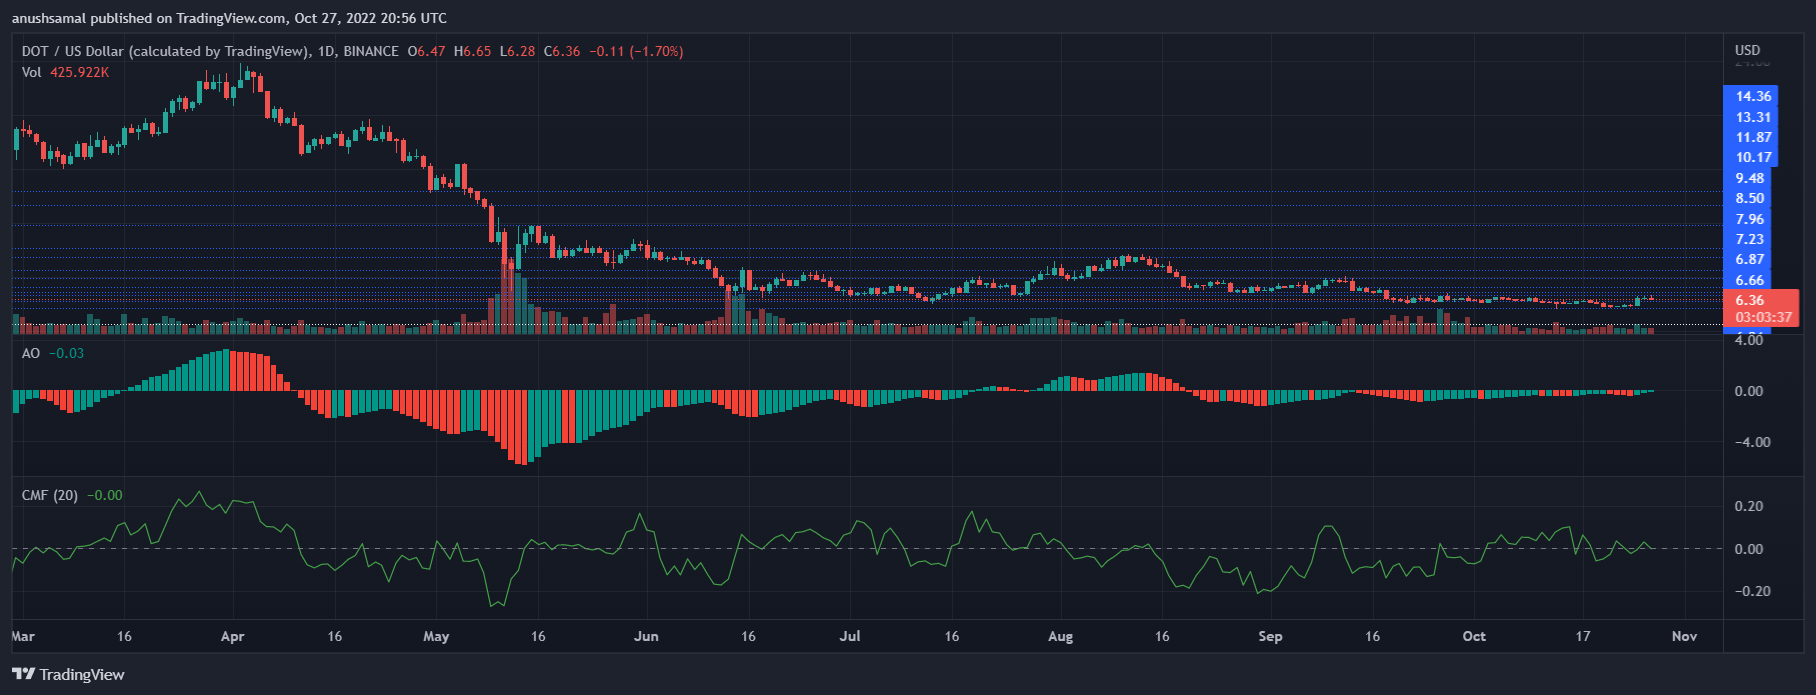
Other technical indicators also indicated that the bulls were slowly fading out of the market. The Awesome Oscillator depicts the price momentum, it formed green histograms under the half-line.

This formation meant that the coin was about to witness a further fall in price.

The Chaikin Money Flow accounts for the capital inflows and outflows of the asset.

The indicator was on the half-line with a downtick, signifying that capital inflows declined over the last 24 hours.

Trending Cryptos

Related Reads

Report Interpretation: J.P. Morgan Details Micron's Pre-Earnings Sentiment, Current Hardware Sector Dynamics

Morgan Stanley analyst Joshua Meyers' report (June 21, 2026) highlights key trends in the hardware and semiconductor sector ahead of Micron's earnings. The core takeaways are: 1. **Micron & Memory:** Memory remains a high-conviction long theme, driven by strong AI demand and rising ASPs. However, investor focus is shifting to the sustainability of Micron's >80% gross margins and the specifics of potential new long-term supply agreements (SCAs). 2. **Hardware Supply Chain:** AI-related demand for servers, networking, and storage remains robust, but company performance is diverging. Celestica (CLS) shows improved margin confidence, Western Digital and Seagate benefit from pricing, Fabrinet (FN) sees predictable AI optics growth, and Teradyne (TER) anticipates a new Google customer. 3. **AI Capex & WFE Forecasts:** JPMorgan increased its Wafer Fab Equipment (WFE) market growth forecasts to 28% in 2026 and 29% in 2027. AI infrastructure financing is evolving, with higher project-level debt reducing constraints on capex expansion. The report signals that while the AI-driven hardware cycle is strong, the market is entering a phase focused on execution verification (e.g., Micron's SCA details, Fabrinet's ramp with Amazon) and valuation sustainability. Key near-term signals include Micron's guidance, Arista Networks' outlook, and the pace of demand normalization post potential tariff-related pull-ins.

marsbit1h ago

Report Interpretation: J.P. Morgan Details Micron's Pre-Earnings Sentiment, Current Hardware Sector Dynamics

marsbit1h ago

Research Report Analysis: The Fed's New Chair's Debut – New Leader, But Same Script?

Report Analysis: Federal Reserve's New Chair Debut – A New Captain, But the Same Script? Morgan Stanley's chief global economist Seth B. Carpenter analyzes the first FOMC meeting under new Fed Chair Kevin Warsh in a June 21 report. Warsh deliberately avoided providing forward guidance on interest rates, aligning with his philosophy. However, market expectations for a rate hike this year were reinforced. Key signals lie elsewhere: inflation may fall more than expected, and quantitative tightening (QT) could be more aggressive than anticipated. The FOMC's "dot plot" suggests only one rate hike in 2026. Carpenter argues that if inflation undershoots forecasts, the logic for even a single hike weakens, especially as projections indicate potential rate cuts in 2027. On QT, Warsh's stance is clear. Carpenter notes that measures like halving the Treasury's account balance could shrink the Fed's balance sheet by around $500 billion with minimal market impact. Combined with adjustments to reserve interest and liquidity rules, the ultimate QT scale may exceed expectations, though its market effect might be less disruptive unless the Fed actively sells Mortgage-Backed Securities (MBS). While Warsh initiated a review of the Fed's policy framework, the 2% inflation target remains intact for now. The report concludes that the market may be overestimating the significance of reduced forward guidance and the near-term rate hike risk, while potentially underestimating the scope and manageable nature of the coming balance sheet reduction. The key debates will hinge on upcoming core PCE data, the specifics of the QT path, and the framework review's findings.

marsbit2h ago

Research Report Analysis: The Fed's New Chair's Debut – New Leader, But Same Script?

marsbit2h ago

Critical Game Week: BTC Retracement Confirmation vs. HYPE Support Battle | Guest Analysis

This weekly analysis outlines a critical juncture for BTC and HYPE markets, focusing on key price level confirmations. **BTC Analysis:** BTC is at a pivotal point after a five-wave rally from the June 5th low of $59,100. The price has broken below a short-term rising channel's lower boundary, with the current move seen as a pullback to test this breakdown. Failure to reclaim this level could lead to a retest of the $59,000-$60,000 support zone. The core scenario hinges on this channel retest outcome. * **Key Levels:** Resistance at $64,500-$65,000 (channel boundary) and $69,500-$70,500. Support at $59,000-$60,000 and $55,000. * **Strategy:** A core bearish stance is maintained (20% short from last week), with short-term plans for tactical trades. Three detailed contingency plans (A/B/C) are provided for short positions on resistance tests or breakdowns, emphasizing strict stop-loss discipline. **HYPE Analysis:** HYPE shows strong momentum but is currently in a corrective phase after hitting a new high of $76.94. The price is retesting the crucial $64-$66 support area. * **Key Levels:** Resistance near $77 and $80-$82. Support at $64-$66 and $52-$54. * **Strategy:** The short-term approach is "buy on dips, avoid chasing rallies." A long position is considered only if clear stabilization signals appear at the $64-$66 or deeper $52-$54 support zones, with tight risk controls. **General Risk Management:** A standardized trailing stop-loss protocol is emphasized: set initial stop, breakeven at +1% profit, then trail stops upward to lock in gains. *Disclaimer: All analysis is presented as a personal trading framework, not investment advice. Market conditions are complex and require dynamic adjustment.*

marsbit2h ago

Critical Game Week: BTC Retracement Confirmation vs. HYPE Support Battle | Guest Analysis

marsbit2h ago

Research Report Interpretation: Citi Attends AWS Summit, Bullish on Cloud Business Acceleration but Data Governance Remains Key Variable

Citi analyst Tyler Radke's team attended the AWS New York Summit (June 17-18), engaging with over 10 clients and partners. In a June 19 report, they highlighted the summit's focus on scaling agent AI for enterprise deployment. Citi maintains a "Buy" rating on Amazon, forecasting AWS revenue growth to accelerate to 37% in FY27 from 30% in FY26, noting this estimate may be conservative. Key takeaways: 1. **AWS Strategy Shift:** AWS is moving from proof-of-concepts to scalable deployment. New offerings like AWS Context (building enterprise knowledge graphs), Amazon Quick (cross-application AI assistant), and security tool Continuum address core enterprise pain points for AI adoption. 2. **Data Infrastructure Beneficiaries:** Data infrastructure companies like Snowflake, Elastic, Oracle, and ClickHouse are seen as direct beneficiaries of scaling AI workloads, as evidenced by strong growth and use cases presented. 3. **Critical Role of Data Governance:** As AI agents scale from hundreds to thousands, effective data governance becomes the key variable for deploying AI in core business processes. AWS Context represents AWS's strategic extension from providing compute/models to offering a data governance infrastructure layer. The report emphasizes that without solving data governance, AI will remain confined to pilot projects. The investment thesis focuses on AWS revenue acceleration and data infrastructure vendors' growth, while monitoring signals like AWS's quarterly revenue growth, Bedrock AgentCore task volume, and pricing impacts on companies like Elastic.

marsbit2h ago

Research Report Interpretation: Citi Attends AWS Summit, Bullish on Cloud Business Acceleration but Data Governance Remains Key Variable

marsbit2h ago

Trading

Spot
Futures

Hot Articles

How to Buy DOT

Welcome to HTX.com! We've made purchasing Polkadot (DOT) simple and convenient. Follow our step-by-step guide to embark on your crypto journey.Step 1: Create Your HTX AccountUse your email or phone number to sign up for a free account on HTX. Experience a hassle-free registration journey and unlock all features.Get My AccountStep 2: Go to Buy Crypto and Choose Your Payment MethodCredit/Debit Card: Use your Visa or Mastercard to buy Polkadot (DOT) instantly.Balance: Use funds from your HTX account balance to trade seamlessly.Third Parties: We've added popular payment methods such as Google Pay and Apple Pay to enhance convenience.P2P: Trade directly with other users on HTX.Over-the-Counter (OTC): We offer tailor-made services and competitive exchange rates for traders.Step 3: Store Your Polkadot (DOT)After purchasing your Polkadot (DOT), store it in your HTX account. Alternatively, you can send it elsewhere via blockchain transfer or use it to trade other cryptocurrencies.Step 4: Trade Polkadot (DOT)Easily trade Polkadot (DOT) on HTX's spot market. Simply access your account, select your trading pair, execute your trades, and monitor in real-time. We offer a user-friendly experience for both beginners and seasoned traders.

5.4k Total ViewsPublished 2024.03.29Updated 2026.06.02

How to Buy DOT

Discussions

Welcome to the HTX Community. Here, you can stay informed about the latest platform developments and gain access to professional market insights. Users' opinions on the price of DOT (DOT) are presented below.

活动图片