Key data
- The number of ERC-20 tokens created in the Ethereum network in September increased by 6.4%.
- Average number of Ethereum blocks per day increased by 5.3%.
- The number of blocks per day has increased by almost 17% after the merge of Ethereum.
- Average Ethereum gas price decreased by seven percent in September.
- The average number of unique active crypto wallets per day, as well as the average number of daily active smart contracts, decreased by 2.7% and 4.6% respectively.
- The average number of Ethereum transactions per day decreased insignificantly in September.
Ethereum activity index
Ethereum activity index shows the activity of users on the Ethereum (ETH) network. It is calculated automatically based on a combination of several factors, such as active wallets on the network, gas used and transaction statistics.
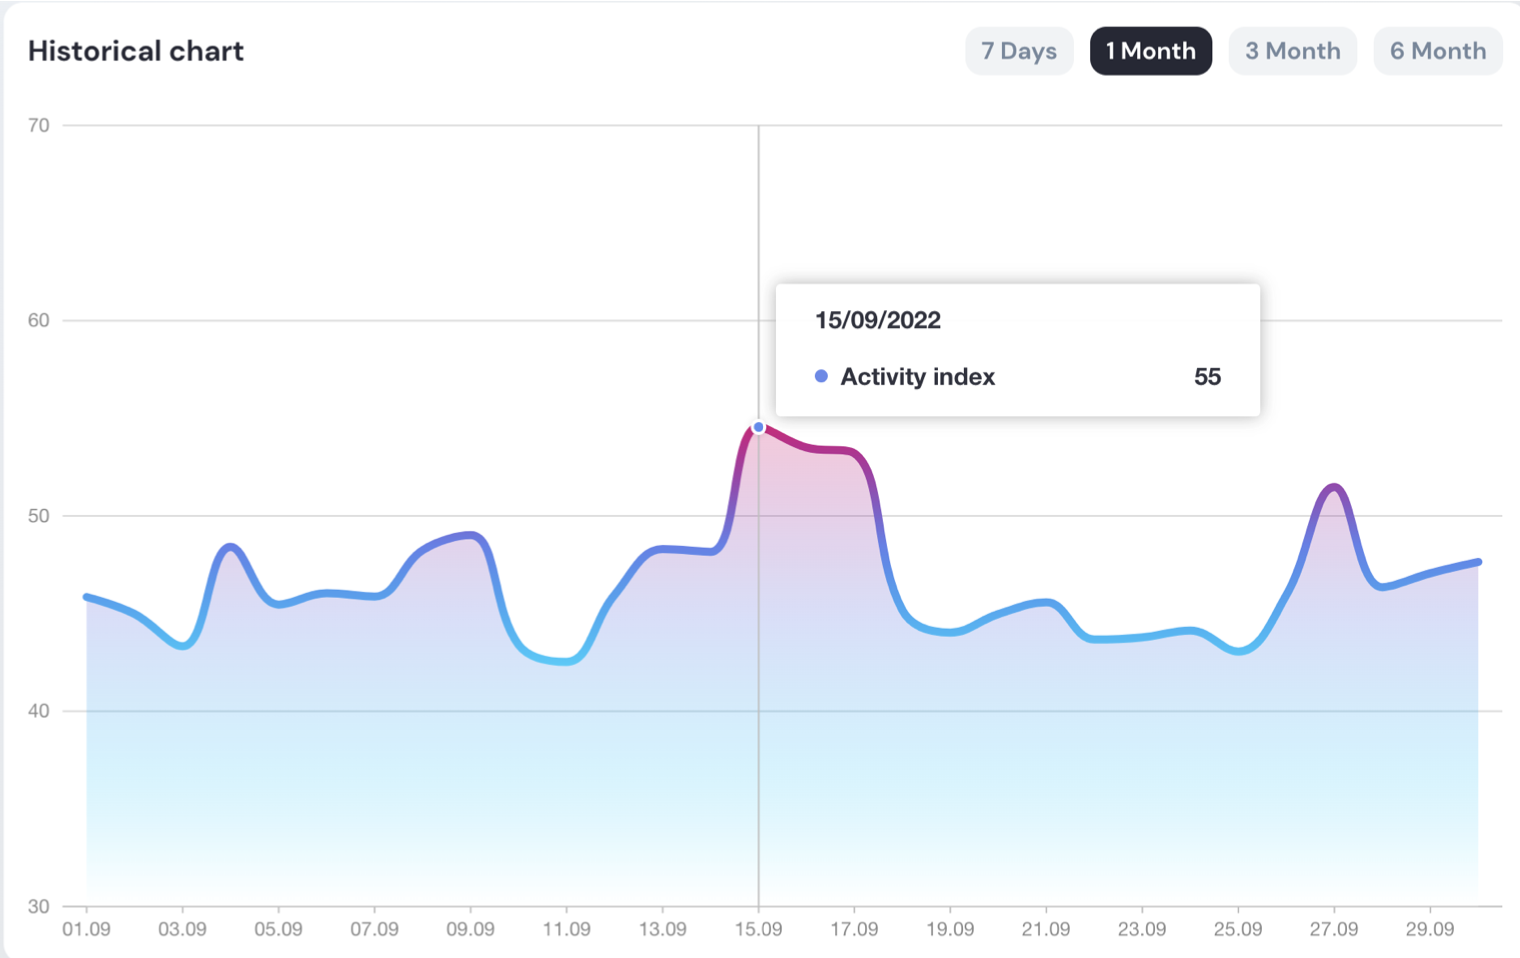
ETH activity index – historical chart
The average indicator practically did not change in comparison with August. In September, the index showed an average of 48 points.
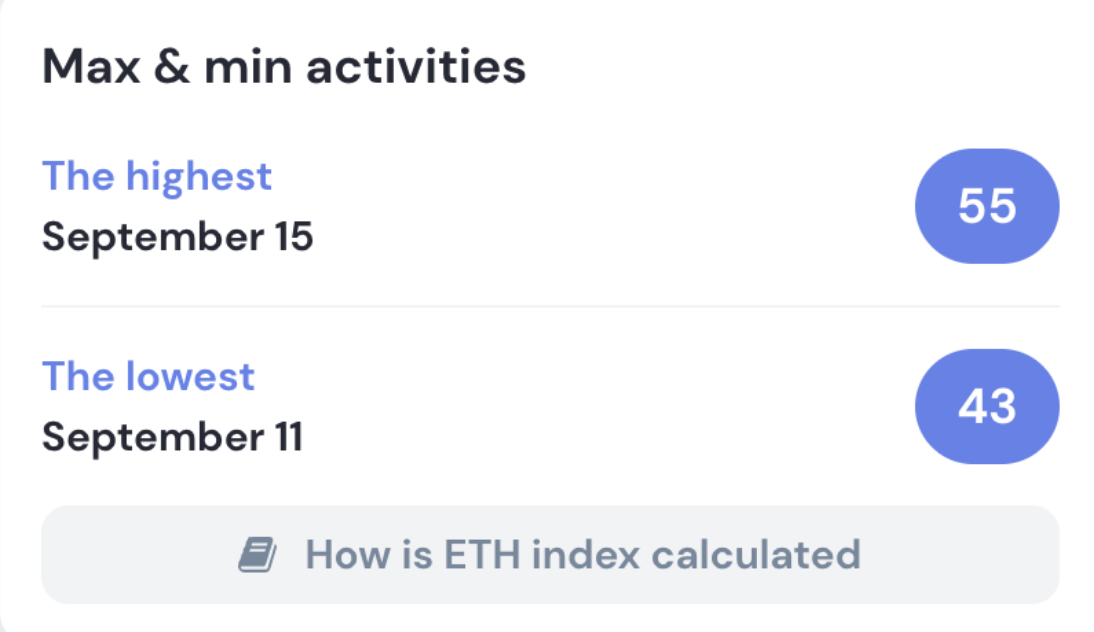
ETH activity index – minimum and maximum values
The minimum value was observed on September 11, 2022, and 43 points.
The maximum value was observed on September 15, 2022, and amounted to 55 points.
The peak value of network activity was reached on September 15, 2022, as on this day the merger of Ethereum was completed, and it switched to a proof-of-stake consensus system.
Ethereum transaction statistics
- Average number of Ethereum transactions per day decreased insignificantly
The number of Ethereum transactions in August was 34,908,242 with average daily volume of 1,126,072 transactions. In September, the total number of Ethereum transactions was 33,741,733 with average daily volume of 1,124,724 transactions.
Compared to August, the average number of transactions per day in September decreased by only 0.1% reflecting the market’s waiting position. The chart below shows that the number of transactions in August and September almost completely coincide with the same values in April and May of the current year.
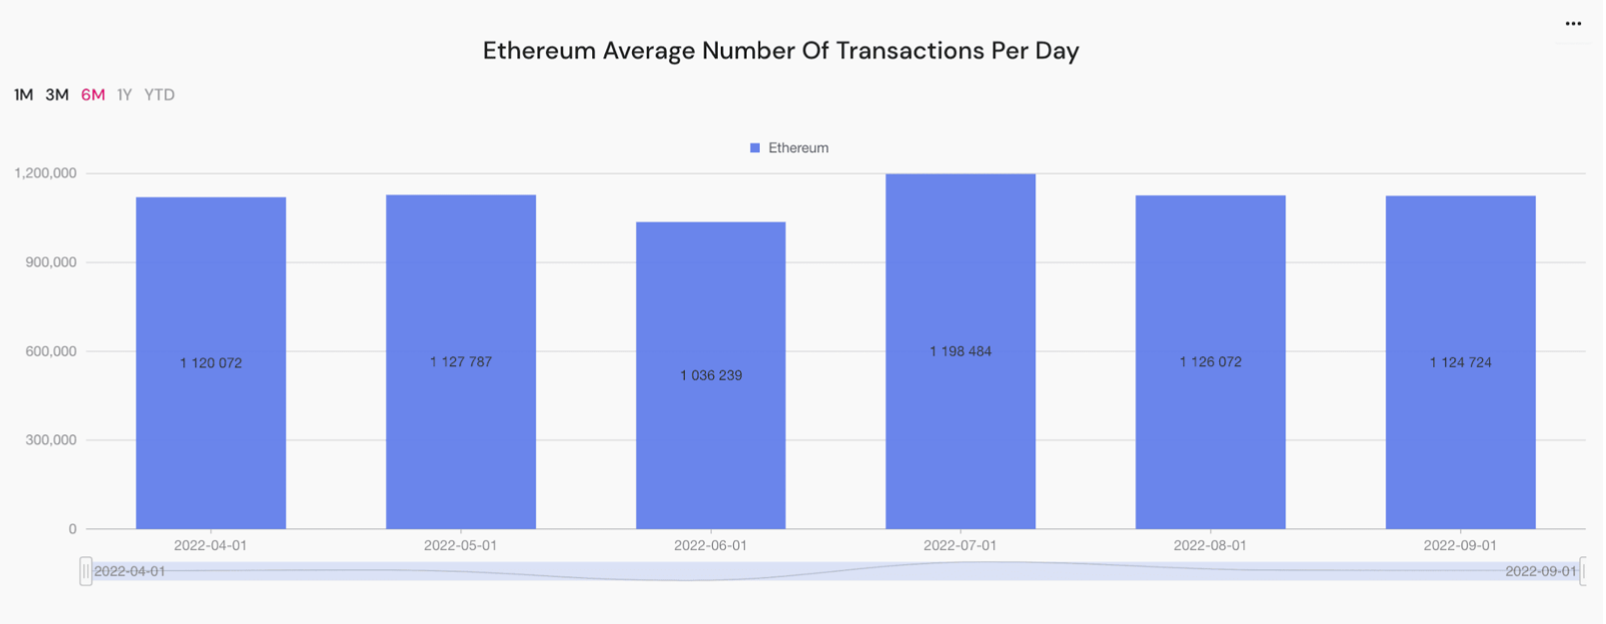
ETH average number of transactions per day
The highest average number of transactions in September was made on the 15th, 16th and 17th, with a peak of 1,322,077 transactions. Such activity is associated with the transition of Ethereum to the proof-of-stake system and the activity of traders.
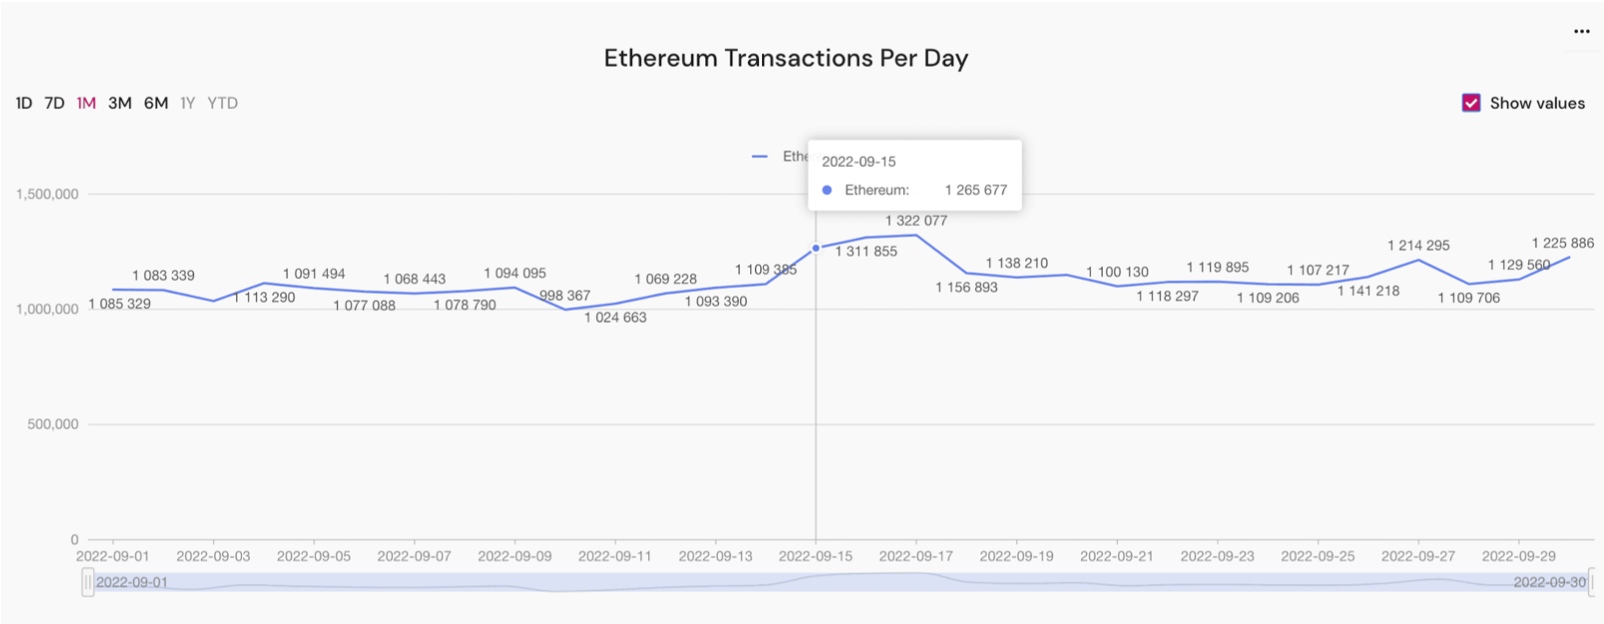
ETH transactions peak – September 2022
Ethereum block statistics
- Average number of Ethereum blocks per day increased by 5.3%.
- The number of blocks per day has increased by almost 17% after the merge of Ethereum.
In September, the “Ethereum average number of blocks per day” chart shows an increase of 5.3% in the average number of blocks per day. The average number of Ethereum blocks per day in August was 6,332, and the average number of Ethereum blocks in September was 6,665.
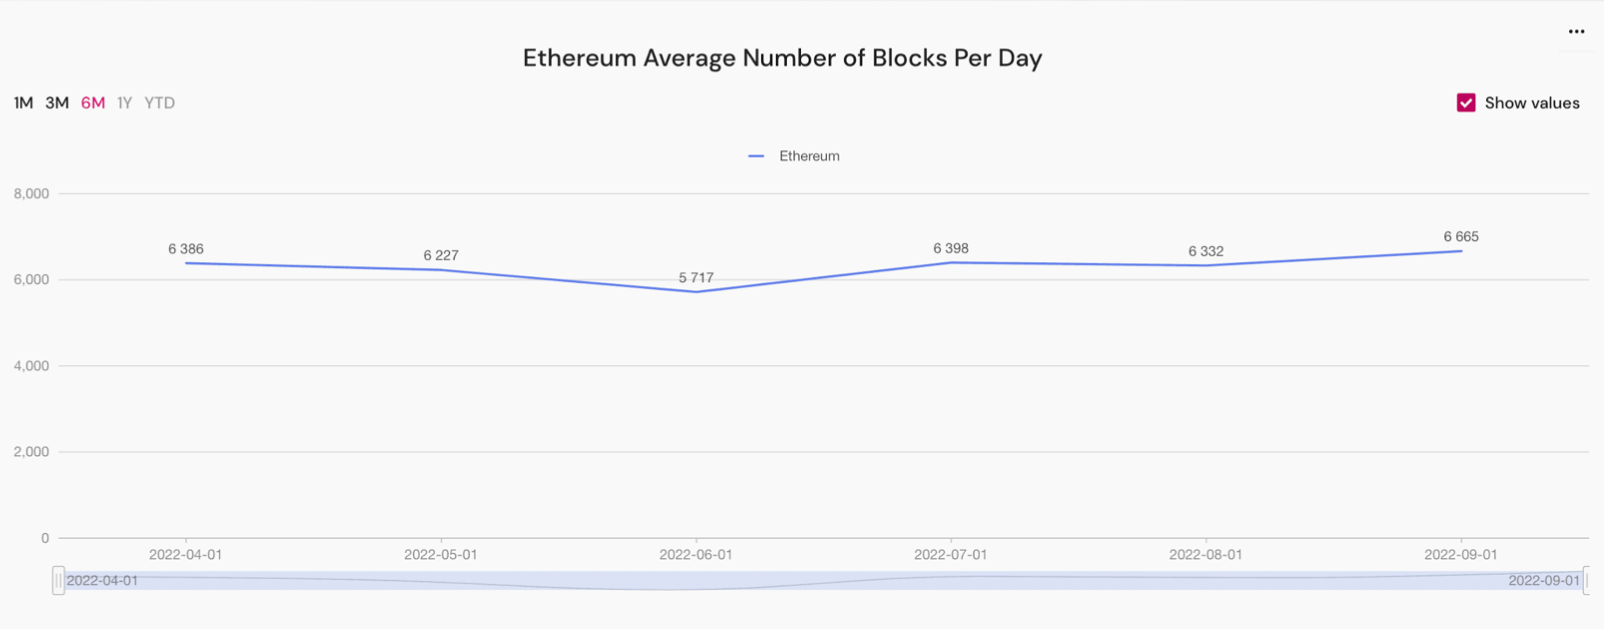
ETH average number of blocks per day in September 2022
At the same time, the number of blocks per day increased significantly on September 15, 2022, after the transition of Ethereum to the proof-of-stake system. This can be clearly seen in the chart below.
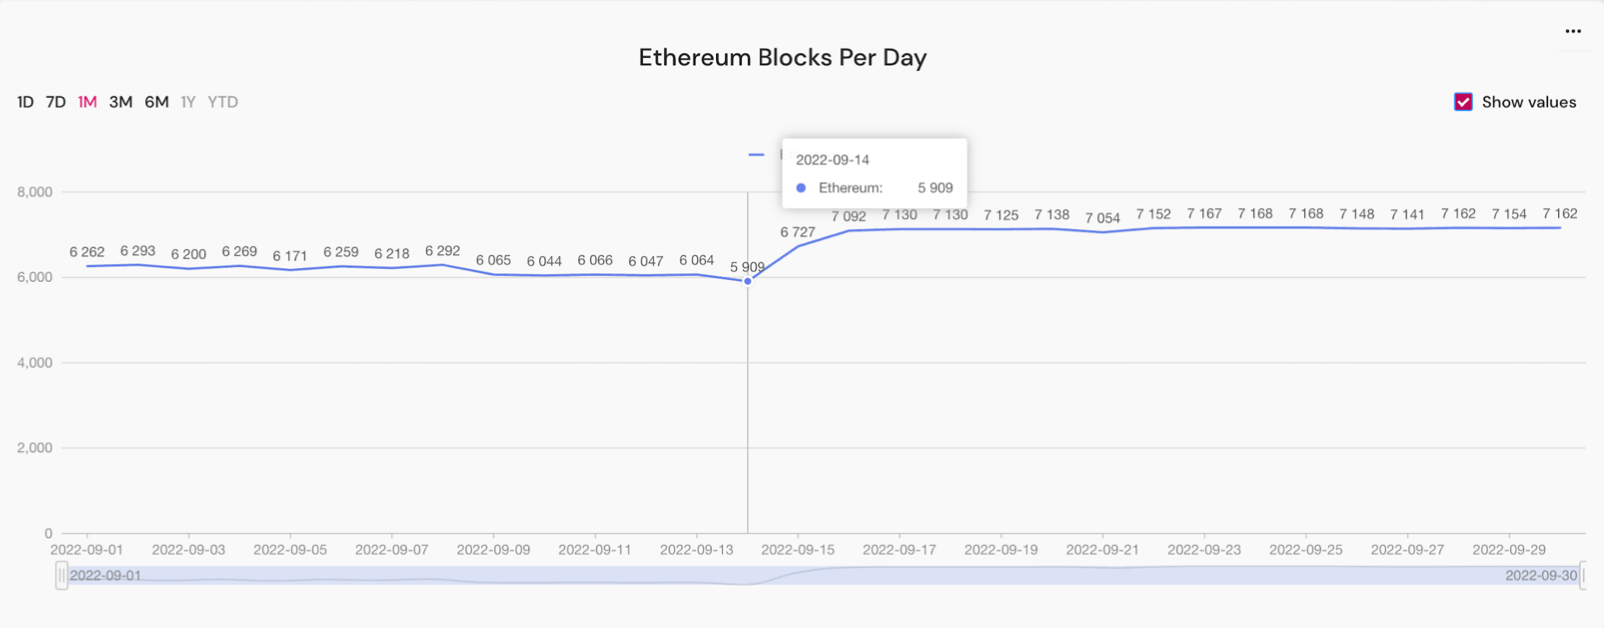
ETH blocks per day in September 2022
In September, the average block size was 0.49 Gb. In August, this value was 0.51 Gb. The average size of blocks mined per day is continuing to decline.
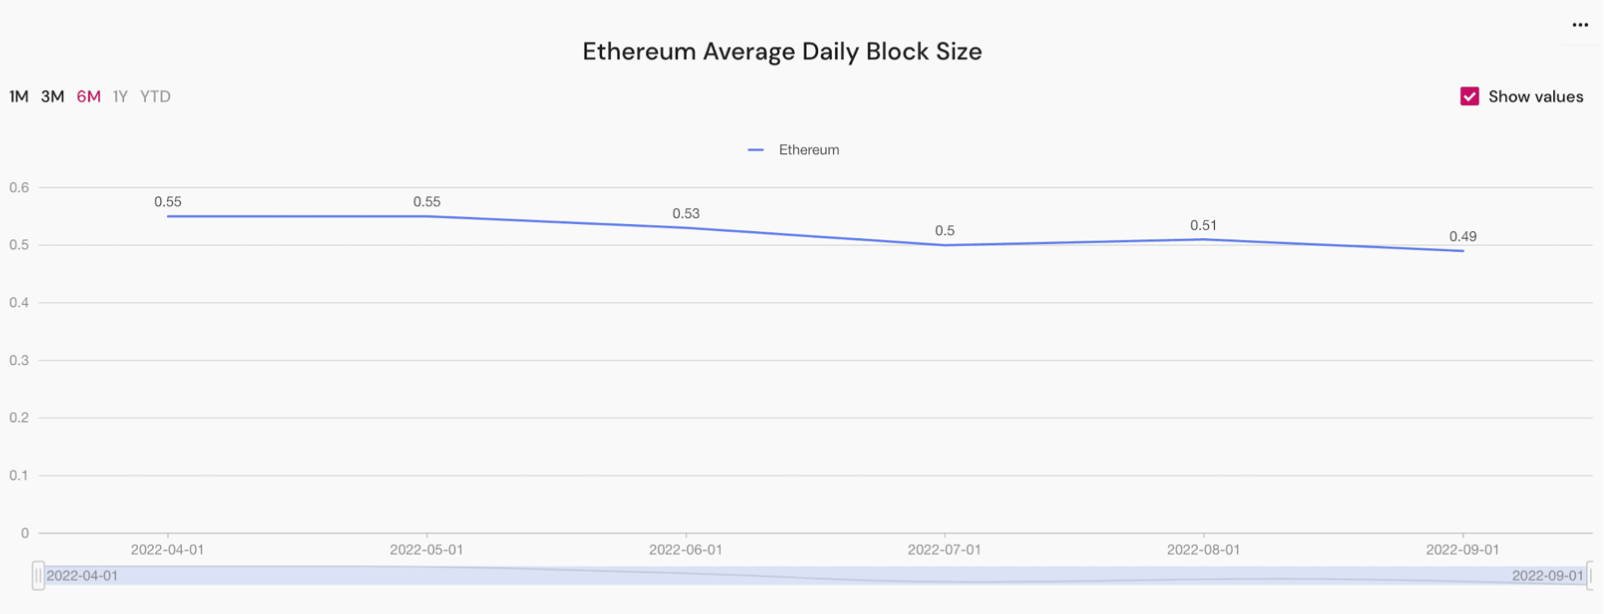
ETH average daily block size
The “ETH total block size per month” Gb chart shows that the total block size in September was 14.6 Gb, and in August, it was 15.7 Gb. The value has decreased by 7.8%.
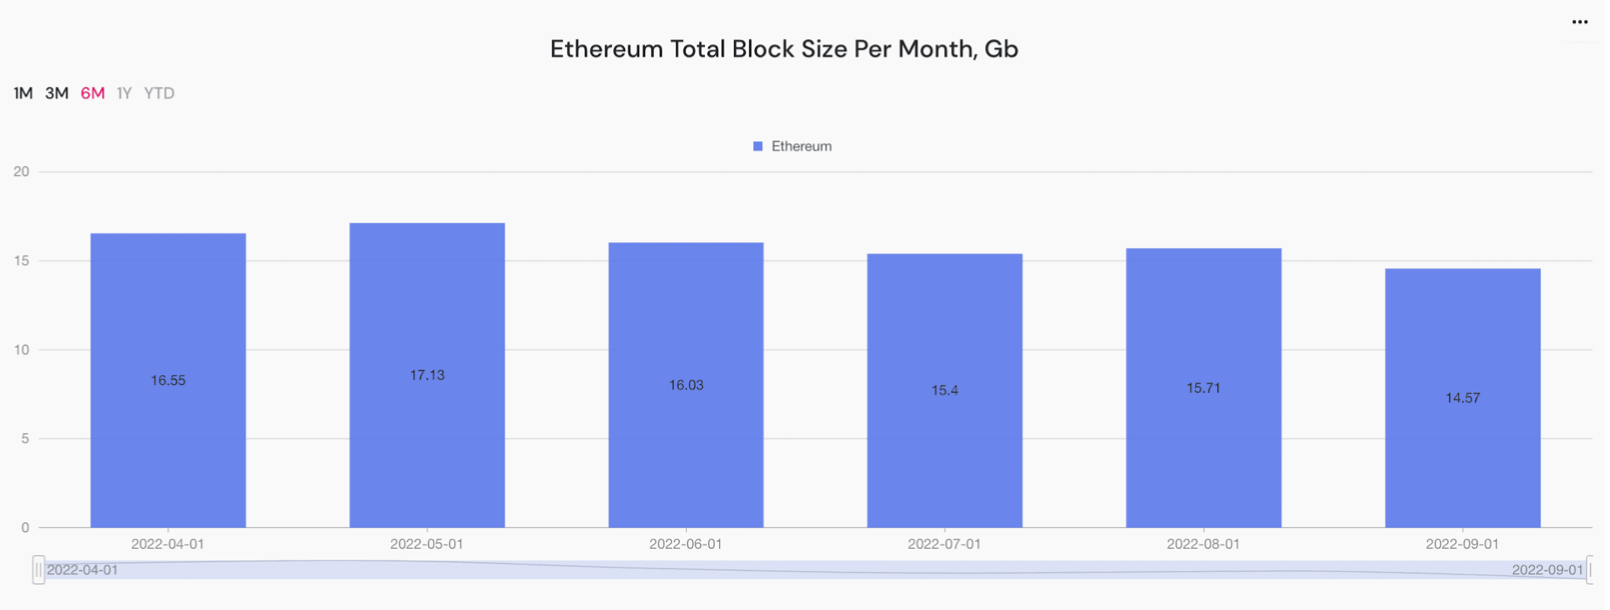
ETH total block size per month
Ethereum gas prices statistics
- Average Ethereum gas price decreased by seven percent in September.
In September, the average Ethereum gas price was 17.12 gwei. In August, it was 18.31 gwei. The gas price decreased by seven percent.
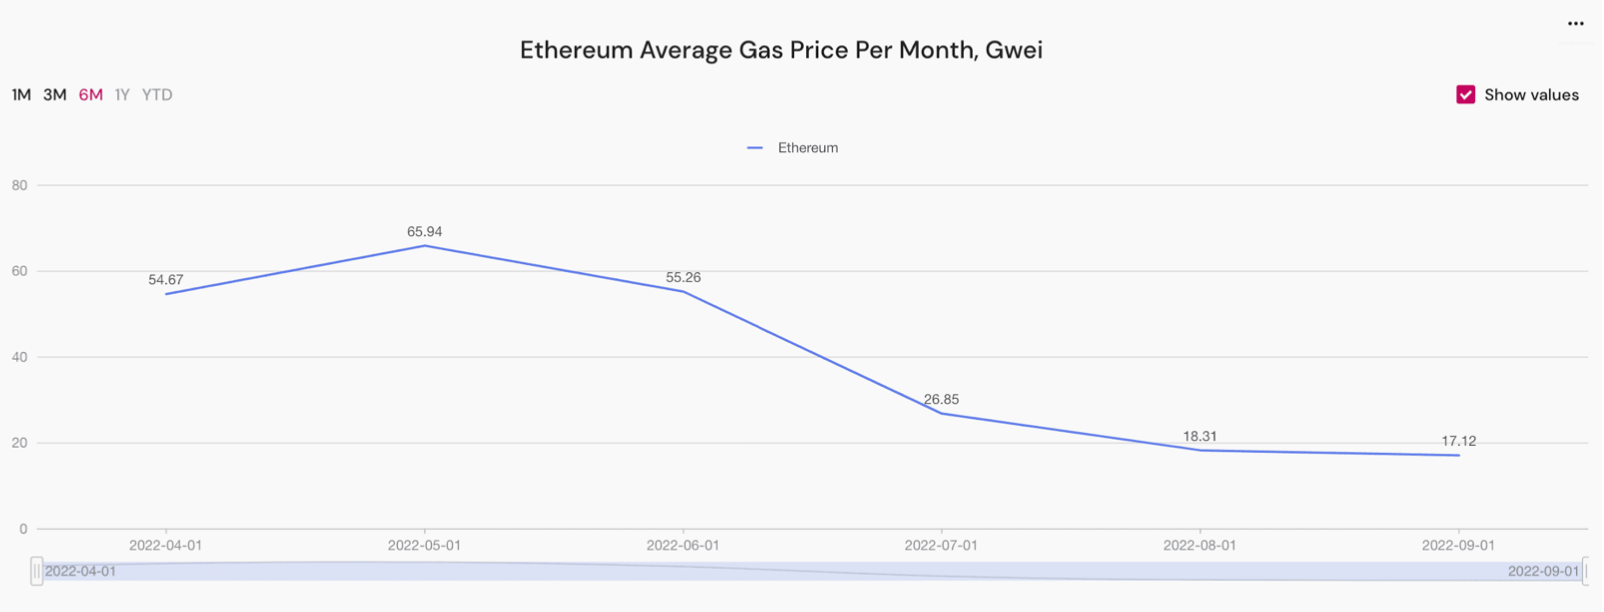
ETH average gas price per month
In September, the price of gas continued to decline and broke the August low. The minimum value of the gas price in September was recorded on the 17th and was 8.9 gwei. This is the lowest recorded price of gas in the last six months. The minimum value was recorded on the 8th and was 27.02 gwei.
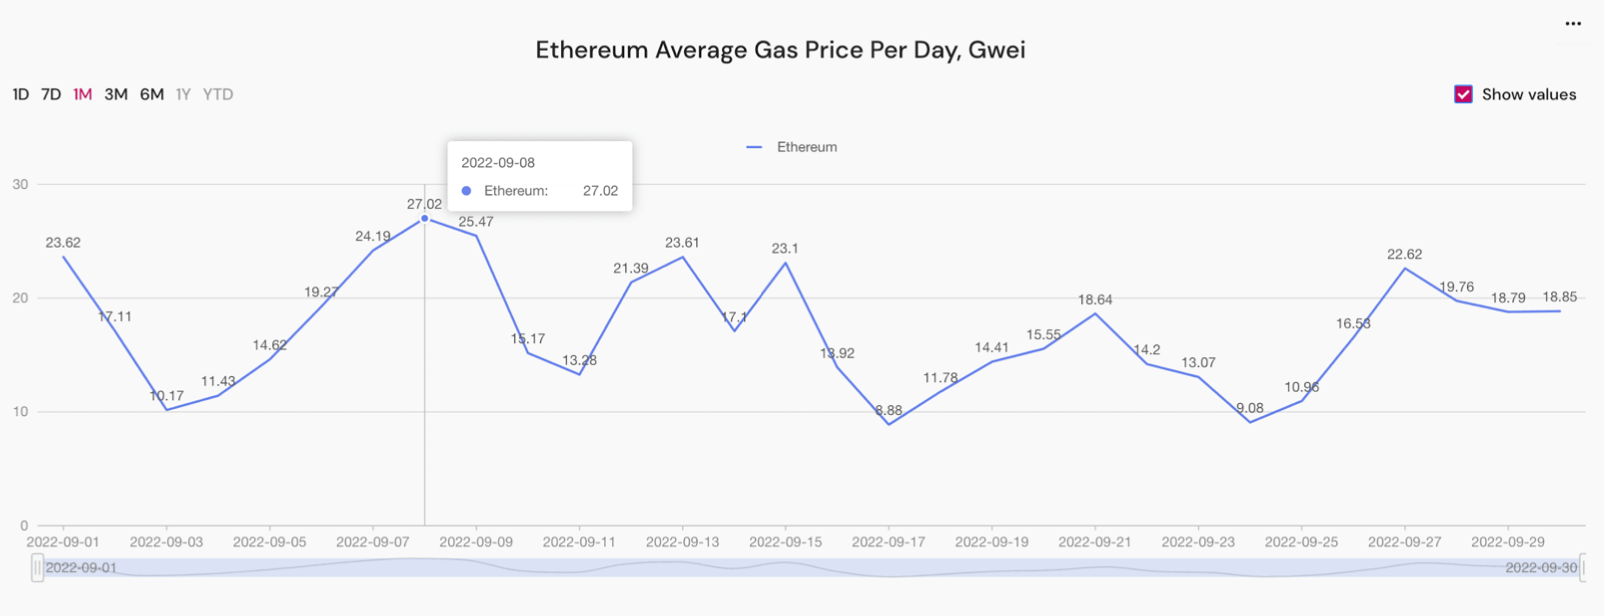
ETH average gas price per day in July–August 2022
Ethereum new smart contracts statistics
- The number of ERC-20 tokens created in the Ethereum network in September increased by 6.5%.
The number of ERC-20 tokens created on the Ethereum network in August was 10,066. In September, this figure was 10,714. It increased by 6.5%.
Ethereum active addresses statistics
- In September, the average number of unique active crypto wallets per day – as well as the average number of daily active smart contracts – decreased by 2.7% and 4.6% respectively.
In September, the average number of unique active crypto wallets per day in the Ethereum blockchain was 465,072. In August, this figure was 477,678, so it is a decrease of 2.7%.
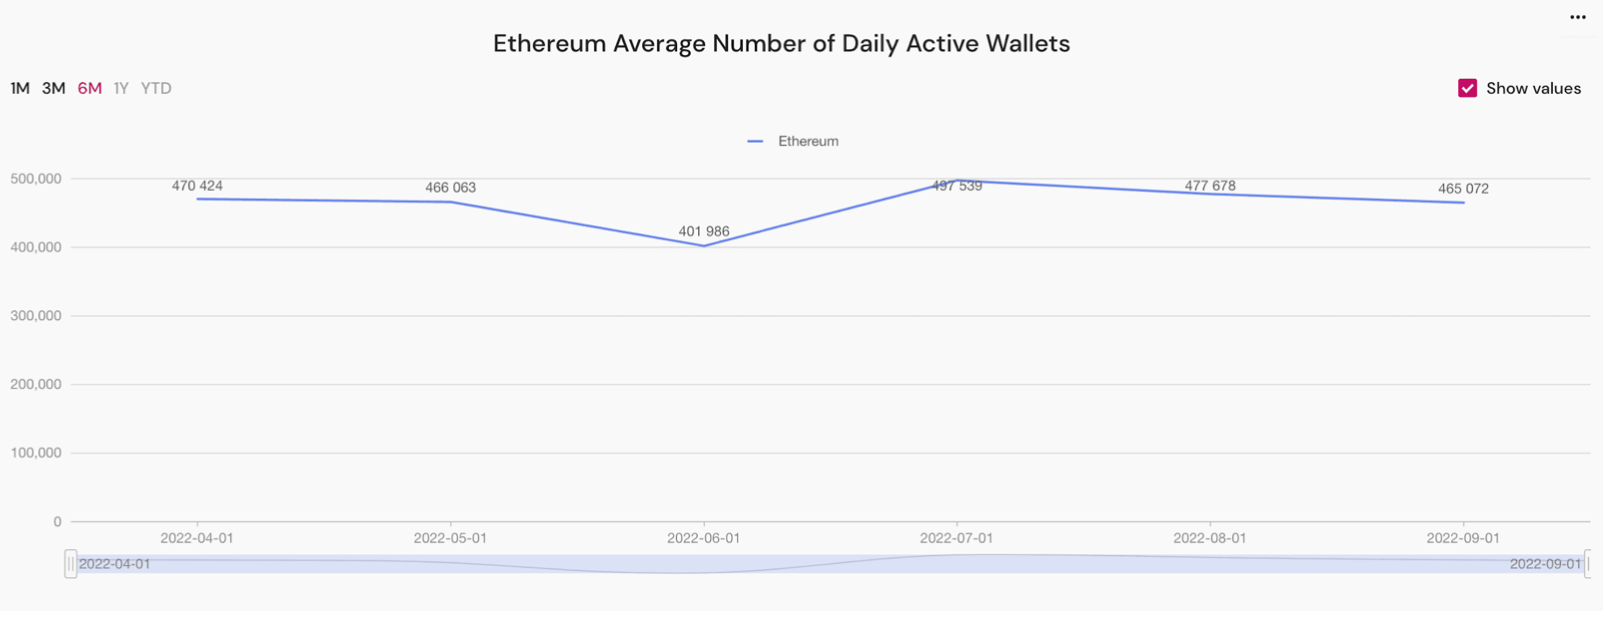
ETH average number of daily active wallets
A similar situation is observed with the average number of daily active smart contracts. This value in August was 26,450. It decreased by 4.6% and was 25,294 in September.
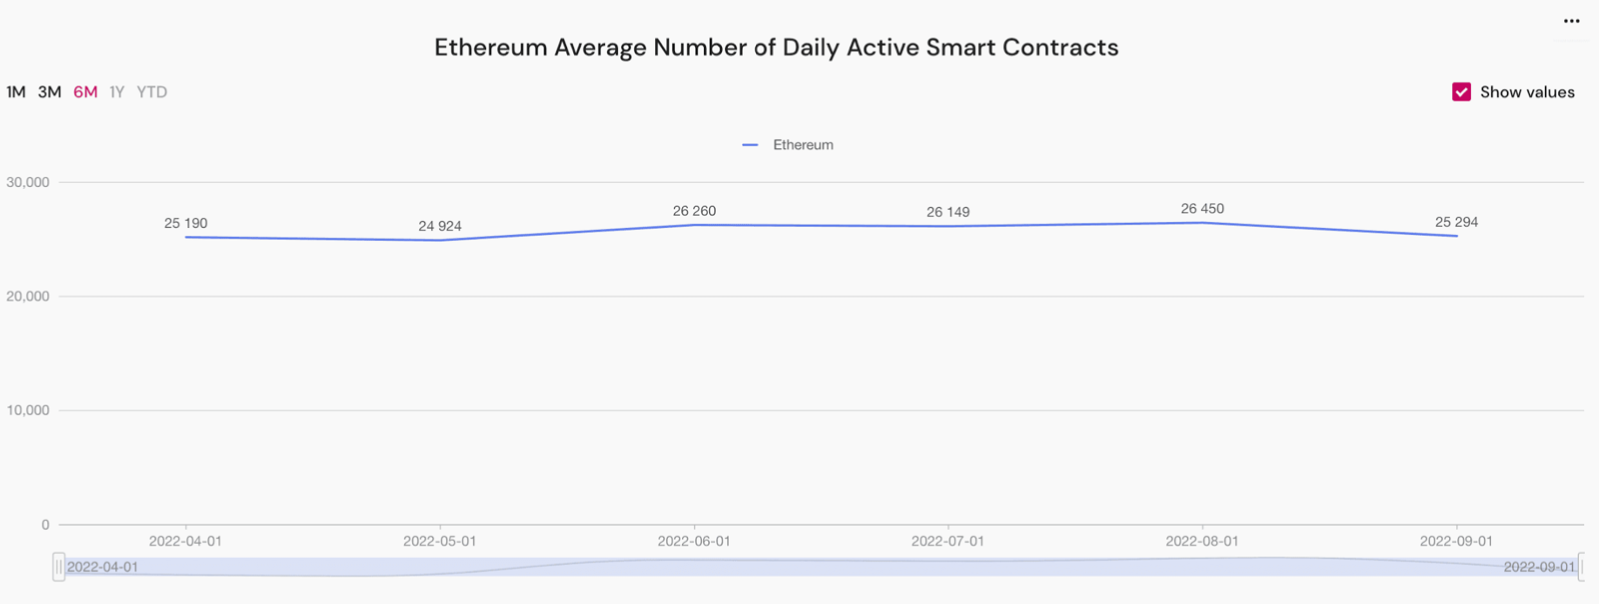
ETH average number of daily active smart contracts
Data-driven conclusions
September is consistently considered to be the worst month for the cryptocurrency market, which is confirmed by the data, since almost all indicators – from the number of transactions, to active crypto wallets – have slightly decreased.
At the same time, on September 15, 2022, Ethereum merged and switched to the proof-of-stake system, so there was an increase in user activity – but even such a major event could not reverse the general trend of decreasing network activity from month to month.