Why Bitcoin Could Be About to Pump if This Signal is Right - US CPI Explained

CryptonewsPublished on 2022-09-14Last updated on 2022-09-14

Abstract

The leading cryptocurrency, Bitcoin, suffered a massive drop, losing more than 12% to $19,850 amid stronger-than-expected US CPI figures.

Why Bitcoin Could Be About to Pump if This Signal is Right - US CPI Explained

The leading cryptocurrency, Bitcoin, suffered a massive drop, losing more than 12% to $19,850 amid stronger-than-expected US CPI figures. Before the news release, technical indicators, particularly the 100-day moving average (MA), indicated the possibility of a bullish trend continuation. However, the BTC/USD has fallen below the moving average, resulting in a significant drop. 
In this update, I will discuss the fundamentals that drove a sharp sell-off in Bitcoin and the technical outlook that suggests Bitcoin may be about to pump if the signal is right.
US Inflation at 8.3% in August 
The Bureau of Labor Statistics released one of the most anticipated data sets, the Consumer Price Index (CPI) and Core CPI, during the US session. Both figures outperformed the previous month's release, fueling a strong rise in dollar demand. 
Consumer prices rose 0.1% month on month, following a flat reading in July and falling short of a 0.1% reduction estimate. The US CPI index was 296.17 points in August, compared to 296.28 points the previous month and 295.53 points expected by the market.

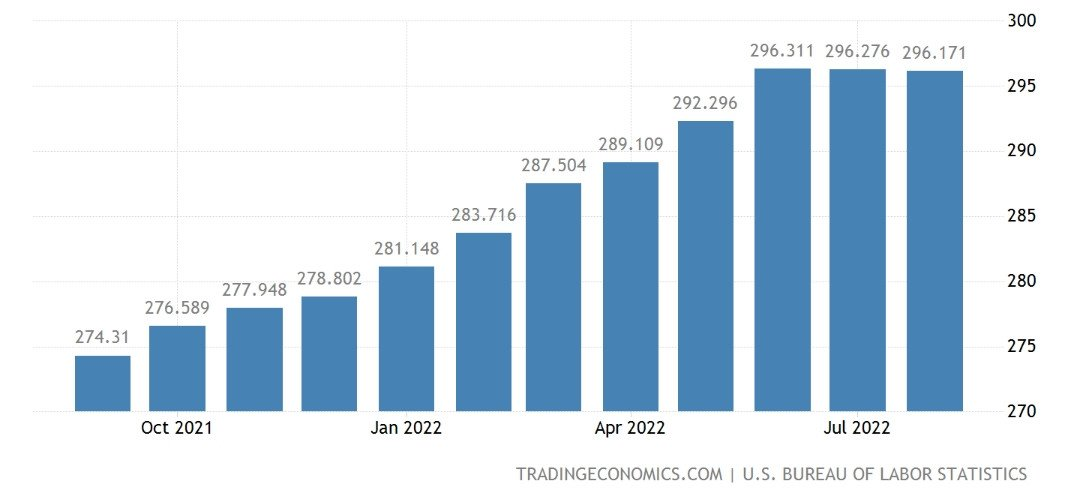
Source: US Bureau of Labor Statistics

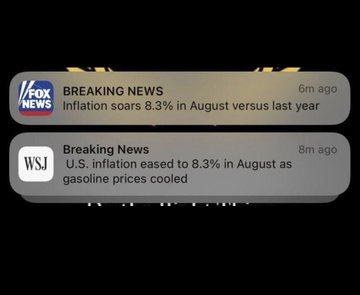
The annual inflation rate in the United States fell for the second month in a row to 8.3% in August 2022, the lowest in four months, from 8.5% in July. However, it's still above market expectations of 8.1%.

What Effect Does a Higher Inflation Rate Have on Cryptocurrencies?
To understand this, we first need to understand what inflation is. It reflects a change in the price of consumer goods and services. So a higher inflation rate signifies solid economic growth. However, if the CPI figures cross the Fed's inflation target levels, it becomes hyperinflation, which isn't considered suitable for the economy.

The US government has mandated a 2% inflation target to maintain price stability. The results are beneficial for long-term preparations. However, when inflation is significant or fluctuates frequently, it becomes difficult for companies and consumers to predict costs accurately.
The Fed's 2% Inflation Target 
The Federal Reserve's policymaking Federal Open Market Committee has had a 2% annual inflation target "as assessed by the yearly change in the price index for personal consumption expenditures" (PCE) since January 2012.
According to a recent IMF report:
The economy is expected to slow, as the Federal Reserve (the Fed) continues to tighten monetary policy and COVID economic relief programs come to an end, bringing core Personal Consumption Expenditure (PCE) inflation down to the Fed’s 2 percent medium-term target by late 2023
The Fed's medium-term target for inflation is 2%, while the current inflation rate is above 8%. So, to control this, the Federal Reserve may have to go for another round of rate hikes. 
BTC Under Pressure as another Big Rate Hike Expected
The high CPI figures ensure that on Wednesday of next week, when the US Federal Reserve announces its next policy decision, the Fed fund rate has a strong prospect of being raised by three-quarters of one percent. 
The Federal Reserve raised its key policy rate from 1.5%-1.7% last month to 2.25%-2.5%, and the market is now pricing in a further increase to 3%-3.25%. At the beginning of the year, the Fed Funds rate was between 0% and 0.25%. If the rate is increased again next week, it will be the third straight increase to the 3%-3.25% level. 

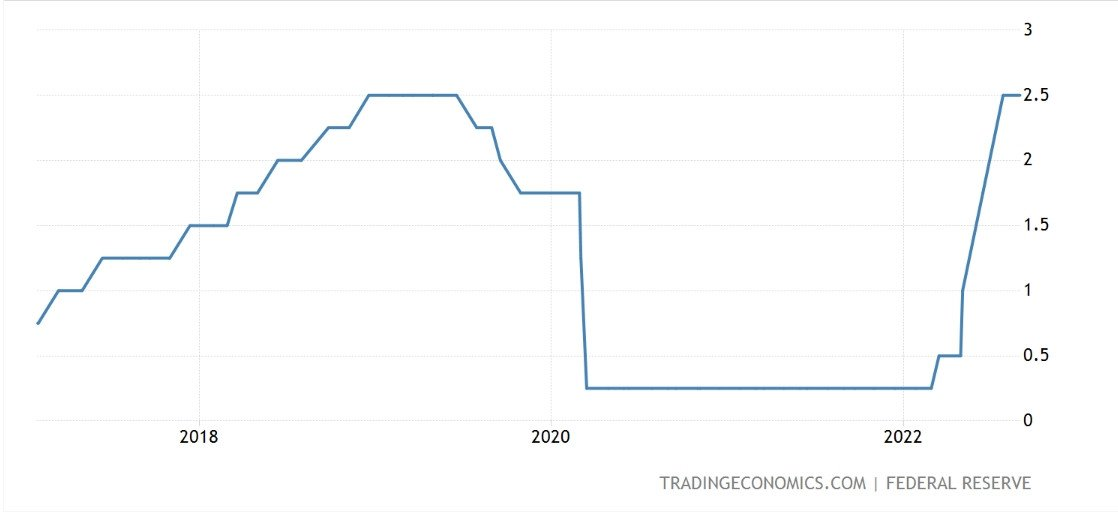
Source: Federal Reserve

The markets have been anticipating such a hike since Fed chairman Jay Powell's speech at the end of August to a symposium of central bankers at Jackson Hole in Wyoming, in which he said the Fed would be prepared to risk a US recession if that was the price to be paid for bringing US inflation under control. 
Rate Hikes Kick in Risk-off Sentiment
Higher interest rates cause a "risk-off" reaction, in which investors shift their investments away from risky securities such as stocks, indices, and cryptocurrencies and toward safe-haven assets for a risk-free return.
These risk-free securities include government bonds, interest on saving accounts, T-bills, and repurchase agreements. As a result, the Bitcoin price fell sharply following the release of the CPI figures.
Enough said about fundamentals; let us now look at Bitcoin's technical outlook.
Why Bitcoin Could Be About to Pump if This Signal is Right 
The Bitcoin price fell so sharply after the release of US CPI figures that it entered the oversold zone. The BTC/USD pair is currently trading at $20,331, with immediate support at $20,108.

Bitcoin Price Chart - Source: TradingviewOn the 4-hour timeframe, the BTC/USD pair has completed a 61.8% Fibonacci retracement at $20,108 and has formed a candlestick pattern known as a "hammer," which indicates that sellers are exhausted, and bulls may take control soon. It typically weakens the bearish trend and initiates a bullish reversal.
Simultaneously, leading technical indicators such as the relative strength index (RSI) and moving average convergence divergence (MACD) have entered the oversold territory. Both indicators increase the likelihood of a bullish bounce above the 61.8% Fibonacci retracement level.
The 50-day moving average, on the other hand, indicates the inverse. It is extending significant resistance at the $20,650 level. Increased Bitcoin demand could cut through the 50 MA, allowing for more buying until the $21,165 or 22,735 resistance levels. 
Alternatively, a bearish breakout of the $20,108 support zone could prolong the selling trend until the next support level of $19,424 or $18,515. Let's keep an eye on $20,108 to determine further price action in Bitcoin. 

Related Reads

Bitcoin Trading Strategy Breakdown: Celebrity Predictions and Classic Models All Fail, Only These Four Indicators Remain

Analysis of Bitcoin Trading Strategies: Why Celebrity Forecasts and Classic Models Fail, Leaving Only These Four Reliable Indicators This analysis examines the failure of common Bitcoin prediction methods and identifies four reliable indicators for constructing a trading strategy. The author reviewed all major BTC prediction approaches from 2017-2025, categorizing them into three groups: celebrity price targets (consistently over-optimistic), analytical models like Stock-to-Flow (broken post-2022), and on-chain signals. The key finding is that more data often creates confusion, not clarity. The strategy discards unreliable elements: celebrity predictions (incentivized to be extreme), pure models (invalidated by post-ETF market changes), and the Fear & Greed Index used alone (too many false signals). Four reliable indicators were selected: 1. **MVRV Z-Score:** Accurately identifies cycle bottoms when entering its green zone (e.g., 2018, 2020, 2022). Note: Its ability to call tops is now ineffective post-2024. 2. **SOPR (28-day MA):** Consistently signals bottoms when below 1.0, indicating holders are selling at a loss. 3. **ETF Net Flow:** A crucial post-2024 metric showing institutional momentum (e.g., sustained inflows = buying). 4. **Macro Liquidity (Fed policy & M2):** Sets the overall directional bias (e.g., bullish during easing cycles). The core strategy involves waiting for a multi-signal共振 (resonance). For example, a bottom signal requires MVRV in the green zone + SOPR < 1.0. A top signal requires overheated on-chain data + sustained ETF outflows. Macro policy sets the overall direction. The Fear & Greed Index is only used as a weighted confirmatory signal, never alone. Action is only taken when three or more indicators align. The author automated this into a monitoring system that sends Telegram alerts only when signals trigger. As of the article's date (April 15, 2026), the system showed a strong bottom signal: extreme fear (F&G=12), MVRV in the buy zone, and SOPR < 1.0. The only contrary signal was weak ETF flows. Historically, such triple on-chain共振 has preceded 100%+ returns. The conclusion emphasizes building a personal framework over relying on external predictions, allowing for iterative improvement and customization based on individual risk tolerance.

marsbit2h ago

Bitcoin Trading Strategy Breakdown: Celebrity Predictions and Classic Models All Fail, Only These Four Indicators Remain

marsbit2h ago

Trading

Spot
Futures

Hot Articles

What is $BITCOIN

DIGITAL GOLD ($BITCOIN): A Comprehensive Analysis Introduction to DIGITAL GOLD ($BITCOIN) DIGITAL GOLD ($BITCOIN) is a blockchain-based project operating on the Solana network, which aims to combine the characteristics of traditional precious metals with the innovation of decentralized technologies. While it shares a name with Bitcoin, often referred to as “digital gold” due to its perception as a store of value, DIGITAL GOLD is a separate token designed to create a unique ecosystem within the Web3 landscape. Its goal is to position itself as a viable alternative digital asset, although specifics regarding its applications and functionalities are still developing. What is DIGITAL GOLD ($BITCOIN)? DIGITAL GOLD ($BITCOIN) is a cryptocurrency token explicitly designed for use on the Solana blockchain. In contrast to Bitcoin, which provides a widely recognized value storage role, this token appears to focus on broader applications and characteristics. Notable aspects include: Blockchain Infrastructure: The token is built on the Solana blockchain, known for its capacity to handle high-speed and low-cost transactions. Supply Dynamics: DIGITAL GOLD has a maximum supply capped at 100 quadrillion tokens (100P $BITCOIN), although details regarding its circulating supply are currently undisclosed. Utility: While precise functionalities are not explicitly outlined, there are indications that the token could be utilized for various applications, potentially involving decentralized applications (dApps) or asset tokenization strategies. Who is the Creator of DIGITAL GOLD ($BITCOIN)? At present, the identity of the creators and development team behind DIGITAL GOLD ($BITCOIN) remains unknown. This situation is typical among many innovative projects within the blockchain space, particularly those aligning with decentralized finance and meme coin phenomena. While such anonymity may foster a community-driven culture, it intensifies concerns about governance and accountability. Who are the Investors of DIGITAL GOLD ($BITCOIN)? The available information indicates that DIGITAL GOLD ($BITCOIN) does not have any known institutional backers or prominent venture capital investments. The project seems to operate on a peer-to-peer model focused on community support and adoption rather than traditional funding routes. Its activity and liquidity are primarily situated on decentralized exchanges (DEXs), such as PumpSwap, rather than established centralized trading platforms, further highlighting its grassroots approach. How DIGITAL GOLD ($BITCOIN) Works The operational mechanics of DIGITAL GOLD ($BITCOIN) can be elaborated on based on its blockchain design and network attributes: Consensus Mechanism: By leveraging Solana’s unique proof-of-history (PoH) combined with a proof-of-stake (PoS) model, the project ensures efficient transaction validation contributing to the network's high performance. Tokenomics: While specific deflationary mechanisms have not been extensively detailed, the vast maximum token supply implies that it may cater to microtransactions or niche use cases that are still to be defined. Interoperability: There exists the potential for integration with Solana’s broader ecosystem, including various decentralized finance (DeFi) platforms. However, the details regarding specific integrations remain unspecified. Timeline of Key Events Here is a timeline that highlights significant milestones concerning DIGITAL GOLD ($BITCOIN): 2023: The initial deployment of the token occurs on the Solana blockchain, marked by its contract address. 2024: DIGITAL GOLD gains visibility as it becomes available for trading on decentralized exchanges like PumpSwap, allowing users to trade it against SOL. 2025: The project witnesses sporadic trading activity and potential interest in community-led engagements, although no noteworthy partnerships or technical advancements have been documented as of yet. Critical Analysis Strengths Scalability: The underlying Solana infrastructure supports high transaction volumes, which could enhance the utility of $BITCOIN in various transaction scenarios. Accessibility: The potential low trading price per token could attract retail investors, facilitating wider participation due to fractional ownership opportunities. Risks Lack of Transparency: The absence of publicly known backers, developers, or an audit process may yield skepticism regarding the project's sustainability and trustworthiness. Market Volatility: The trading activity is heavily reliant on speculative behavior, which can result in significant price volatility and uncertainty for investors. Conclusion DIGITAL GOLD ($BITCOIN) emerges as an intriguing yet ambiguous project within the rapidly evolving Solana ecosystem. While it attempts to leverage the “digital gold” narrative, its departure from Bitcoin's established role as a store of value underscores the need for a clearer differentiation of its intended utility and governance structure. Future acceptance and adoption will likely depend on addressing the current opacity and defining its operational and economic strategies more explicitly. Note: This report encompasses synthesised information available as of October 2023, and developments may have transpired beyond the research period.

363 Total ViewsPublished 2025.05.13Updated 2025.05.13

What is $BITCOIN

Discussions

Welcome to the HTX Community. Here, you can stay informed about the latest platform developments and gain access to professional market insights. Users' opinions on the price of BTC (BTC) are presented below.

活动图片