Advanced Metrics for DeFi Project Analysis

cryptoslatePublished on 2022-03-09Last updated on 2022-03-09

Abstract

Data is our best bet to understand the past, present, and future. 

Data is our best bet to understand the past, present, and future. 

In traditional finance, obtaining data is relatively difficult. On the other hand, the blockchain has broken barriers to data, giving everyone access to a giant ledger of information. However, the amount of available data has created another problem: Finding valuable information is complicated.

There are dozens of tools out there to help people analyze DeFi data with a variety of metrics. However, these metrics are mostly quite basic. In this article, we will introduce the most useful metrics as well as the more advanced data available on Footprint Analytics’ upcoming tool, DeFi 360,

Basic Data

  • TVL

TVL is usually the first metric people look at and it reflects the total value of all assets locked by users. TVL growth is often used to judge whether the project is in an upward trend.
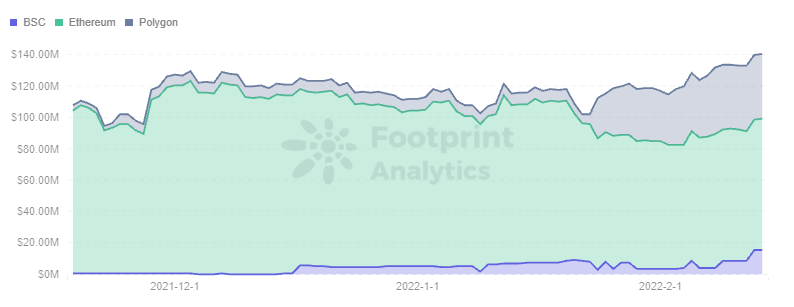
 Footprint Analytics - TVL Trend
 Footprint Analytics - TVL Trend

Footprint Analytics – TVL Trend

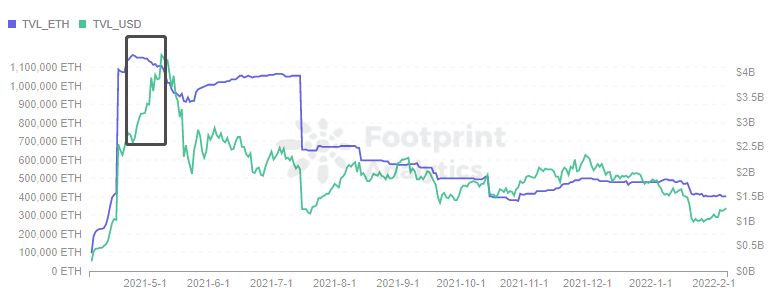
TVL is measured in dollars. Since cryptocurrency prices change rapidly, it is difficult to see whether the rise or fall in TVL is due to the price change or the addition of more investments. Therefore, in addition to the TVL, it is also necessary to pay attention to the adjusted TVL.

For example, statistics from Footprint Analytics show that TVL in ETH of Liquity (a lending program that can only lock ETH to lend out stablecoins) is slightly down in the black frame of the chart below, while TVL in USD is increasing. This is due to the rising price of ETH, which creates the illusion that the project is on an upward trend.
 Footprint Analytics - TVL in ETH vs USD
 Footprint Analytics - TVL in ETH vs USD

Footprint Analytics – TVL in ETH vs USD

Complex projects like Aave and Yearn, which offer both lock and lend functions, complicate the use of TVL as a metric and necessitate combining it with others. 

  • Net Liquidity

Net liquidity refers to the change of inflow and outflow from the previous day or month. The changes can be further analyzed in terms of both inflow and outflow, and whether the main source is user entry or loss.

  • Revenue 

DEX-based protocols cannot be measured by TVL alone since swaps also generate revenue. The ultimate goal of these types of projects is to maximize profitability and revenue reflects their operating results.
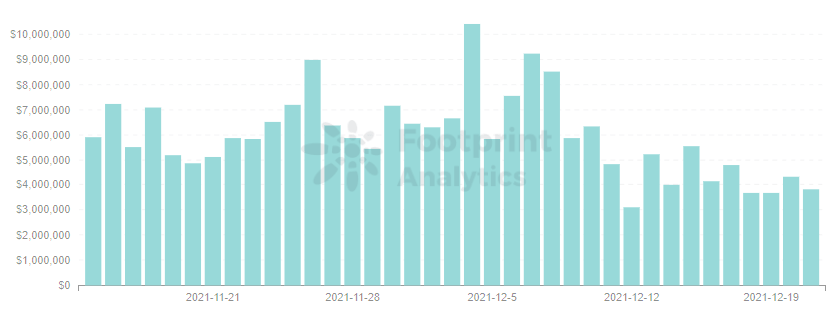
 Footprint Analytics - Revenue
 Footprint Analytics - Revenue

Footprint Analytics – Revenue

Token Data

Most platforms issue governance tokens and some use a two-token model. Token data is somewhat reflective of the market’s acceptance of the platform.

  • Basic Information

The price is the most intuitive metric, and the rise and fall is closely related to the supply and demand in the market. The price is also the fastest metric to be affected when a significant event occurs. For example, Cream faced its second major attack on Oct. 27, losing 130 million. This caused the price of CREAM to fall off a cliff.
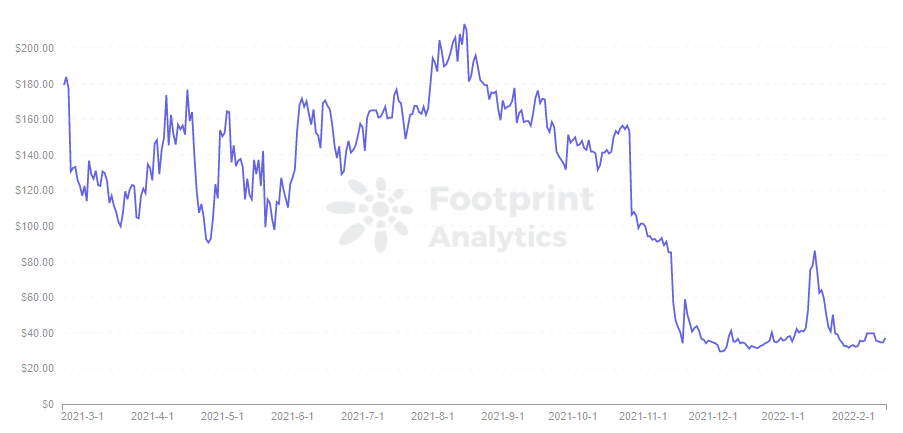
 Footprint Analytics - Token Price - CREAM
 Footprint Analytics - Token Price - CREAM

Footprint Analytics – Token Price – CREAM

For those issuing dual tokens such as MakerDAO and Liquity, monitoring the number of DAIs and LUSDs minted can also reflect the degree of user participation.

The market cap of a token is the multiplication of the price and the circulating supply, reflecting the market value of a project in the DeFi industry.

  • Number of Token Holders & Holding Time

The number of token holders reflects how many users approve of the platform’s token model. Especially important is the number of tokens staked to obtain governance rights, which reflects the platform’s DAO situation.

Holding time shows whether the project attracts more users who believe in the project’s long-term value versus speculators.

  • Utility

Trading volume reflects the activity of a token in the market, and its ratio to market cap is similar to the turnover rate. Higher circulation reflects a token with a higher level of attention, while lower circulation is a token with less attention.
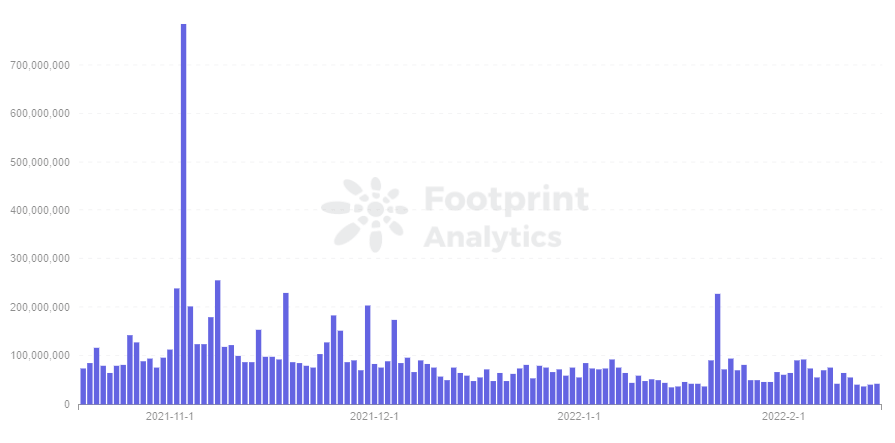
 Footprint Analytics - MKR Volume
 Footprint Analytics - MKR Volume

Footprint Analytics – MKR Volume

The utility of the token is also worth noting, i.e. whether the token mined is staked on the platform to make use of the governance token, or deposited in other external protocols to capture revenue.

For example, 61% of Liquity’s stablecoin, LUSD, is deposited in its own platform’s Stability Pool. LUSD does not play its role as a stablecoin in circulation compared to DAI’s utility.

Advanced Metrics

  • Pool Data

All DeFi project’s TVLs are made of pools, so finding the reasons behind metrics means examining the pool structure of a given project. For example: pool sizes, TVLs, and volume changes. 
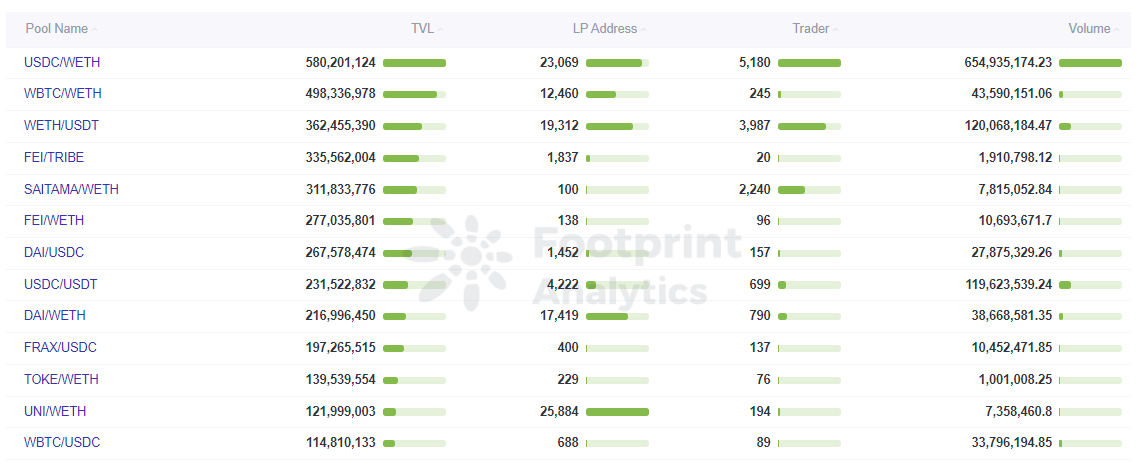
 Footprint Analytics - Pools Overview
 Footprint Analytics - Pools Overview

Footprint Analytics – Pools Overview

  • User Metrics

The project always revolves around users, and accurate capture of target users is the core of project development. Data classification and layering analysis of users can target quality users more quickly.

  • User Portrait

The overall users can be subdivided into new and active users. New users reflect market expansion, while active users reflect the project’s potential for continuing growth.
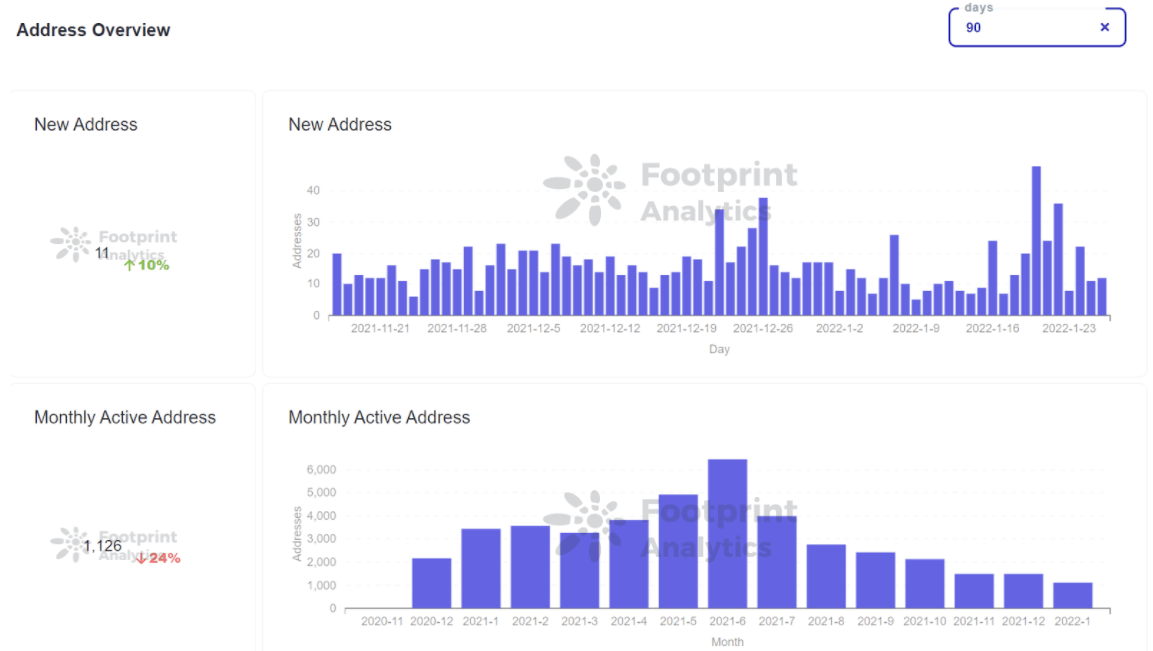
 Footprint Analytics - Address Overview
 Footprint Analytics - Address Overview

Footprint Analytics – Address Overview

The analysis of the change in transaction amount, holding amount, and duration per user enables us to understand the average user quality.
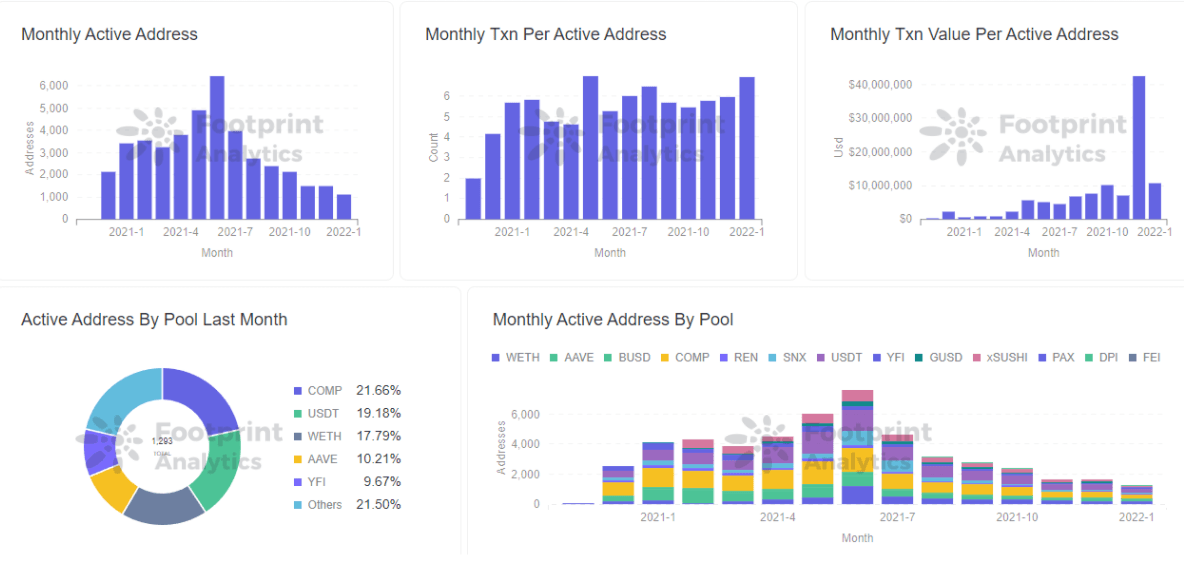
 Footprint Analytics - Active Address
 Footprint Analytics - Active Address

Footprint Analytics – Active Address

While averages can provide an observation of general trends in user behavior, it is still lacking as a foundation for project implementation. Averages often dilute important data, and a deeper user layering is required to find the real problems and develop the right action plan.
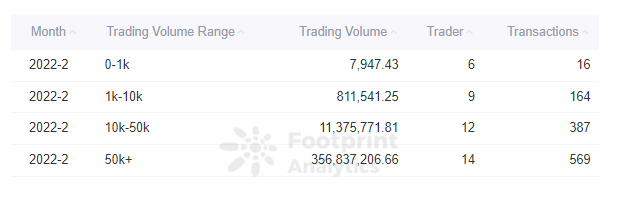
 Footprint Analytics - Trading Volume Distribution
 Footprint Analytics - Trading Volume Distribution

Footprint Analytics – Trading Volume Distribution

  • User Churn

Whales generate the most value for the platform and developers need to prevent these users from churning. By sorting users, it is possible to create user portraits and focus on big accounts.

Insight into the investment preferences of users can provide a deeper understanding of users, and uncover potential user groups by analyzing all DeFi platforms in which the target users have invested.
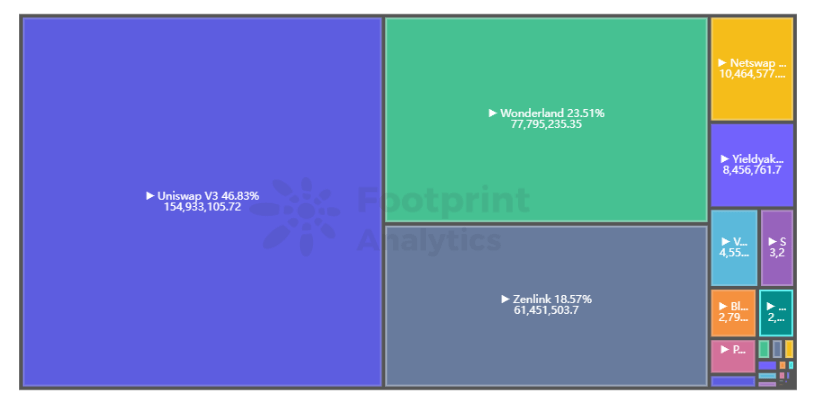
 Footprint Analytics - Address Investment Protocols Distribution
 Footprint Analytics - Address Investment Protocols Distribution

Footprint Analytics – Address Investment Protocols Distribution

Cross Analysis

Cross analysis refers to the comparative analysis of multiple metrics together. Analysts and developers can use it to find correlations between metrics and create business hypotheses. 

For example, if we compare APY with the number of users or with TVL, we can analyze the results to see if the increase in APY is attracting more users.

In another example, an analyst can compare the price of a project with the price of BTC to determine whether price movements are caused by changes in the project’s intrinsic value or larger market forces. 
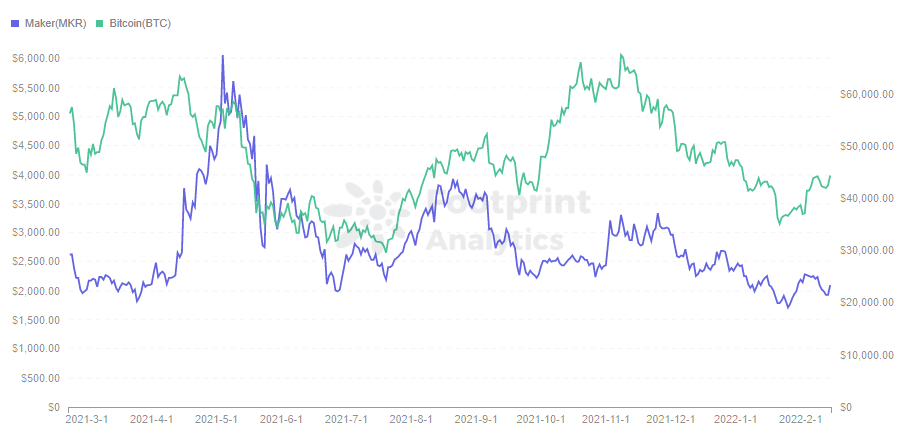
 Footprint Analytics - Token Price (MKR vs BTC)
 Footprint Analytics - Token Price (MKR vs BTC)

Footprint Analytics – Token Price (MKR vs BTC)

The Lego attributes of DeFi should not be overlooked either, with the metrics of closely related projects often being an important factor in the movement. For example, Convex helped spur the growth of Curve’s TVL.
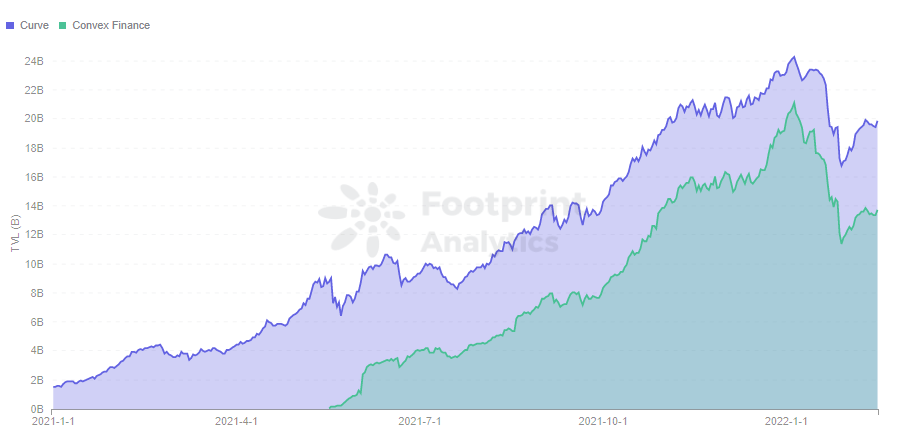
 Footprint Analytics - Curve VS Convex in TVL
 Footprint Analytics - Curve VS Convex in TVL

Footprint Analytics – Curve VS Convex in TVL

Summary

There are many analysis tools on the market, but they usually stop at surface-level metrics. 

For stakeholders to make data-driven decisions, it is crucial to dig deeper and apply advanced analytics to blockchain data. 

Date and Author: 09 February 2022, Simon

Data Source: Footprint Analytics

What is Footprint Analytics?

Footprint Analytics is an all-in-one analysis platform to visualize blockchain data and discover insights. It cleans and integrates on-chain data so users of any experience level can quickly start researching tokens, projects, and protocols. With over a thousand dashboard templates plus a drag-and-drop interface, anyone can build their own customized charts in minutes. Uncover blockchain data and invest smarter with Footprint.


Related Reads

Three Years Later: Looking Back at My Predictions About ChatGPT in 2023

Three Years Later: Revisiting My 2023 Predictions on ChatGPT In March 2023, shortly after ChatGPT's launch, I made 20 predictions about its future. Now, in mid-2026, I've used AI agents to fact-check each one against the latest data. Overall, most major directional forecasts were correct, with only one outright error (incorrectly stating GPT-4 had 100 trillion parameters). Key successes included predicting that RAG and retrieval architectures would become the standard for handling knowledge and hallucinations, that natural language interfaces (LUI) would create a massive new industry layer beyond the models themselves, and that China would develop viable large language models, significantly closing the performance gap with Western counterparts within about three years. Predictions about the absence of mass unemployment, the rise of a new "robot network" for agent communication, and ChatGPT not possessing consciousness also held true in their core arguments. However, the "devil was in the details." Errors frequently involved specific numbers, timelines, or overlooking distributional effects. I tended to overestimate the speed of adoption (e.g., for agent networks) while underestimating the ultimate scale of capabilities or costs (e.g., AI winning IMO gold without tools, or the extreme capital required for frontier models). Other misjudgments included: underestimating how AI would reinforce, not dissolve, information filter bubbles; incorrectly assuming AI-generated content would easily circumvent copyright (it has instead triggered record-breaking settlements); and misidentifying where value would be captured (it accrued overwhelmingly to the compute layer, like Nvidia, not just the application or model layers). Key lessons from reviewing these predictions are: 1) Directional and mechanistic insights are far more reliable than precise numbers or absolute statements. 2) There's a consistent bias to overestimate short-term speed but underestimate long-term magnitude. 3) Errors often lie in missing distributional impacts within a generally correct aggregate trend. 4) Predictions phrased with nuance and caveats aged the best. 5) Some fundamental debates (e.g., on machine consciousness or the ultimate value chain) remain unresolved even after three years. This exercise is less about scoring the past and more about establishing rules for clearer thinking about the next three years of AI.

marsbit3h ago

Three Years Later: Looking Back at My Predictions About ChatGPT in 2023

marsbit3h ago

Three Years Later: Looking Back on My 2023 Predictions for ChatGPT

Looking Back After Three Years: Revisiting My 2023 Predictions on ChatGPT In March 2023, shortly after ChatGPT's debut and before GPT-4's release, I made over twenty predictions about AI's future based on limited information and intuition. Now, in May 2026, I revisited those forecasts using an AI-driven analysis with 41 Opus 4.8 agents to cross-reference them with the latest data. The assessment used symbols: ✅ Correct, 🟢 Mostly Correct, 🟡 Partially Correct, ❌ Incorrect. Overall, the directional judgments held up well, with only one major factual error regarding GPT-4's rumored parameter size (incorrectly cited as 100T). However, nuances and degrees of accuracy revealed more. **What Was Largely Correct:** Predictions about mechanisms and directions proved accurate. The rise of RAG (Retrieval-Augmented Generation) as the standard architecture for combating AI hallucination was confirmed, as was the transformative potential of LUI (Language User Interface) in creating a new industry layer atop GUIs. The emergence of "robot networks" (agent-to-agent communication protocols) and China's rapid catch-up in developing capable large models (closing the performance gap with top models to ~2.7%) were also on point. The analysis affirmed that LLMs lack consciousness and that the Turing Test merely measures perceived intelligence. **What Was Off Target:** Errors often involved specific numbers, over-optimistic timelines, or misjudged distributions. The prediction that value would primarily accrue to the application layer was half-right but missed NVIDIA's dominance as the profitable infrastructure layer. Forecasts about AI circumventing copyright issues and fostering a "global common ground" by averaging human viewpoints were incorrect; instead, major copyright settlements occurred and AI personalization is increasing. Estimates for model training costs ("$5-10 billion cap") were significantly off, underestimating frontier costs and overestimating replication costs. The notion that LLMs could never do complex math without tools was disproven by later models winning IMO gold. **Key Patterns from the Review:** 1. **Direction over precision:** Judgments about mechanisms and trends were more reliable than specific numbers or definitive statements. 2. **Timing bias:** There was a tendency to overestimate short-term speed but underestimate long-term magnitude and transformation. 3. **The distribution blind spot:** Aggregate-level correctness often masked uneven impacts (e.g., on young professionals' employment). 4. **The value of qualifiers:** Predictions framed with caution (e.g., "reportedly," "for now," "prototype in 2-3 years") aged better. 5. **Some debates continue:** Issues like the nature of "emergent abilities" or machine consciousness remain unresolved. This three-year review highlights that while seeing the big picture is crucial, humility regarding specifics, timelines, and disparate impacts is essential for future forecasting.

链捕手6h ago

Three Years Later: Looking Back on My 2023 Predictions for ChatGPT

链捕手6h ago

AI Bubble Warning: AI Investments Are Negative Returns for Most Tech Giants

The article issues a stark warning about a potential AI investment bubble. It notes that while the AI boom shares similarities with the TMT bubble of the late 1990s, its scale is vastly larger, currently driving 93% of U.S. GDP growth. Major hyperscale cloud providers like Microsoft, Alphabet, Amazon, Meta, and Oracle are planning to invest trillions in AI data centers over the coming years. However, calculations based on analyst projections for 2025-2030 reveal a concerning math problem: expected capital expenditure growth far outpaces projected revenue growth. Even under an extremely optimistic scenario of zero costs, the implied return on investment for most of these tech giants (except Amazon) is deeply negative. This suggests that the current trajectory could lead to one of history's largest shareholder value destruction events. The piece outlines two potential escapes: AI generating vastly more revenue than currently anticipated—a near-impossible task—or a significant cutback in the planned investment splurge. The latter scenario could trigger a domino effect, severely impacting the entire tech supply chain (from Nvidia to TSMC), potentially pushing the U.S. economy into recession, and causing a major stock market downturn. The author suggests upcoming high-profile IPOs by companies like OpenAI and Anthropic might represent a transfer of risk from early investors to public market participants. While the peak of the hype cycle might sustain investment through 2026, the fundamental financial dilemma remains unresolved, setting the stage for a potential market correction in 2027 or 2028, similar to the years following Alan Greenspan's "irrational exuberance" warning.

marsbit6h ago

AI Bubble Warning: AI Investments Are Negative Returns for Most Tech Giants

marsbit6h ago

From Tokens to Machine Labor: AI is Shifting from Tool to "Worker"

The article "From Token to Machine Labor: AI is Evolving from Tool to 'Worker'" argues that the business model for AI is shifting beyond simply selling computational resources (tokens, GPU hours) or model access. Instead, a new "machine labor market" is emerging, where the core economic transaction is the purchase of economically useful work directly performed by software. The central thesis is that AI pricing will evolve through four stages: 1) raw tokens, 2) standardized LLM capabilities (e.g., text generation), 3) industry-specific labor markets (e.g., legal review, radiology), and finally 4) a programmable results market where tasks like resolving a support ticket are bid on and priced based on outcome. In this future, buyers will care less about *which* model or GPU completes a task and more about whether the work meets specified standards for accuracy, latency, and cost. This transition reframes the impact of AI on human labor. Rather than simple replacement, it suggests a re-coordination where machines handle standardized, verifiable work, freeing humans for roles involving oversight, context management, responsibility, and final judgment. In some cases, this "last 1%" of human input becomes more valuable as it enables the other 99% to be automated. Furthermore, as AI reduces the cost of work, demand may expand, creating larger markets (e.g., 24/7 customer service) rather than just cheaper versions of existing ones. The article concludes that while infrastructure (GPUs, models, tokens) remains crucial upstream, the market is converging on a simpler, tradeable unit: machine labor that can be defined, measured, priced, and procured based on contractible specifications.

marsbit7h ago

From Tokens to Machine Labor: AI is Shifting from Tool to "Worker"

marsbit7h ago

Xiaomi MiMo's 99% Price Cut is Not Marketing! Luo Fuli Posts on X to Refute Critics

The price of Xiaomi's MiMo-V2.5 series API has been permanently reduced by up to 99%, specifically for the "Input (Cache Hit)" cost, which covers users re-reading historical context in long conversations. MiMo's head, Luo Fuli, published a detailed technical blog to clarify that this drastic price cut stems from genuine engineering breakthroughs, not a marketing stunt or a simple price war. The core of the achievement lies in six key engineering optimizations. First, the model architecture adopts a Hybrid Sliding Window Attention (SWA), reducing the memory footprint (KVCache) to 1/7th of a traditional model. Second, a dual-pool memory management system actually utilizes these savings, allowing a single GPU to handle over 5 times more concurrent users. Third, an upgraded prefix caching mechanism achieves a cache hit rate of 93-95% for repeated reads, meaning most such requests bypass GPU computation entirely. Fourth, a self-developed distributed cache (GCache) utilizes idle SSD space on existing GPU servers, eliminating additional storage costs. Fifth, an intelligent scheduling system (LLM-Router) efficiently routes requests to maximize cache reuse and performance. Sixth, Multi-Token Prediction (MTP) accelerates the model's text generation ("output") side. Together, these systemic optimizations dramatically lower the real computational cost per request, enabling the 99% price reduction for cached inputs while reportedly maintaining positive gross margins. Luo Fuli's disclosure aims to shift the narrative from "price war" to a demonstration of substantive AI engineering progress.

marsbit9h ago

Xiaomi MiMo's 99% Price Cut is Not Marketing! Luo Fuli Posts on X to Refute Critics

marsbit9h ago

Trading

Spot
Futures

Hot Articles

Discussions

Welcome to the HTX Community. Here, you can stay informed about the latest platform developments and gain access to professional market insights. Users' opinions on the price of ETH (ETH) are presented below.

活动图片














