Ethereum Price Forecast: Can ETH Break Through $2,000 as the ETH/BTC Ratio Forms a Cup and Handle?

cryptonews.ruPublished on 2026-08-03Last updated on 2026-08-03

Abstract

Ethereum price forecast: Can ETH break $2,000 as the ETH/BTC ratio forms a cup and handle pattern? As of August 3, 2026, Ethereum (ETH) is trading at $1,856.19, consolidating within a Fibonacci range between $1,837 and $1,939. A descending trendline from May's peak continues to cap recovery attempts, with key resistance near $1,925-$1,940 (100-day EMA and trendline confluence). The RSI at 49.99 shows neutral momentum with a bearish divergence signal. Technical analysis identifies support levels at the 50-day EMA ($1,848.92) and the 0.382 Fibonacci level ($1,837.76). Resistance levels are noted at the 20-day EMA ($1,867.85), the 100-day EMA ($1,925.95), and the 0.5 Fibonacci level ($1,939.99). Spot Ethereum ETFs recorded their fourth consecutive week of net inflows, totaling $27.42 million for the week ending July 31. This contrasts with Bitcoin ETFs, which saw outflows the same day. The ETH/BTC ratio is forming a potential bullish "cup and handle" pattern on the daily chart. A confirmed breakout above the 0.030 resistance level would signal ETH outperforming Bitcoin. Fundamental debates highlight a disconnect: while Ethereum's ecosystem is scaling rapidly, with Layer 2 rollups processing significantly more transactions, the core network's fee capture has decreased. Data shows Ethereum L1 captured only about 4.9% of the fees generated by applications built on it in Q2 2026. Analyst Tanaka argues ETH's value accrual is shifting towards its role as collateral and settlement...

Ethereum is trading at $1,856.19 on August 3, down 1.44%, consolidating within the Fibonacci range between $1,837 and $1,939, as the downtrend line from the May peak continues to limit recovery attempts.

$ETH Holds the 0.382 Fibonacci Level, But the Downtrend Line Remains Unbroken
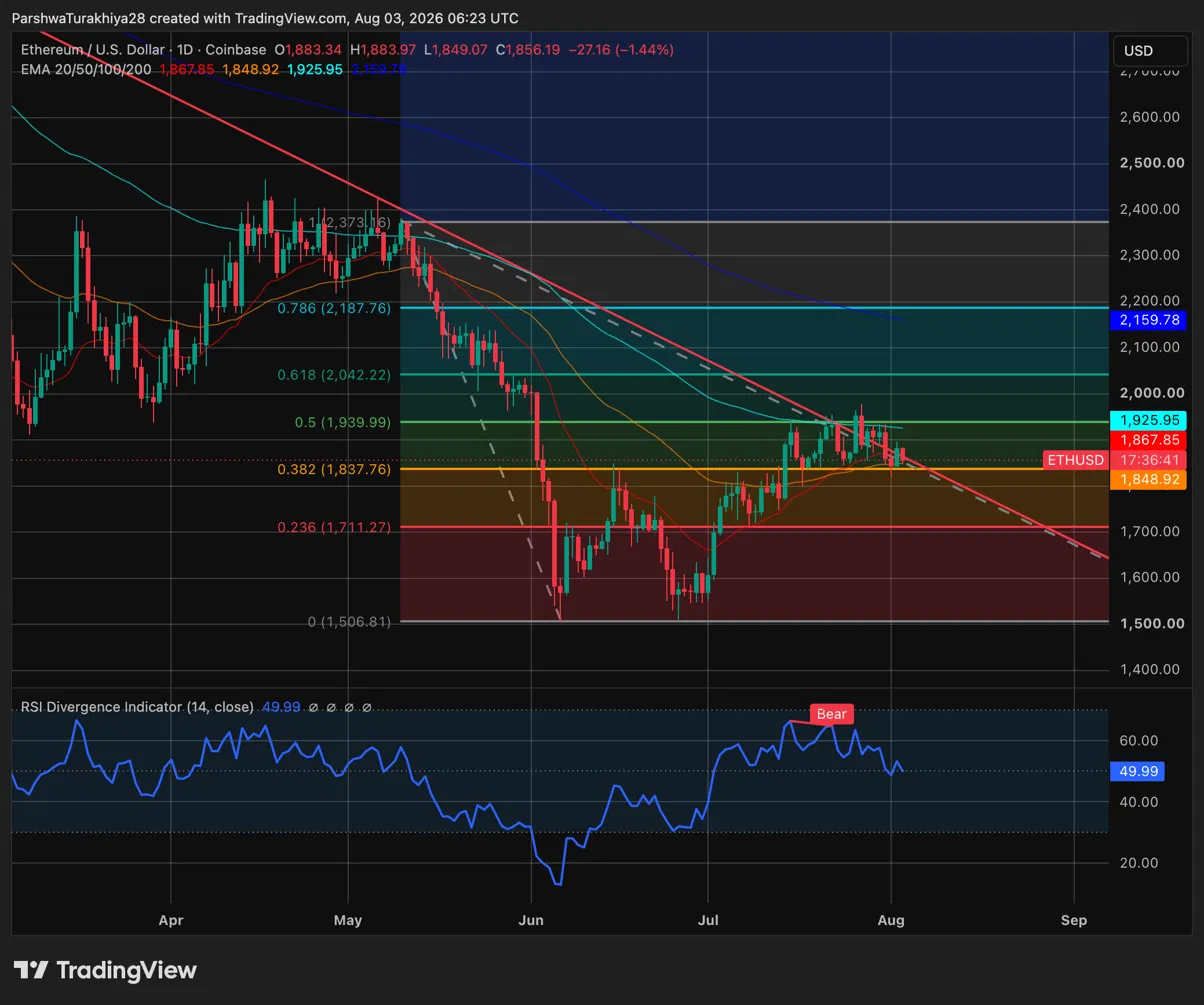
Ethereum Price Analysis (Source: TradingView)

$ETH is trading between the 0.382 Fibonacci level at $1,837.76 and the 0.5 level at $1,939.99, with today's session falling from a high of $1,883.97 to close at $1,856.19. The 20-day EMA at $1,867.85 is just above the nearest ceiling, and the 50-day EMA at $1,848.92 is the first support below.

The downtrend line from the May peak around $2,373 continues to push the price back near $1,900, and the 100-day EMA at $1,925.95 clusters with this line, making the $1,925–$1,940 zone a key area to overcome before reaching $2,000. The RSI at 49.99 is right at neutral with a bearish divergence signal, indicating that momentum has not yet confirmed a recovery.

Support and Resistance Levels for $ETH, August 3, 2026

Type Price Level
Resistance $1,867.85 20-day EMA, nearest ceiling
Resistance $1,925.95 100-day EMA, coincides with downtrend line
Resistance $1,939.99 0.5 Fibonacci
Resistance $2,042.22 0.618 Fibonacci
Resistance $2,159.78 200-day EMA, long-term ceiling
Support $1,848.92 50-day EMA, first support below
Support $1,837.76 0.382 Fibonacci, key floor
Support $1,711.27 0.236 Fibonacci
Support $1,506.81 June low, Fibonacci base

Spot $ETH ETFs Record Fourth Consecutive Week of Inflows

Spot Ethereum ETFs recorded a daily net inflow of $9.03 million on July 31, bringing the total weekly inflow to $27.42 million and extending the $ETH inflow streak to four consecutive weeks, according to SoSoValue. This flow followed weekly inflows of $103.90 million, $105.44 million, and $84.42 million over the previous three weeks, making the week of July 31 the mildest of the four but still positive. The cumulative net inflows for all products now stand at $11.21 billion with total net assets of $10.23 billion.

The contrast with Bitcoin ETFs is noticeable. Spot $BTC products recorded a one-day outflow of $265.37 million on July 31, breaking a three-week inflow streak, while $ETH products maintained a positive result for the fourth consecutive week.

The $ETH/$BTC Ratio Forms a Cup and Handle
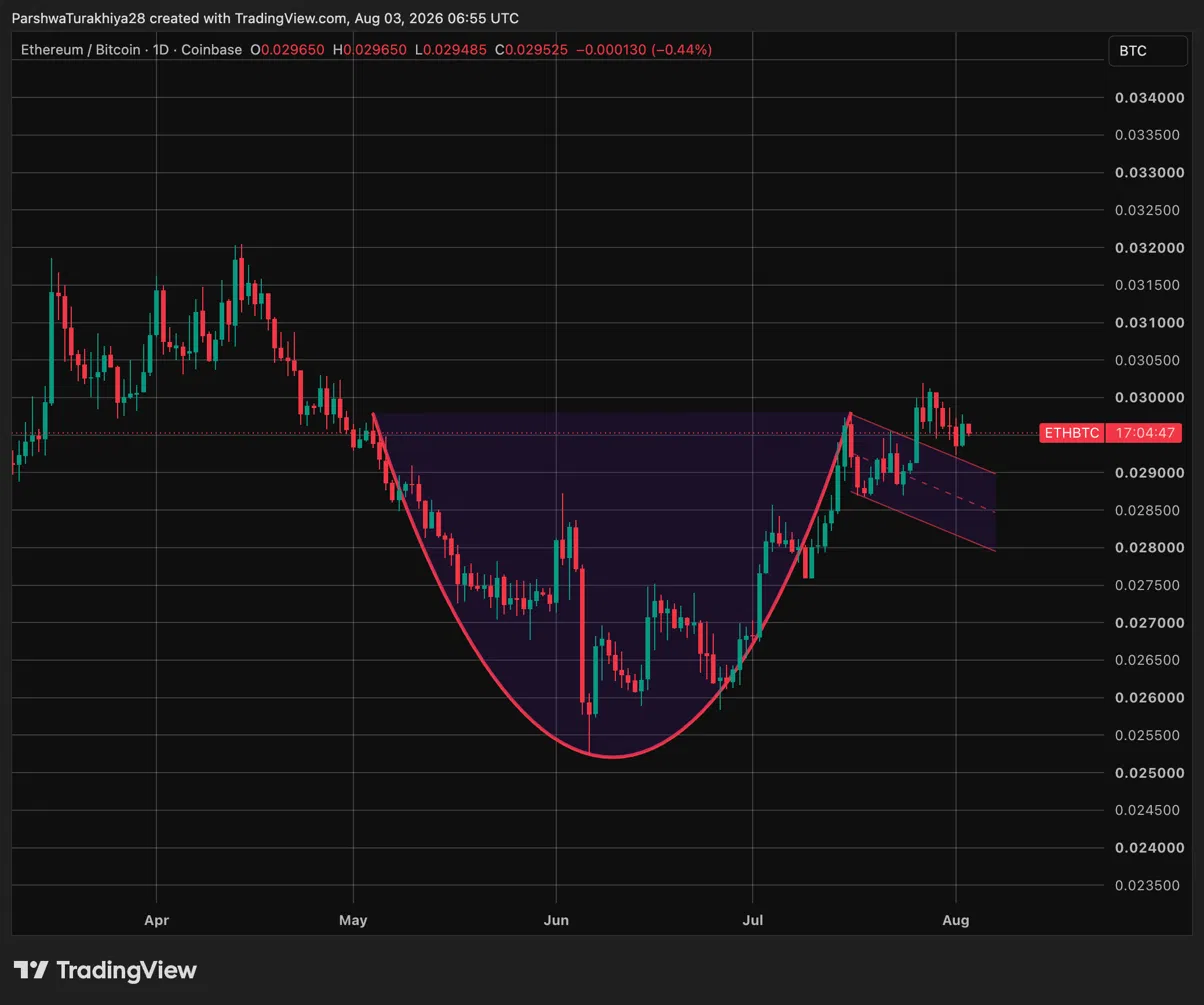
Analysis of the $ETH/$BTC Ratio (Source: TradingView)

The $ETH/$BTC pair is trading at 0.029525 on the daily chart, down 0.44% for the session, but the broader structure tells a more constructive story. The ratio carved out a full cup from the May high around 0.0300, reaching a low around 0.0255 in June before recovering back to the breakout line. The price is now forming a handle just below the 0.030 resistance—a classic cup and handle pattern.

A confirmed breakout above 0.030 on a daily close would signal that $ETH is outperforming Bitcoin in the near term, which historically corresponds to broader altcoin strength. The lower bound of the handle around 0.0285 is a level to watch for downside risk. A break below this would again call the recovery structure into question and indicate that Bitcoin continues to lead.

The Ethereum Valuation Debate: Scaling Without Capturing Fees

➥ Ethereum is scaling faster than ever, yet $ETH is still trading below $2,000

As someone who actually holds $ETH, I think this disconnect is the most important debate in the ecosystem right now.

Q2 numbers were not terrible, but they exposed a structural weakness:

– Ethereum... https://t.co/c8UCEkhCk9 pic.twitter.com/ke8X3XcEiI

— Tanaka (@Tanaka_L2) July 31, 2026

Analyst Tanaka highlighted a key tension in a July 31 thread: Ethereum is scaling faster than ever, but the $ETH itself is capturing less and less of the value being created on top of it.

Second-quarter data makes this concrete. Ethereum L1 generated $88.4 million in real economic value, while applications built on it generated about $1.79 billion in fees, meaning L1 captured only 4.9% of its ecosystem's output. Rollups currently process about 1,270 operations per second compared to just 20.4 on L1—a gap of 41.6 times. Robinhood Chain alone processes about 4.7 times more activity than the Ethereum mainnet. Cheap blob fees have enabled scaling but have also reduced $ETH burn, with the 7-day blob fee burn being only 0.22 $ETH.

Tanaka's argument is that the old theory of more users driving higher gas fees and more $ETH burn no longer holds. His current bet is on institutional adoption: $17.2 billion in tokenized real-world assets are already on Ethereum within a $299.4 billion stablecoin market, positioning $ETH as collateral and settlement infrastructure, not as a fee-generating asset.

Metric Value
L1 Real Economic Value $88.4 million (up 7% QoQ, down 68% YoY)
Application-Level Fees ~$1.79B
L1 Value Capture Ratio ~4.9% of application-level fees
Rollup Activity ~1,270 UOPS vs 20.4 on L1
7-Day Blob Fee Burn ~0.22 $ETH
$ETH Staked ~41.10 million (33.7% of supply)
Tokenized RWAs on Ethereum ~$17.2B

Ethereum Price Forecast: Upside Targets and Downside Risks

Bull Case, Target: $2,042 (0.618 Fibonacci)

$ETH holds the 50-day EMA at $1,848.92 and reclaims the 20-day EMA at $1,867.85 at the daily close, confirming the 0.382 Fibonacci as support. The downtrend line breaks as $ETH ETF inflows continue for a fifth consecutive week, and the $ETH/$BTC ratio confirms a cup and handle breakout above 0.030. The price breaks through the 100-day EMA at $1,925.95 and the psychological $2,000 level to the 0.618 Fibonacci at $2,042.22.

Bear Case, Risk Level: $1,711 (0.236 Fibonacci)

The downtrend line continues to reject the price, and the bearish RSI divergence worsens. $ETH loses the 50-day EMA at $1,848.92 and the 0.382 Fibonacci level at $1,837.76, with the $ETH/$BTC ratio breaking below 0.0285, confirming a resumption of Bitcoin dominance. The price falls towards the 0.236 Fibonacci level at $1,711.27, with the June low of $1,506.81 coming back into view for a deeper low.

end-content

Trending Cryptos

Related Reads

Trading

Spot

Hot Articles

What is $BITCOIN

DIGITAL GOLD ($BITCOIN): A Comprehensive Analysis Introduction to DIGITAL GOLD ($BITCOIN) DIGITAL GOLD ($BITCOIN) is a blockchain-based project operating on the Solana network, which aims to combine the characteristics of traditional precious metals with the innovation of decentralized technologies. While it shares a name with Bitcoin, often referred to as “digital gold” due to its perception as a store of value, DIGITAL GOLD is a separate token designed to create a unique ecosystem within the Web3 landscape. Its goal is to position itself as a viable alternative digital asset, although specifics regarding its applications and functionalities are still developing. What is DIGITAL GOLD ($BITCOIN)? DIGITAL GOLD ($BITCOIN) is a cryptocurrency token explicitly designed for use on the Solana blockchain. In contrast to Bitcoin, which provides a widely recognized value storage role, this token appears to focus on broader applications and characteristics. Notable aspects include: Blockchain Infrastructure: The token is built on the Solana blockchain, known for its capacity to handle high-speed and low-cost transactions. Supply Dynamics: DIGITAL GOLD has a maximum supply capped at 100 quadrillion tokens (100P $BITCOIN), although details regarding its circulating supply are currently undisclosed. Utility: While precise functionalities are not explicitly outlined, there are indications that the token could be utilized for various applications, potentially involving decentralized applications (dApps) or asset tokenization strategies. Who is the Creator of DIGITAL GOLD ($BITCOIN)? At present, the identity of the creators and development team behind DIGITAL GOLD ($BITCOIN) remains unknown. This situation is typical among many innovative projects within the blockchain space, particularly those aligning with decentralized finance and meme coin phenomena. While such anonymity may foster a community-driven culture, it intensifies concerns about governance and accountability. Who are the Investors of DIGITAL GOLD ($BITCOIN)? The available information indicates that DIGITAL GOLD ($BITCOIN) does not have any known institutional backers or prominent venture capital investments. The project seems to operate on a peer-to-peer model focused on community support and adoption rather than traditional funding routes. Its activity and liquidity are primarily situated on decentralized exchanges (DEXs), such as PumpSwap, rather than established centralized trading platforms, further highlighting its grassroots approach. How DIGITAL GOLD ($BITCOIN) Works The operational mechanics of DIGITAL GOLD ($BITCOIN) can be elaborated on based on its blockchain design and network attributes: Consensus Mechanism: By leveraging Solana’s unique proof-of-history (PoH) combined with a proof-of-stake (PoS) model, the project ensures efficient transaction validation contributing to the network's high performance. Tokenomics: While specific deflationary mechanisms have not been extensively detailed, the vast maximum token supply implies that it may cater to microtransactions or niche use cases that are still to be defined. Interoperability: There exists the potential for integration with Solana’s broader ecosystem, including various decentralized finance (DeFi) platforms. However, the details regarding specific integrations remain unspecified. Timeline of Key Events Here is a timeline that highlights significant milestones concerning DIGITAL GOLD ($BITCOIN): 2023: The initial deployment of the token occurs on the Solana blockchain, marked by its contract address. 2024: DIGITAL GOLD gains visibility as it becomes available for trading on decentralized exchanges like PumpSwap, allowing users to trade it against SOL. 2025: The project witnesses sporadic trading activity and potential interest in community-led engagements, although no noteworthy partnerships or technical advancements have been documented as of yet. Critical Analysis Strengths Scalability: The underlying Solana infrastructure supports high transaction volumes, which could enhance the utility of $BITCOIN in various transaction scenarios. Accessibility: The potential low trading price per token could attract retail investors, facilitating wider participation due to fractional ownership opportunities. Risks Lack of Transparency: The absence of publicly known backers, developers, or an audit process may yield skepticism regarding the project's sustainability and trustworthiness. Market Volatility: The trading activity is heavily reliant on speculative behavior, which can result in significant price volatility and uncertainty for investors. Conclusion DIGITAL GOLD ($BITCOIN) emerges as an intriguing yet ambiguous project within the rapidly evolving Solana ecosystem. While it attempts to leverage the “digital gold” narrative, its departure from Bitcoin's established role as a store of value underscores the need for a clearer differentiation of its intended utility and governance structure. Future acceptance and adoption will likely depend on addressing the current opacity and defining its operational and economic strategies more explicitly. Note: This report encompasses synthesised information available as of October 2023, and developments may have transpired beyond the research period.

1.4k Total ViewsPublished 2025.05.13Updated 2025.05.13

What is $BITCOIN

Discussions

Welcome to the HTX Community. Here, you can stay informed about the latest platform developments and gain access to professional market insights. Users' opinions on the price of BTC (BTC) are presented below.

活动图片