TRX di $0.32 – Mengapa tren volume menunjukkan breakout harga baru sulit terjadi sekarang

ambcryptoPublished on 2026-03-28Last updated on 2026-03-28

Abstract

Pada saat penulisan, TRON (TRX) mengalami kenaikan 0,85% dalam seminggu, menjadikannya salah satu aset kripto top 20 yang catat keuntungan. TRX sempat mencapai tinggi lokal $0,317 pada 27 Maret, namun kemudian turun 1,48% dalam 24 jam. Sejak crash awal Februari, TRX menunjukkan ketahanan dengan kenaikan 15,47% dalam 7 minggu, mendekati level tinggi pertengahan Januari di $0,32. Analisis teknis menunjukkan momentum bullish berdasarkan indikator MACD, namun TRX berada di ujung atas kisaran 4-bulan ($0,271-$0,319). Volume perdagangan yang lesu sejak Desember, tercermin dari On-Balance Volume (OBV) yang tidak membuat tinggi baru, menunjukkan kurangnya dominasi pembeli dan menghambat potensi breakout. Struktur timeframe H4 masih bullish, namun momentum dan OBV mulai menurun. Trader disarankan mengambil keuntungan dan bersiap untuk pergerakan menuju batas bawah kisaran, kecuali jika penutupan harian di atas $0,32 tercapai yang akan membatalkan bias bearish ini.

Pada saat penulisan, TRON [TRX] naik 0,85% dalam seminggu terakhir – Salah satu aset kripto tunggal di top 20 berdasarkan kapitalisasi pasar yang mencatat kenaikan dalam seminggu terakhir. Altcoin tersebut telah meroket ke tinggi lokal $0,317 pada Jumat, 27 Maret. Namun, segera menghapus keuntungan ini dan turun 1,48% dalam 24 jam.

Namun, sejak crash awal Februari, TRON telah menunjukkan beberapa ketahanan pada grafik harga. Itu naik 15,47% dalam hanya lebih dari 7 minggu, dan tampaknya berada dalam posisi untuk menantang tinggi pertengahan Januari sebesar $0,32.

Ini mungkin menjadi zona tanpa perdagangan untuk TRX sampai altcoin mengungkapkan apa yang ada di toko berikutnya.

Pembentukan kisaran dan pemicu untuk langkah TRX berikutnya

Sumber: TRX/USDT di TradingView

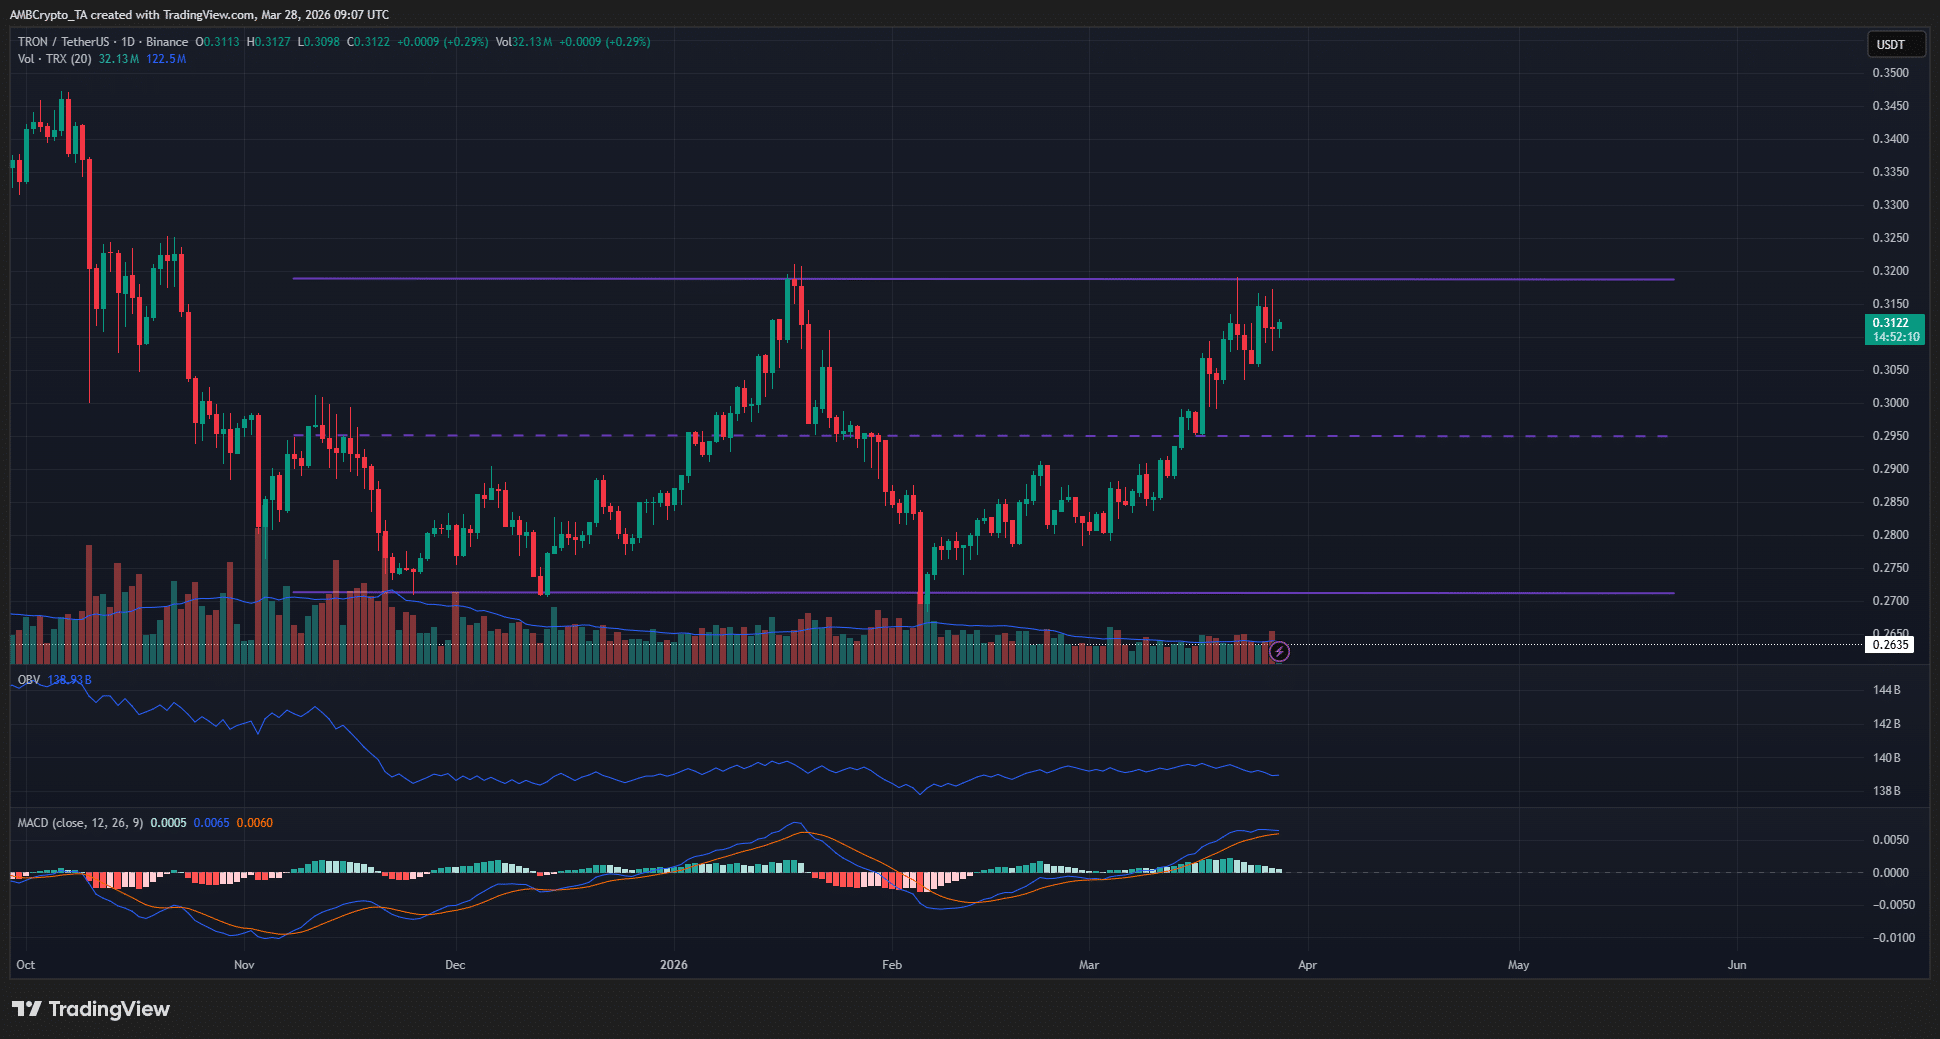
Tren 1 hari tampak bullish, dengan MACD mencerminkan momentum naik. Pada saat yang sama, hampir berada di tinggi kisaran empat bulan di $0,319. Rendah kisaran adalah di $0,271, dan reli sejak crash Februari dimulai dari rendah ini.

Seperti keadaan, meskipun kekuatan relatif TRX baru-baru ini, lari bullish mungkin segera berakhir. OBV tidak membuat tinggi baru dalam minggu-minggu terakhir untuk menunjukkan dominasi pembeli. Jika itu terjadi, itu akan menunjuk ke arah potensi breakout.

OBV yang lesu mungkin merupakan hasil dari volume perdagangan umumnya biasa-biasa saja di pasar TRON sejak Desember. Tidak ada uptrend sejak itu yang lahir oleh volume yang luar biasa.

Haruskah bias trader berubah bearish atau tetap bullish?

Sumber: TRX/USDT di TradingView

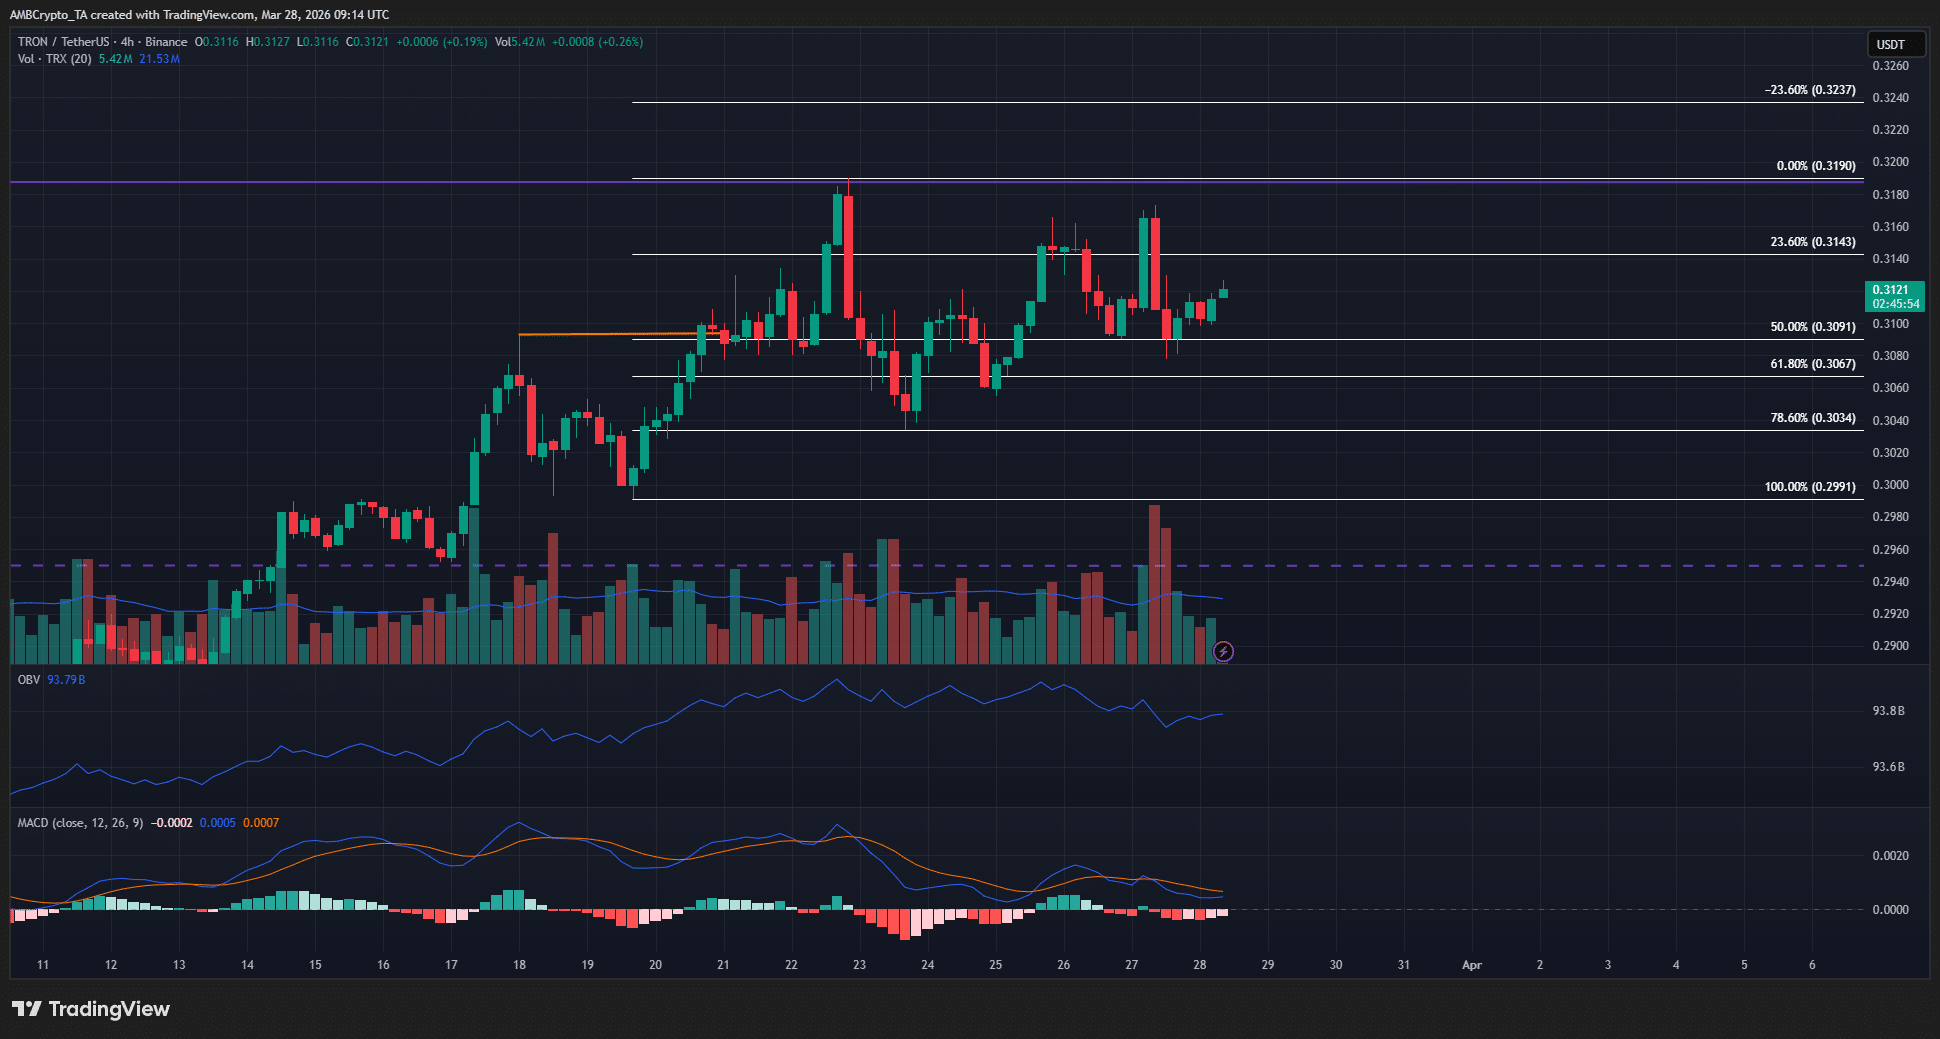
Struktur timeframe H4 tetap bullish, meskipun momentum dan OBV telah mulai surut juga. Uji ulang $0,309 pada Jumat, 27 Maret, melihat reaksi positif dalam jam-jam terakhir.

Namun, kisaran timeframe yang lebih tinggi harus dihormati sampai itu dilanggar dengan bersih. Oleh karena itu, meskipun struktur bullish jangka pendek, trader dan investor TRX dapat melihat untuk mengambil keuntungan dan mempersiapkan untuk langkah menuju rendah kisaran.

Sementara itu, penutupan sesi harian di atas $0,32 akan membatalkan bias bearish yang digariskan di sini.


Ringkasan Akhir

  • TRON telah steadily bullish sejak crash pasar di minggu pertama Februari.
  • Tinggi formasi kisaran empat bulan sedang diuji, tetapi TRX mungkin sudah menyelesaikan reli nya.

Related Questions

QBagaimana kinerja harga TRX dalam seminggu terakhir dibandingkan dengan aset kripto top 20 lainnya?

ATRX naik 0,85% dalam seminggu terakhir, menjadikannya salah satu dari sedikit aset kripto di top 20 yang mengalami keuntungan selama periode tersebut.

QApa yang ditunjukkan oleh indikator OBV (On-Balance Volume) tentang pergerakan TRX?

AOBV tidak mencapai level tertinggi dalam beberapa minggu terakhir, menunjukkan kurangnya dominasi pembeli dan volume perdagangan yang biasa-biasa saja sejak Desember.

QPada level harga berapa TRX mencapai high lokal pada 27 Maret?

ATRX mencapai high lokal pada level $0,317 pada tanggal 27 Maret.

QApa yang perlu terjadi untuk membatalkan bias bearish yang diuraikan dalam artikel?

ABias bearish akan terbatal jika terjadi penutupan harga harian di atas level $0,32.

QApa saran artikel untuk trader dan investor TRX pada kondisi saat ini?

AArtikel menyarankan untuk mengambil keuntungan dan bersiap untuk pergerakan menuju level terendah kisaran (range low) karena rally bullish mungkin akan segera berakhir.

Related Reads

Saylor's Latest Long Read: Bitcoin is Not Money, It's Digital Capital, and Money is Built Upon It

Michael Saylor presents his "Digital Asset Stack" theory, positioning Bitcoin as the foundational layer of digital capital. He argues Bitcoin itself should remain unchanged—no staking, inflation, or protocol alterations. Instead, a five-layer financial architecture should be built atop it: Digital Capital (BTC), Digital Credit (e.g., yield instruments like STRC), Digital Currency (stable, yield-bearing instruments pegged to fiat), Digital Yield (leveraged/structured products), and Digital Equity (e.g., MSTR stock, absorbing residual volatility). Saylor asserts this stack transforms Bitcoin's high-volatility, high-energy capital into tailored products: stable currencies for payments/savings, yield instruments for income seekers, and equity for growth investors. This approach meets diverse needs—corporate treasuries, banks, retirees, emerging market users—without compromising Bitcoin's core properties (scarcity, decentralization). The "killer use case" is rebuilding global money, credit, and capital markets on Bitcoin, bridging the fiat world with a superior digital asset foundation. The system leverages traditional finance principles (risk layering, structured products) while using Bitcoin as the ultimate collateral. This expands Bitcoin's utility, drives adoption, and offers a better monetary experience: digital, yield-bearing, stable-value tools for everyday use.

marsbit5m ago

Saylor's Latest Long Read: Bitcoin is Not Money, It's Digital Capital, and Money is Built Upon It

marsbit5m ago

Can SK Hynix's Stock Double Again in This Rally?

The article discusses the highly optimistic price target of approximately $3,500 for SK Hynix stock, set by Aletheia Capital. This target is significantly above the consensus range of $2,000-$2,520 from major brokerages. The core debate is whether SK Hynix deserves a fundamental re-rating beyond its traditional cyclical discount, based on the long-term impact of AI-driven demand. The $3,500 target hinges on three key assumptions holding simultaneously until at least 2027: 1) Continued shortage and high pricing for HBM (High Bandwidth Memory), a critical component for AI chips; 2) Sustained high prices for standard DRAM, as HBM production consumes capacity and constrains general supply; and 3) Strong AI server demand generating substantial, above-expectation free cash flow. SK Hynix's leading ~58% market share in HBM and its early certification with key clients like Nvidia provide a competitive advantage, allowing it to capture significant supply chain premiums. The HBM shortage is seen not just as a niche growth driver but as a catalyst that amplifies profitability across the entire memory business by tightening overall DRAM supply. However, the article cautions that this target represents an optimistic "tail scenario." Key risks include potential supply increases from competitors (Samsung, Micron) by 2027, a possible slowdown in HBM price growth, and high capital expenditures that could erode the projected free cash flow. The divergence in analyst targets reflects the market's uncertainty over whether the current AI-driven boom will temporarily elevate earnings or permanently raise the memory industry's profit baseline.

marsbit8m ago

Can SK Hynix's Stock Double Again in This Rally?

marsbit8m ago

Has the Cryptocurrency Market Hit Bottom? Here's What Institutions Think

"Has the crypto market bottomed out? Major institutions are divided on the outlook, according to a recent analysis by Matt Hougan, Chief Investment Officer of Bitwise. Three prominent research firms published in-depth reports on the topic with differing conclusions. Galaxy Digital argues Bitcoin has not yet found its bottom, pointing to only 4 out of 13 historical bottoming indicators being met. Their analysis suggests a potential bottom range of $30,000 to $54,000. NYDIG adopts a more cautious stance, noting that while metrics are close to historical bear market lows, a classic panic-selling capitulation event is missing. They acknowledge the possibility of a bottom but consider it unlikely, citing structural changes from institutional adoption. In contrast, Standard Chartered Bank asserts the bottom is already in at around $59,000. Their revised bullish view, predicting a year-end target of $100,000, hinges on anticipated reductions in ETF selling pressure linked to events like a potential SpaceX IPO. Despite the surface-level disagreement on the exact price floor, the reports share significant common ground crucial for long-term investors. All three institutions agree that a market bottom will likely form within the current year, that current prices are closer to the bottom than to previous cycle highs, and that Bitcoin is poised for another major bull cycle in the future. The core takeaway is that while the precise bottom level remains debated, the long-term value proposition for Bitcoin remains strong and may even be strengthening. Key supportive trends include rising global debt, persistent inflation, declining trust in traditional institutions, accelerating digitization, and improving market infrastructure. Therefore, for investors with a long-term horizon, the focus should shift from pinpointing the exact bottom to recognizing that the cycle's peak is likely still ahead, making current levels an attractive entry point for substantial potential upside."

Foresight News29m ago

Has the Cryptocurrency Market Hit Bottom? Here's What Institutions Think

Foresight News29m ago

Trading

Spot
Futures

Hot Articles

How to Buy TRX

Welcome to HTX.com! We've made purchasing TRON (TRX) simple and convenient. Follow our step-by-step guide to embark on your crypto journey.Step 1: Create Your HTX AccountUse your email or phone number to sign up for a free account on HTX. Experience a hassle-free registration journey and unlock all features.Get My AccountStep 2: Go to Buy Crypto and Choose Your Payment MethodCredit/Debit Card: Use your Visa or Mastercard to buy TRON (TRX) instantly.Balance: Use funds from your HTX account balance to trade seamlessly.Third Parties: We've added popular payment methods such as Google Pay and Apple Pay to enhance convenience.P2P: Trade directly with other users on HTX.Over-the-Counter (OTC): We offer tailor-made services and competitive exchange rates for traders.Step 3: Store Your TRON (TRX)After purchasing your TRON (TRX), store it in your HTX account. Alternatively, you can send it elsewhere via blockchain transfer or use it to trade other cryptocurrencies.Step 4: Trade TRON (TRX)Easily trade TRON (TRX) on HTX's spot market. Simply access your account, select your trading pair, execute your trades, and monitor in real-time. We offer a user-friendly experience for both beginners and seasoned traders.

26.0k Total ViewsPublished 2024.03.29Updated 2026.06.02

How to Buy TRX

Discussions

Welcome to the HTX Community. Here, you can stay informed about the latest platform developments and gain access to professional market insights. Users' opinions on the price of TRX (TRX) are presented below.

活动图片