TL;DR Breakdown
1.Solana price dropped another 4 percent over the past 24 hours
2.Price continues to trend downwards with bearish indicators
3.SOL could crash down to $25 critical support
——
_____
Solana price analysis is bearish today, as price continues along a downtrend that initiated on July 31, 2022, with price at month-long high at $46.69. SOL price dropped another 4 percent over the past 24 hours, moving as low as $39.88, and sitting at $40.39 at the time of writing. Solana faces danger of a significant crash down to critical support at $25, with seller pressure increasing and price moving below the crucial moving averages on the daily chart. A bullish intervention from buyers could still propel price upwards to resistances at $49 and $60.
The larger cryptocurrency market showed mixed signals from over the past 24 hours, majorly showing small declines. Bitcoin moved down to the $23,000 mark to settle there, while Ethereum rose 2 percent to move close to $1,700. Among leading Altcoins, Cardano dropped 2 percent to $0.50, while Ripple settled at $0.37. Dogecoin stayed around $0.06, whereas Polkadot dropped 3 percent to move down to $7.97.
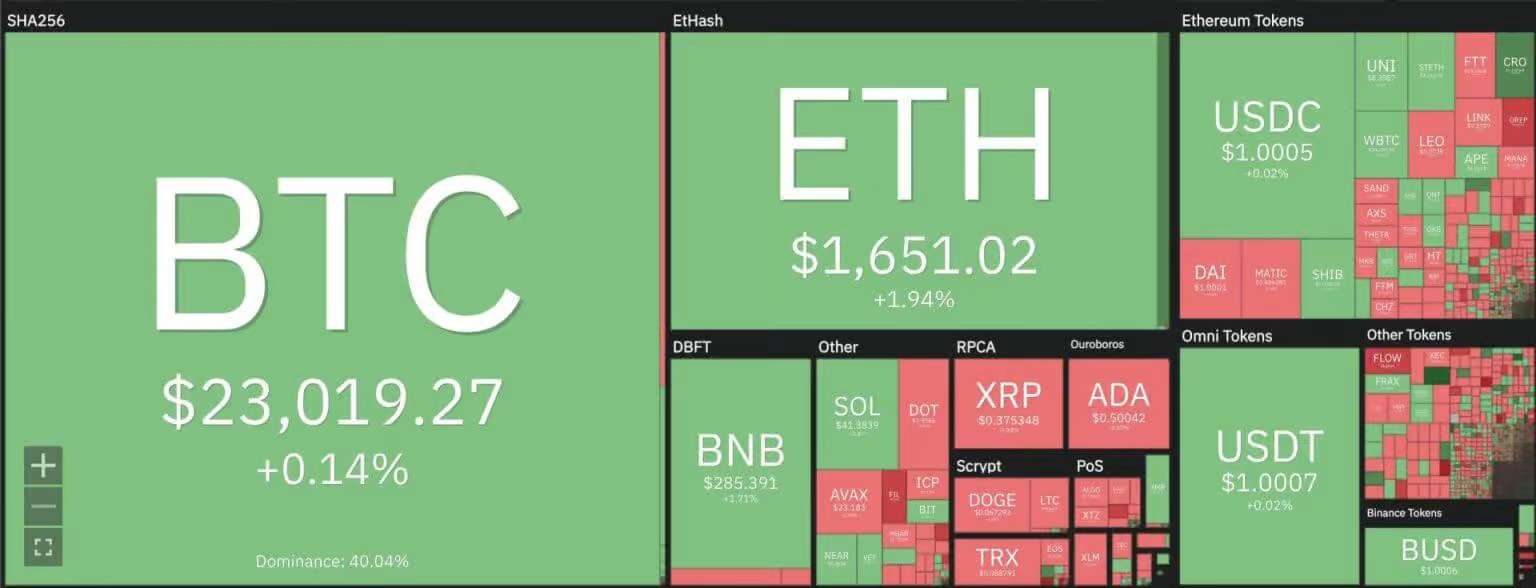
Solana price analysis: Cryptocurrency heat map. Source: Coin360
Solana price analysis: SOL market valuation suffers hit on 24-hour chart
On the 24-hour candlestick chart for Solana price analysis, price can be seen extending into a descending triangle pattern based on price action over the past 24 and 48 hours. SOL lowered down to $39.53 today, the lowest point since July 23, 2022, as price enjoyed a run up to the $46 mark just last week. Since then, market volatility has picked up with most cryptocurrencies, with Solana being one in danger to crash down to critical support at $25.
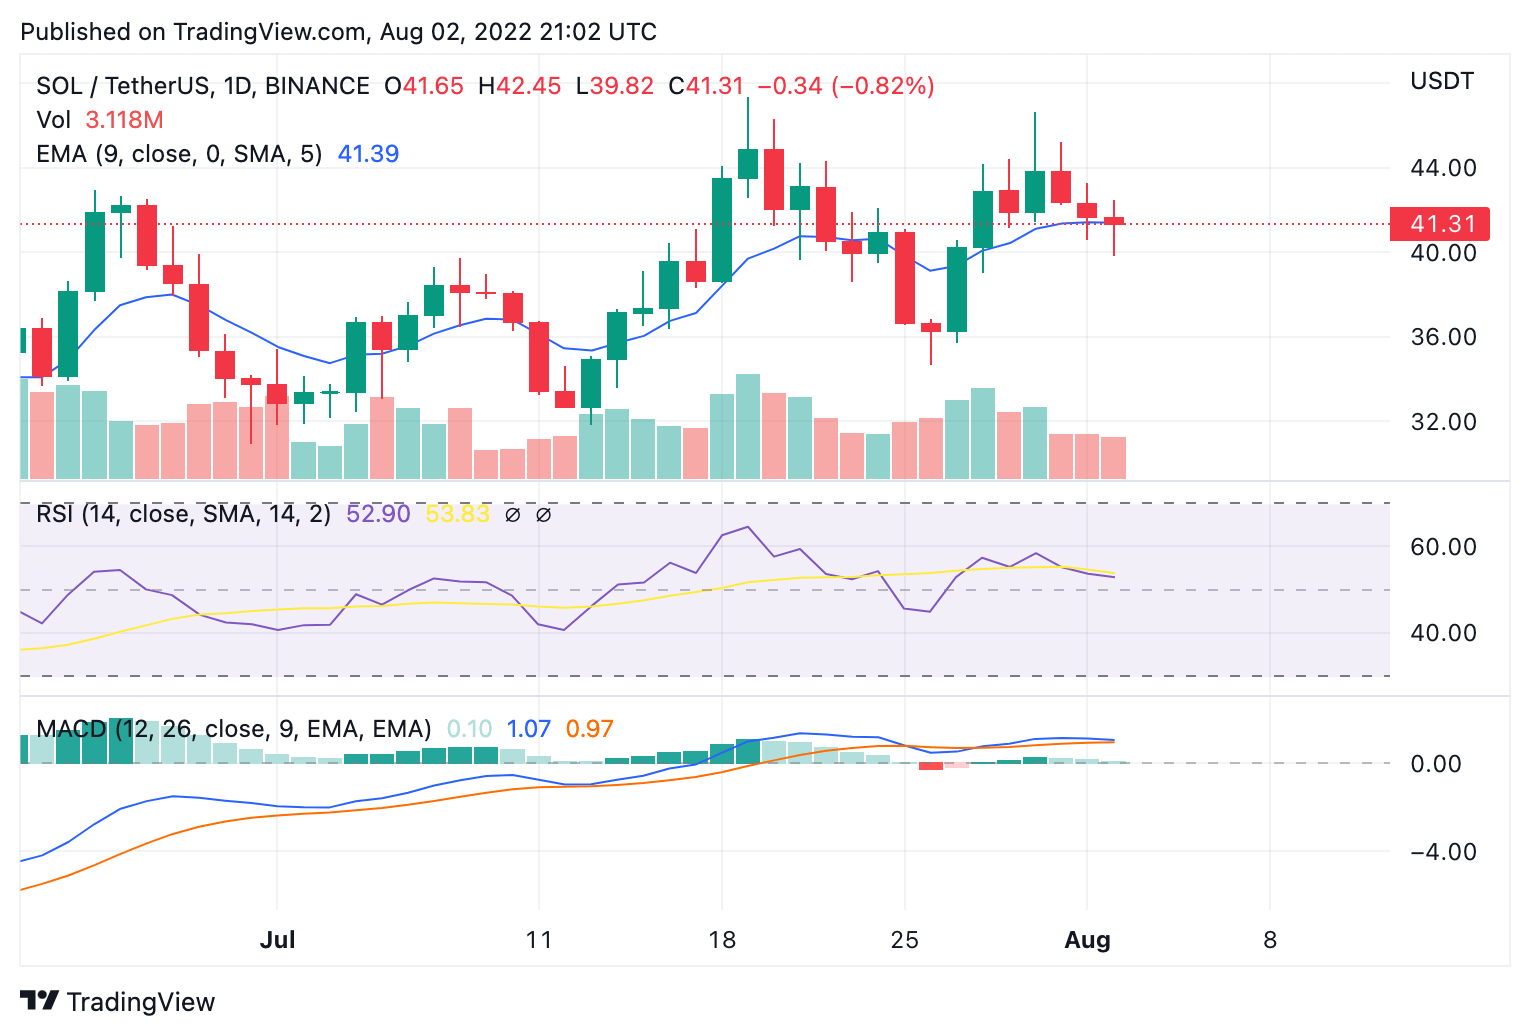
Solana price analysis: 24-hour chart. Source: Trading View
Price over the past 24 hours has lowered below the 9 and 21-day moving averages, along with the 50-day exponential moving average (EMA) at $40.86. The 50EMA had been a barrier between a severely bearish price scenario and residual bullish momentum from the previous trend and still remains crucial for Solana’s prospects to reverse the current downtrend. The 24-hour relative strength index (RSI) also shows lowering market valuation after lowering below the 50 mark. Trading volume also lowered 9 percent over the past 24 hours. Meanwhile, the moving average convergence divergence (MACD) curve has also turned bearish and can be seen forming lower lows around the neutral zone.