Bear Market Drives Global Crypto Jacking Volume, SonicWall Report Finds

BitcoinistPublished on 2022-07-27Last updated on 2022-07-27

Abstract

Per a report from security firm SonicWall, Crypto jacking has been soaring in 2022. This trend has been unaffected and probably has been boosted by the bearish price action recorded across the digital asset industry.

Per a report from security firm SonicWall, Crypto jacking has been soaring in 2022. This trend has been unaffected and probably has been boosted by the bearish price action recorded across the digital asset industry.

According to the definition of Crypto-Jacking by cyber security oriented website Cyberpunk:

(This) is an unauthorized use of someone else’s computer, tables, mobile phone or connected devices to mine cryptocurrency. Simple as that.

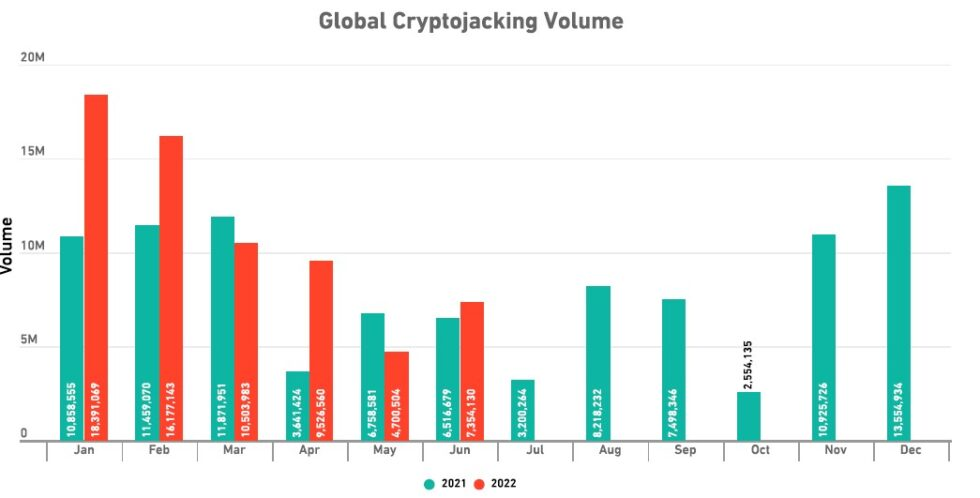
The report claims that global cryptojacking volumes increased by 66.7 million hits in the first half of 2022. This represents a 30% increase when compared to its 2021 levels over the same period.

SonicWall registered record growth in total cryptojacking volume but unevenly distributed across 2022. In January this year, the metric stood at 18.4 million hits, a new all-time high surpassing previous record levels, taking the total Q1 attacks to 45.1 million.

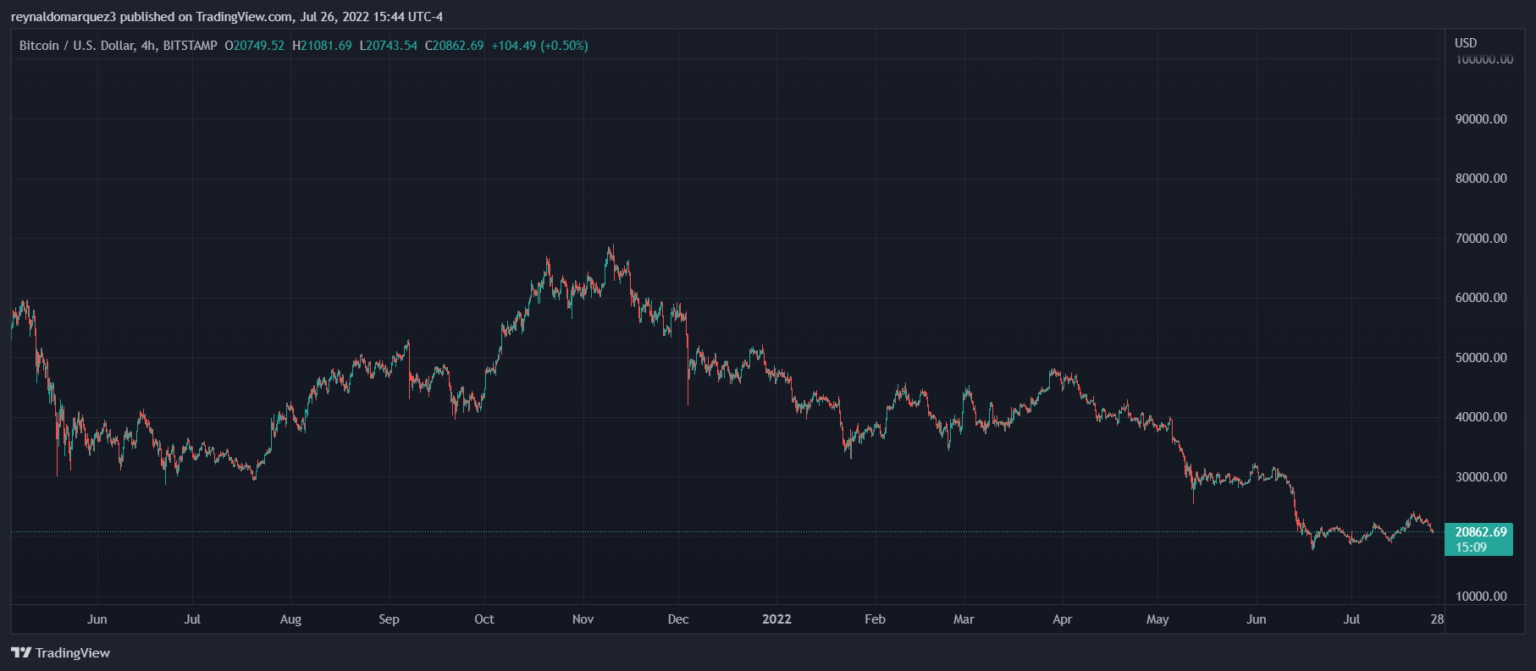
This is the “most ever observed in a single quarter” taking place while the price of Bitcoin and Ethereum trended to the downside from new all-time highs recorded in late 2021. The cyber attacks saw a pulled back in April and May 2022.

The report claims hits halved from their peak recording 21.6 million attacks over this period. This represents a reduction of over 50% from previous months.

This slow down in crypto jacking, the security firm claims, responds to a “well-established pattern” for the industry. As seen below, cryptojacking attacks kick off each year with a spike preceding a cooldown period which translates into another peak later in the year.

In 2021, bad actors used ransomware and other cyber-attacks to profit off industries and individuals. Cryptocurrencies were part of these attacks as bad actors often demanded payments in Bitcoin and other digital assets.

Why Are Crypto Jackings Rising In 2022?

The proliferation of these attacks gained the attention of international governments. In the United States, the Executive committed resources to prevent these attacks. At that time, a spokesperson for the Whitehouse’s Counter Ransomware initiative said:

(we will improve) network resilience to prevent incidents when possible and respond effectively when incidents do occur; addressing the abuse of financial mechanisms to launder ransom payments or conduct other activities that make ransomware profitable.

As a result, the report claims cyber criminals have migrated from high-risk, high-reward schemes to low-risk, low rewards and more sustainable exploits, such as cryptojacking. These attacks can stay active for a long time impacting the victim without their knowledge.

Terry Greer-King, SonicWall Vice President for EMEA:

It has a lower potential of being detected by the victim; unsuspecting users across the world see their devices get unaccountably slower, but it’s hard to tie it to criminal activity, much less point to the source

In that sense, the report claims that there has been a dropped in the number of hits targeting governments, healthcare, and the education sector. Conversely, retail investors and the financial sector recorded a 63% and 269% increase, respectively, in the number of cryptojackings.

Trending Cryptos

Related Reads

Gate Research Institute: Analysis of Chart Patterns and Breakout Trading Strategies

Gate Research Institute: Chart Pattern Analysis and Breakout Trading Strategies Chart patterns are crucial tools in technical analysis for observing market supply and demand shifts, trend continuations, and reversals. This analysis involves a comprehensive evaluation of trend, volume, support/resistance, time cycles, and breakout validity, not just rote pattern recognition. Patterns are broadly categorized into reversal patterns (e.g., Double Tops/Bottoms, Head and Shoulders) and continuation patterns (e.g., Flags, Triangles, Rectangles). An effective breakout, key for trading, requires clear support/resistance, prolonged consolidation, a prevailing trend backdrop, and volume confirmation. However, breakouts are not guaranteed, as false breakouts are common. Risk must be managed through position sizing, stop-loss orders, pullback confirmations, and profit-taking in stages. Key pattern types discussed include: * **Rectangle Patterns:** Indicate market indecision within parallel support and resistance, with breakouts projecting a move equal to the pattern's width. * **Flag & Pennant Patterns:** Short-term continuation patterns following sharp price moves ("flagpoles"). * **Triangle Patterns:** Symmetrical, Ascending (bullish bias), and Descending (bearish bias) triangles, representing consolidation before a directional move. * **Head and Shoulders Patterns:** Major reversal patterns signaling trend exhaustion. The article details breakout trading strategies, defining valid breakouts by price closing beyond a key level with increased volume and minimal immediate re-entry into the prior range. It contrasts range trading with breakout trading and outlines entry methods (immediate entry, pullback entry, scaling in), stop-loss placement (based on pattern failure), and profit-taking techniques (target-based, structure-based, trend-following). It further classifies breakout outcomes: 1. **Valid Breakouts:** Strong, sustained moves in the breakout direction. 2. **Pullback Breakouts:** Price breaks out, retests the breakout level as support/resistance, then resumes the trend—offering a lower-risk entry. 3. **False Breakouts:** Price briefly breaches a level but quickly reverses back into the prior range, a common risk managed by strict stop-losses. Key validation tools for breakouts include volume analysis, the principle of support/resistance role reversal, and momentum indicators like ATR, Moving Averages, Bollinger Bands, and RSI. In conclusion, while chart patterns and breakout analysis provide a structured framework, their effectiveness relies on multiple confirming factors—trend context, volume, and proper risk management. They should be integrated into a broader trading system rather than used as standalone signals.

marsbit6m ago

Gate Research Institute: Analysis of Chart Patterns and Breakout Trading Strategies

marsbit6m ago

Joseph Chalom: Ethereum is Becoming the "Settlement Layer of Trust" for Global Finance

In a speech titled "The Industrialization of Trust," Sharplink CEO Joseph Chalom (former BlackRock digital assets head) discussed the future transformation of global finance. Drawing from 20 years at BlackRock, where he led the launch of Bitcoin/ETH ETFs and tokenized funds, Chalom highlighted the immense hidden costs of establishing trust in traditional finance—estimated at over $9.3 trillion annually in the US alone due to fragmented systems, multi-day settlements, and countless reconciliations. He argued that Ethereum is emerging as the global financial "settlement layer for trust," with its robust, decentralized infrastructure securing over $300 billion in on-chain assets and most stablecoins and tokenized assets. The future, he stated, will be driven by three accelerating pillars: stablecoins (evolving beyond crypto gateways to become efficient cross-border payment rails), tokenized assets (enabling 24/7 trading and reshaping capital markets), and DeFi (providing automated, accessible financial services). A potential game-changer, Chalom added, is the fourth pillar: "Agentic Finance," where AI agents autonomously execute programmable financial transactions via smart contracts and stablecoins. He envisions individuals soon having AI-powered "CFOs in their pockets" to optimize idle capital and manage tokenized portfolios. This shift, facilitated by Ethereum's trustless settlement, could multiply on-chain transaction volume 1000x within a year, moving finance toward a seamless, digitized future.

marsbit6m ago

Joseph Chalom: Ethereum is Becoming the "Settlement Layer of Trust" for Global Finance

marsbit6m ago

STRC Severely Unpegged, What Risks Is the Market Pricing In?

The article analyzes the recent significant de-pegging of Strategy's perpetual preferred stock, STRC, whose price fell to approximately $89, far below its $100 face value. This discount has pushed its simple yield to around 12.9%, creating a paradox. The stock was designed as a high-yield instrument trading near par, and Strategy maintains an 11.5% annual dividend, even recently switching to semi-monthly payments to support the price. The author explores several reasons why the high yield hasn't attracted enough buying pressure to restore the par value. A key factor is potential reverse deleveraging from carry trades, where leveraged investors may be forced to sell due to margin calls as the price falls, creating a self-reinforcing downward spiral. Additionally, the tokenization and integration of STRC into DeFi protocols (like Apyx, Saturn, Pendle) have introduced faster, more transparent, and potentially more volatile price adjustment mechanisms through leverage and yield-splitting products. The emergence of a competing product, Strive's SATA, offering a 13% yield with daily dividends, has also changed the yield benchmark, challenging STRC's unique high-yield narrative. Furthermore, the market is questioning the distinction between Strategy's substantial Bitcoin reserves, which provide long-term balance sheet coverage, and the certainty of stable near-term cash flow for dividends. Ultimately, the price dip represents a stress test for this type of BTC-backed, high-yield financing tool. The future path of STRC depends on whether Strategy acts to reinforce the $100 peg (e.g., by adjusting dividends), whether DeFi-related leverage unwinds further, and how investors ultimately price the risks of leverage, competition, and cash flow uncertainty against the offered yield.

marsbit18m ago

STRC Severely Unpegged, What Risks Is the Market Pricing In?

marsbit18m ago

LIT Token Hits Six-Month High: How Long Can the Buyback Flywheel Keep Burning Fuel?

The LIT token of decentralized perpetual exchange Lighter surged to a six-month high above $1.90 on June 18th, with a market cap of $425 million. After a price correction earlier this year, the recent rebound is attributed to its core "buyback flywheel" mechanism. All protocol fee revenue is used for programmatic, hourly market buybacks of LIT. Since its TGE in December 2025, approximately 15 million LIT (6% of circulating supply) has been repurchased for around $21 million. Additional price support comes from the LLP (Lighter Liquidity Pool), where providers must stake LIT worth 10% of their deposited USDC, locking significant token supply. However, challenges persist. Trading volume has declined amidst a sluggish market, with total volume at $1.68 trillion, significantly lower than leading competitor Hyperliquid's $4.37 trillion. While Lighter focuses on perpetual contracts, RWA, and Pre-IPO markets, Hyperliquid has expanded into prediction markets and boasts a U.S. spot ETF, attracting institutional investment and influencer endorsements like from Arthur Hayes. In contrast, LIT currently lacks similar high-profile backing. With 75% of LIT's total 1 billion supply still locked (team and investor tokens begin a 3-year linear unlock in December 2026), there is no immediate unlock selling pressure. The token's future performance hinges on sustaining trading volume growth, successful product iteration, and executing its transparent buyback strategy against a dominant competitor.

Foresight News37m ago

LIT Token Hits Six-Month High: How Long Can the Buyback Flywheel Keep Burning Fuel?

Foresight News37m ago

Trading

Spot
Futures

Hot Articles

Discussions

Welcome to the HTX Community. Here, you can stay informed about the latest platform developments and gain access to professional market insights. Users' opinions on the price of ETH (ETH) are presented below.

活动图片