Bullish Sentiment Spills Over To Institutional Investors As Ethereum Inflows Balloons

newsbtcPublished on 2022-07-27Last updated on 2022-07-27

Abstract

Institutional investors had been showing bearish sentiment towards Ethereum for the longest time. The second-largest cryptocurrency by market cap, which had initially caught their attention, was not doing as well as expected, and the outflows that followed were massive. However, it looks like sentiment among these large investors is beginning to turn positive as Ethereum has begun to record inflows.

Institutional investors had been showing bearish sentiment towards Ethereum for the longest time. The second-largest cryptocurrency by market cap, which had initially caught their attention, was not doing as well as expected, and the outflows that followed were massive. However, it looks like sentiment among these large investors is beginning to turn positive as Ethereum has begun to record inflows.

Ethereum Inflows Balloons

Over the last several weeks, Ethereum inflows have been ramping up. Although they were nowhere near the volumes that had been recorded during the bull market, it had put a stop to more than 2 months of consecutive outflows for the digital asset.

Last week would prove to be no different, given that Ethereum’s inflows had come out to $8 million, a low volume, but it was inflows nonetheless. But the most important inflows were recorded in the week prior when the digital asset had initially been recorded to have seen inflows of $2.5 million.

Corrected numbers which had emerged this week had shown that not only was this number too low, it was off by more than $100 million. When the corrected data was published this week, it showed that inflows into ETH had reached $120 million in that single-week period, meaning that it was the largest single-week inflow in one year.

It is a testament to the changing sentiment among institutional investors when it comes to the altcoin. With the anticipated Merge approaching quickly, the bullish sentiment has washed over both small and large investors alike, prompting more investment into the digital asset.

A Week Of Inflows

Ethereum was fortunately not the only cryptocurrency to mark another week of inflows. The bullish sentiment had extended to almost every sphere of the crypto market, and the investors had reacted accordingly. So from bitcoin to digital asset investment products, the inflows continued.

Bitcoin had seen either week of inflows, with $16 million recorded for last week. Just like Ethereum, the numbers for bitcoin for the prior week had been incorrect, and corrected data showed a much higher inflow rate for the prior week with $206 million in total. The inflow trend was not limited to long bitcoin alone, though as short bitcoin continued its streak with $0.6 million in inflows.

Digital asset investment products would prove to be the big winners for the week with inflows of $27 million. The total asset under management has not been pushed back up to $30 billion with last week’s inflows. Europe also accounted for the majority of inflows as Switzerland alone recorded $16 million for last week. The USA and Germany would see lesser inflows of $9 million and $5 million.

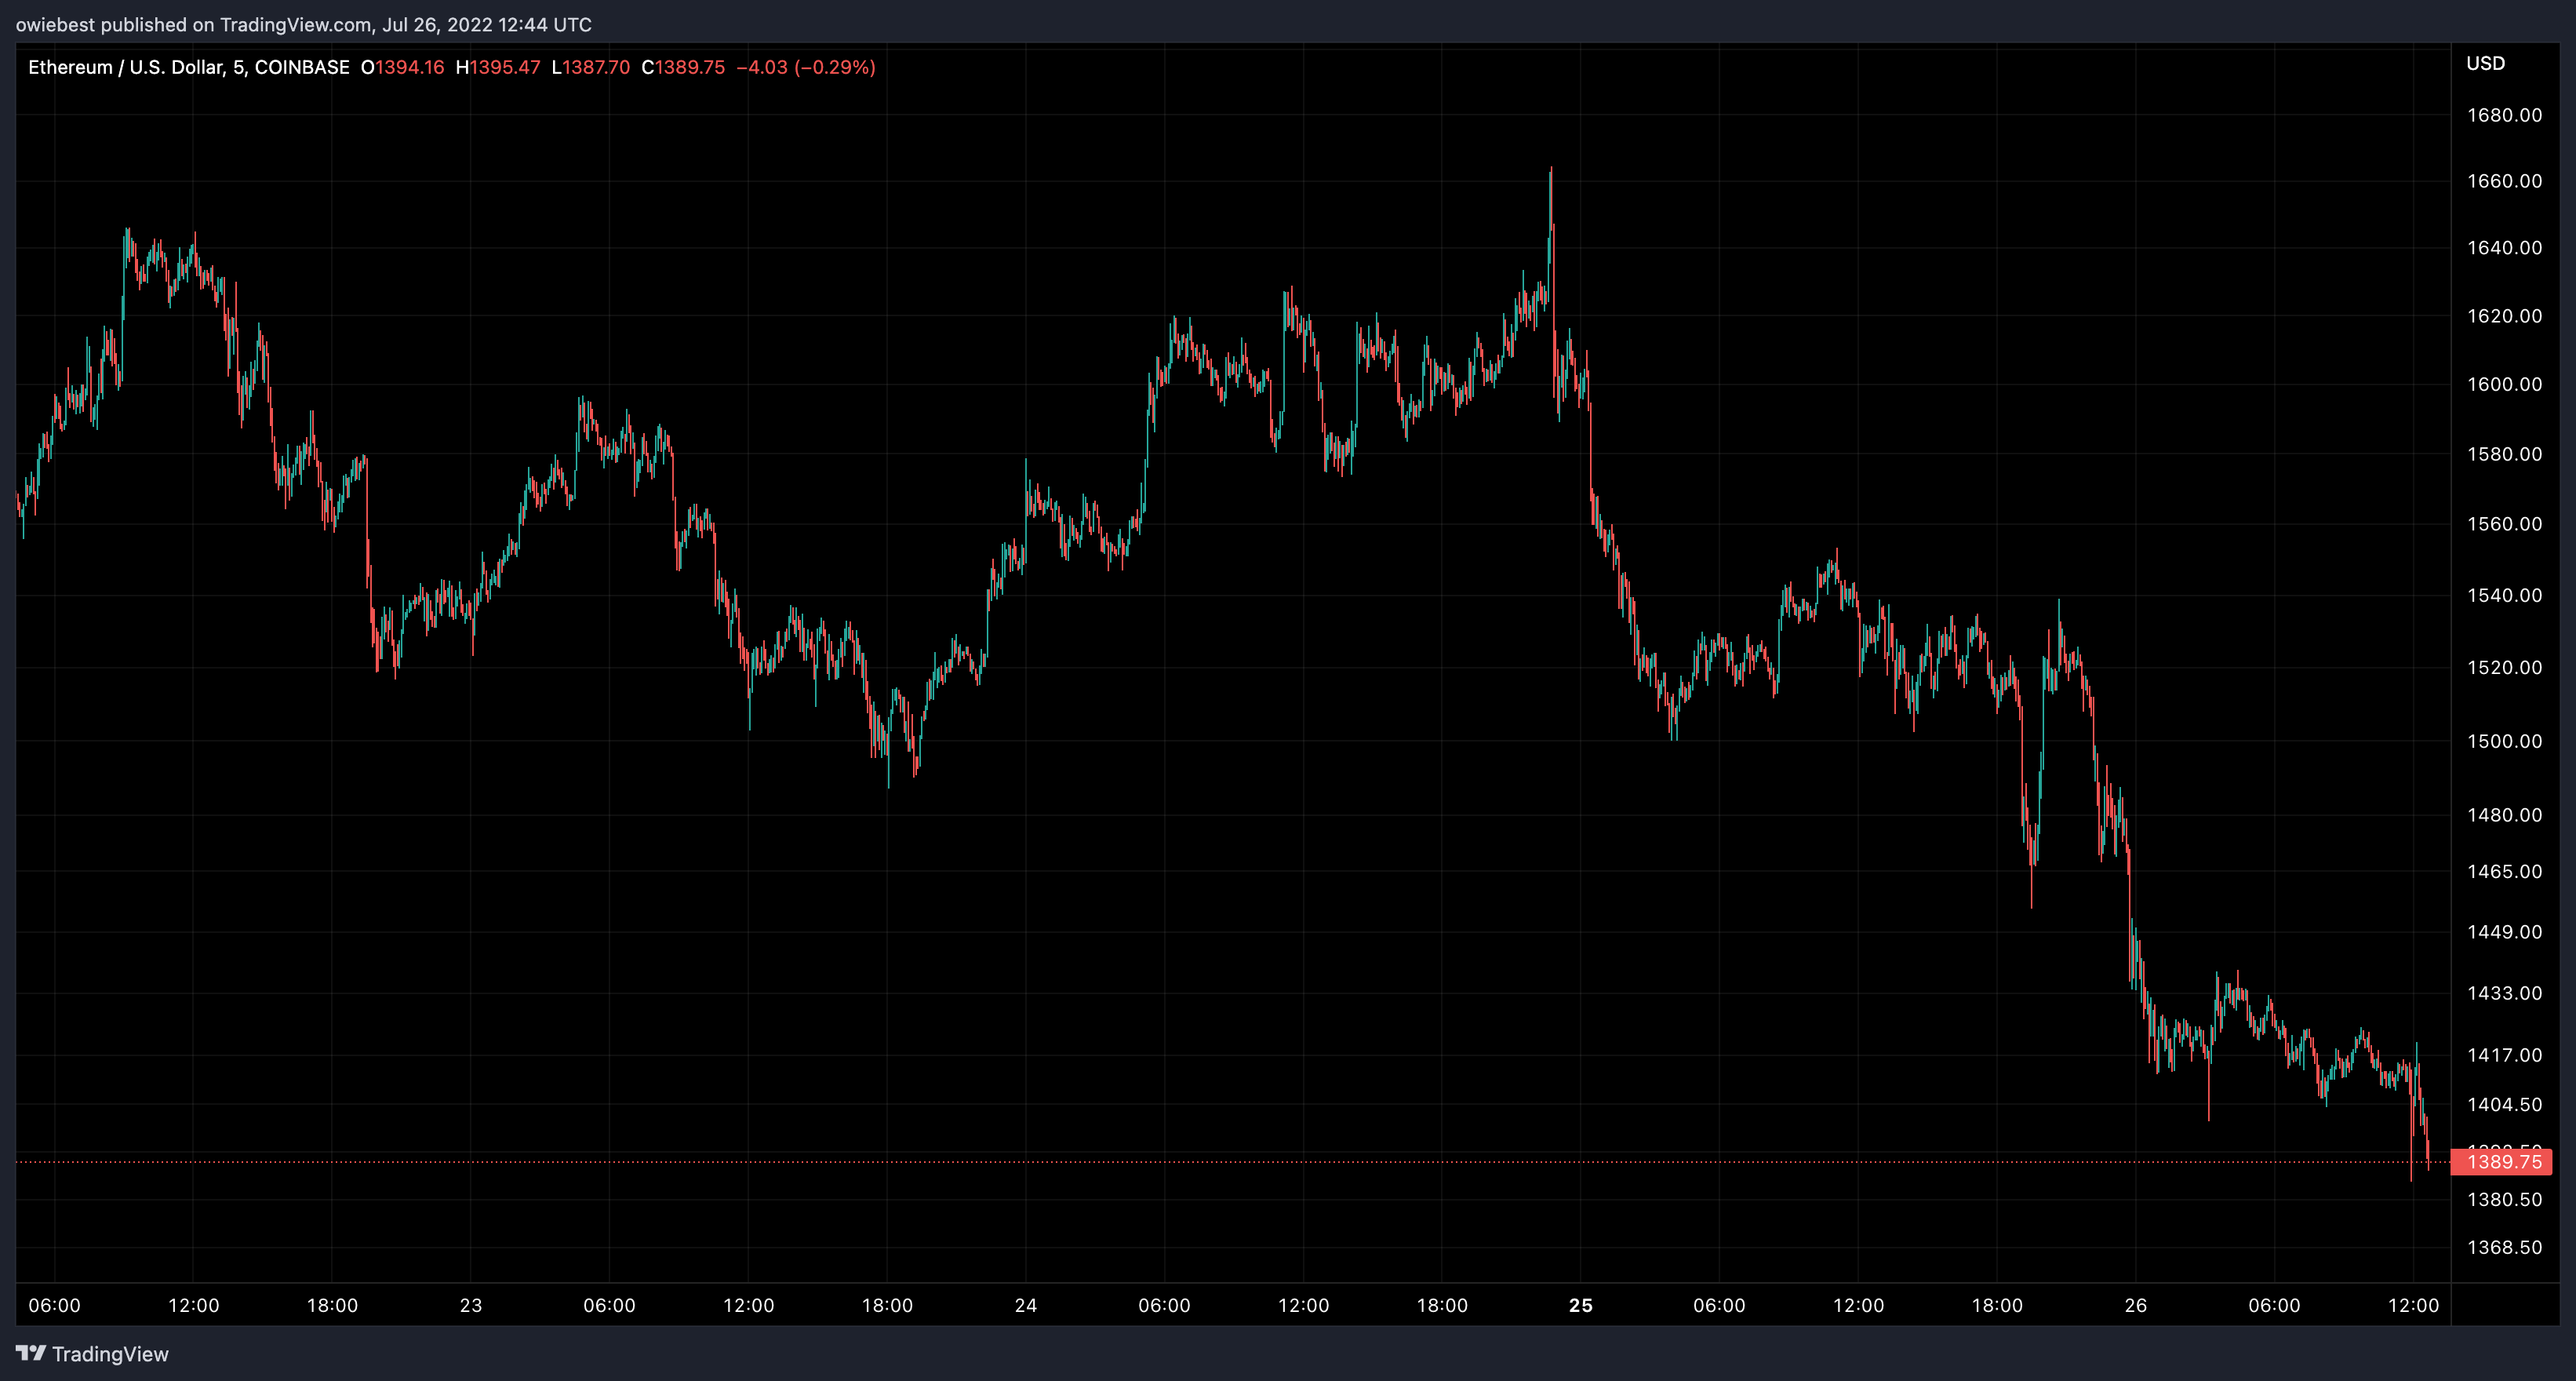
What this data shows is how investors are looking toward the market with the recent recovery. However, given the recent decline in prices, it remains unsure whether the inflows will continue for the new week.

Trending Cryptos

Related Reads

Gate Research Institute: Analysis of Chart Patterns and Breakout Trading Strategies

Gate Research Institute: Chart Pattern Analysis and Breakout Trading Strategies Chart patterns are crucial tools in technical analysis for observing market supply and demand shifts, trend continuations, and reversals. This analysis involves a comprehensive evaluation of trend, volume, support/resistance, time cycles, and breakout validity, not just rote pattern recognition. Patterns are broadly categorized into reversal patterns (e.g., Double Tops/Bottoms, Head and Shoulders) and continuation patterns (e.g., Flags, Triangles, Rectangles). An effective breakout, key for trading, requires clear support/resistance, prolonged consolidation, a prevailing trend backdrop, and volume confirmation. However, breakouts are not guaranteed, as false breakouts are common. Risk must be managed through position sizing, stop-loss orders, pullback confirmations, and profit-taking in stages. Key pattern types discussed include: * **Rectangle Patterns:** Indicate market indecision within parallel support and resistance, with breakouts projecting a move equal to the pattern's width. * **Flag & Pennant Patterns:** Short-term continuation patterns following sharp price moves ("flagpoles"). * **Triangle Patterns:** Symmetrical, Ascending (bullish bias), and Descending (bearish bias) triangles, representing consolidation before a directional move. * **Head and Shoulders Patterns:** Major reversal patterns signaling trend exhaustion. The article details breakout trading strategies, defining valid breakouts by price closing beyond a key level with increased volume and minimal immediate re-entry into the prior range. It contrasts range trading with breakout trading and outlines entry methods (immediate entry, pullback entry, scaling in), stop-loss placement (based on pattern failure), and profit-taking techniques (target-based, structure-based, trend-following). It further classifies breakout outcomes: 1. **Valid Breakouts:** Strong, sustained moves in the breakout direction. 2. **Pullback Breakouts:** Price breaks out, retests the breakout level as support/resistance, then resumes the trend—offering a lower-risk entry. 3. **False Breakouts:** Price briefly breaches a level but quickly reverses back into the prior range, a common risk managed by strict stop-losses. Key validation tools for breakouts include volume analysis, the principle of support/resistance role reversal, and momentum indicators like ATR, Moving Averages, Bollinger Bands, and RSI. In conclusion, while chart patterns and breakout analysis provide a structured framework, their effectiveness relies on multiple confirming factors—trend context, volume, and proper risk management. They should be integrated into a broader trading system rather than used as standalone signals.

marsbit6m ago

Gate Research Institute: Analysis of Chart Patterns and Breakout Trading Strategies

marsbit6m ago

Joseph Chalom: Ethereum is Becoming the "Settlement Layer of Trust" for Global Finance

In a speech titled "The Industrialization of Trust," Sharplink CEO Joseph Chalom (former BlackRock digital assets head) discussed the future transformation of global finance. Drawing from 20 years at BlackRock, where he led the launch of Bitcoin/ETH ETFs and tokenized funds, Chalom highlighted the immense hidden costs of establishing trust in traditional finance—estimated at over $9.3 trillion annually in the US alone due to fragmented systems, multi-day settlements, and countless reconciliations. He argued that Ethereum is emerging as the global financial "settlement layer for trust," with its robust, decentralized infrastructure securing over $300 billion in on-chain assets and most stablecoins and tokenized assets. The future, he stated, will be driven by three accelerating pillars: stablecoins (evolving beyond crypto gateways to become efficient cross-border payment rails), tokenized assets (enabling 24/7 trading and reshaping capital markets), and DeFi (providing automated, accessible financial services). A potential game-changer, Chalom added, is the fourth pillar: "Agentic Finance," where AI agents autonomously execute programmable financial transactions via smart contracts and stablecoins. He envisions individuals soon having AI-powered "CFOs in their pockets" to optimize idle capital and manage tokenized portfolios. This shift, facilitated by Ethereum's trustless settlement, could multiply on-chain transaction volume 1000x within a year, moving finance toward a seamless, digitized future.

marsbit7m ago

Joseph Chalom: Ethereum is Becoming the "Settlement Layer of Trust" for Global Finance

marsbit7m ago

STRC Severely Unpegged, What Risks Is the Market Pricing In?

The article analyzes the recent significant de-pegging of Strategy's perpetual preferred stock, STRC, whose price fell to approximately $89, far below its $100 face value. This discount has pushed its simple yield to around 12.9%, creating a paradox. The stock was designed as a high-yield instrument trading near par, and Strategy maintains an 11.5% annual dividend, even recently switching to semi-monthly payments to support the price. The author explores several reasons why the high yield hasn't attracted enough buying pressure to restore the par value. A key factor is potential reverse deleveraging from carry trades, where leveraged investors may be forced to sell due to margin calls as the price falls, creating a self-reinforcing downward spiral. Additionally, the tokenization and integration of STRC into DeFi protocols (like Apyx, Saturn, Pendle) have introduced faster, more transparent, and potentially more volatile price adjustment mechanisms through leverage and yield-splitting products. The emergence of a competing product, Strive's SATA, offering a 13% yield with daily dividends, has also changed the yield benchmark, challenging STRC's unique high-yield narrative. Furthermore, the market is questioning the distinction between Strategy's substantial Bitcoin reserves, which provide long-term balance sheet coverage, and the certainty of stable near-term cash flow for dividends. Ultimately, the price dip represents a stress test for this type of BTC-backed, high-yield financing tool. The future path of STRC depends on whether Strategy acts to reinforce the $100 peg (e.g., by adjusting dividends), whether DeFi-related leverage unwinds further, and how investors ultimately price the risks of leverage, competition, and cash flow uncertainty against the offered yield.

marsbit18m ago

STRC Severely Unpegged, What Risks Is the Market Pricing In?

marsbit18m ago

LIT Token Hits Six-Month High: How Long Can the Buyback Flywheel Keep Burning Fuel?

The LIT token of decentralized perpetual exchange Lighter surged to a six-month high above $1.90 on June 18th, with a market cap of $425 million. After a price correction earlier this year, the recent rebound is attributed to its core "buyback flywheel" mechanism. All protocol fee revenue is used for programmatic, hourly market buybacks of LIT. Since its TGE in December 2025, approximately 15 million LIT (6% of circulating supply) has been repurchased for around $21 million. Additional price support comes from the LLP (Lighter Liquidity Pool), where providers must stake LIT worth 10% of their deposited USDC, locking significant token supply. However, challenges persist. Trading volume has declined amidst a sluggish market, with total volume at $1.68 trillion, significantly lower than leading competitor Hyperliquid's $4.37 trillion. While Lighter focuses on perpetual contracts, RWA, and Pre-IPO markets, Hyperliquid has expanded into prediction markets and boasts a U.S. spot ETF, attracting institutional investment and influencer endorsements like from Arthur Hayes. In contrast, LIT currently lacks similar high-profile backing. With 75% of LIT's total 1 billion supply still locked (team and investor tokens begin a 3-year linear unlock in December 2026), there is no immediate unlock selling pressure. The token's future performance hinges on sustaining trading volume growth, successful product iteration, and executing its transparent buyback strategy against a dominant competitor.

Foresight News37m ago

LIT Token Hits Six-Month High: How Long Can the Buyback Flywheel Keep Burning Fuel?

Foresight News37m ago

Trading

Spot
Futures

Hot Articles

Discussions

Welcome to the HTX Community. Here, you can stay informed about the latest platform developments and gain access to professional market insights. Users' opinions on the price of ETH (ETH) are presented below.

活动图片