Том Ли раскрывает свою зону покупки Ethereum и создает мощный рыночный сигнал

cryptonews.ruPublished on 2025-06-19Last updated on 2025-08-20

  • Рынок раскололся: биткоин стабилизируется, а эфириум переживает более резкие еженедельные потери.
  • Поддержки Ethereum на уровнях $4100, $3665 и $3374 находятся под пристальным вниманием.
  • Ожидается краткосрочная волатильность, но более широкий восходящий тренд криптовалют остается структурно неизменным.

Рынок криптовалют продолжает оставаться расколотым. Биткоин упал всего на несколько процентов от своих максимумов, что некоторые называют всего лишь «вспышкой на радаре». Другие, напуганные красными графиками и медвежьими миниатюрами, утверждают, что слабость эфириума и альткоинов может быть первым признаком чего-то большего.

Пока крипторынок обсуждает небольшое падение биткоина, опытный стратег Том Ли продемонстрировал свои возможности в Ethereum. Ли заявил, что будет уверен в покупке, если ETH откатится до диапазона $4075–$4150, что послужит мощным сигналом для всего рынка.

Том Ли даже обозначил целевую зону для Ethereum, заявив, что он рассмотрит возможность покупки, если к середине недели ETH вернется к диапазону $4075–$4150.

По словам аналитика, значение заключается не только в самой цифре, но и в весе капитала Ли. «Когда кто-то, управляющий миллиардами, публично обозначает уровень, рынок, как правило, опережает его», — пояснил один аналитик. «Эфиру внезапно становится очень сложно пробиться ниже этой зоны, потому что все знают, что там ждут реальные деньги».

Проанализировав данные CoinEdition о падении цены биткоина до $115 тыс. в ожидании выступления председателя ФРС Пауэлла в Джексон-Хоуле, трейдеры обнаружили, что заявление Ли является явным якорем уверенности в отношении Ethereum.

Казначейские фирмы управляют циклом

Помимо сигналов опытных трейдеров, институциональные казначейские компании всё чаще рассматриваются как главная движущая сила этого цикла. Такие компании, как SharpLink, уже накопили огромные запасы Ethereum, недавно приобретя 145 000 ETH на сумму около 667 миллионов долларов. Менее чем за год SharpLink стала контролировать более 2% предложения ETH, опередив даже темпы знаменитого накопления биткоинов MicroStrategy.

Аналитик отметил, что скорость, с которой эти компании направляют капитал, меняет рынок. Объёмы торгов казначейских компаний теперь сопоставимы с объёмами торгов традиционных криптовалютных бирж.

Что ждет Ethereum дальше?

Ethereum торгуется на уровне $4169, упав более чем на 10% за последнюю неделю. Токен протестировал поддержку вблизи $4100, которая ранее служила сильным сопротивлением, что делает его ключевой зоной для отслеживания.

Если эта область удержится, может последовать отскок, но возможен и более глубокий откат, при этом более низкие поддержки будут наблюдаться около $3665 и $3374.
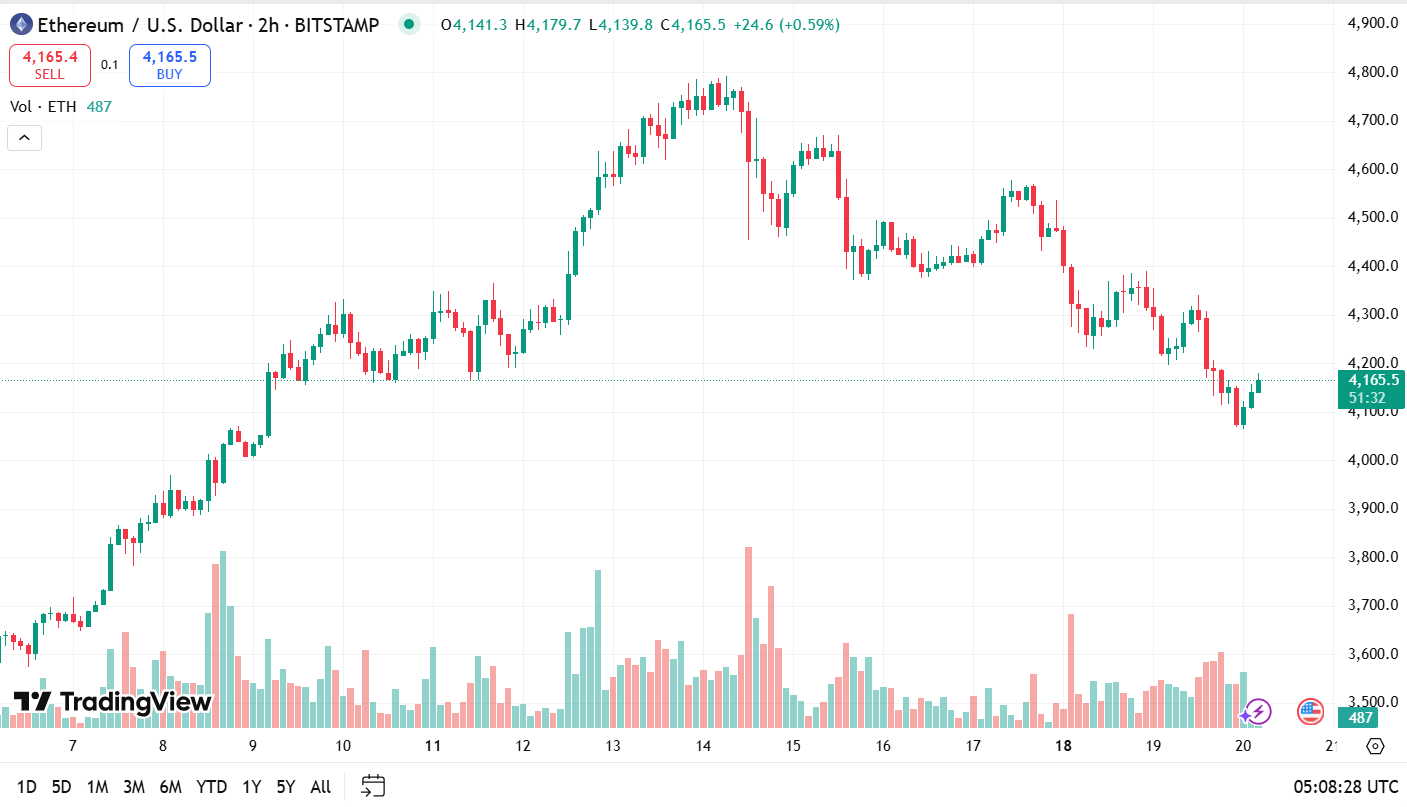
Источник: Tradingview

Подробный анализ текущей ценовой динамики можно найти в нашем прогнозе цены Ethereum (ETH) на сегодня. Пока эти ключевые зоны сохранятся, общий восходящий тренд останется устойчивым.


Trending Cryptos

Related Reads

BofA Research Report Analysis: Marvell Takes TPU Peripherals, Broadcom Holds Core Value of $250 Billion

Bank of America's report analyzes the impact of Google's new custom chip agreement with Marvell on the TPU supply chain. While Marvell secured a deal for "XPU-attach" chips (like AI inference accelerators and memory controllers), corresponding to a potential $120B in cumulative purchases, BofA argues the core high-value components remain with Broadcom. Broadcom retains design and supply for the core ASIC, advanced packaging, HBM integration, high-speed SerDes, and network switching/physical layer connectivity. These form the highest Bill-of-Materials (BOM) value in TPU systems. BofA estimates Google's 5-year capex could reach $1.5-$2T, with TPU systems representing 25-30% ($400B-$600B TAM). Within this, Broadcom is projected to hold a 55-60% value share ($250B-$350B), Marvell 10-20% ($50B-$100B), and MediaTek 20-30% in lower-value, cost-optimized chips. The report emphasizes Broadcom's entrenched position through long-term agreements locked until CY31, increasing silicon content per TPU generation, and high unit value creating a competitive barrier. It sets a $530 price target for Broadcom (30x CY27 P/E), viewing current valuation as attractive given growth certainty from AI and locked leadership. Downsides include semiconductor cycles, customer concentration, and debt. In conclusion, while competition reshapes the supply chain for peripheral chips, the core high-value structure and Broadcom's dominance in compute silicon remain intact.

marsbit17m ago

BofA Research Report Analysis: Marvell Takes TPU Peripherals, Broadcom Holds Core Value of $250 Billion

marsbit17m ago

Semiconductor Mid-Game Check-in: How Much Left in the Tail-End Rally?

Semiconductor Mid-Game Review: How Much is Left in the Rally? This analysis compares the current semiconductor market trend to NVIDIA's trajectory in 2024, drawing lessons on identifying market tops and bottoms. In July-August 2024, NVIDIA's stock fell 33%, triggered by a combination of "fundamental rumors" (Blackwell delays, antitrust probes) and "macro-driven asset selling" (BOJ rate hike leading to carry-trade unwinding). The low was marked by extreme panic selling across global markets. Key characteristics of a TOP include: Technical patterns like double tops or failure to break highs; Overcrowded and leveraged positioning (e.g., excessive retail and ETF inflows into a single stock like NVDA); High fragility where even a minor fundamental disappointment (e.g., a slight margin dip in stellar earnings) triggers a sharp correction. The practical action is to reduce exposure upon seeing technical warning signs combined with crowded trades. Key characteristics of a BOTTOM include: Technical reversal signals like a high-volume bullish engulfing pattern after a steep drop; Panic indicators hitting extremes (e.g., record VIX, major index crashes) signaling selling exhaustion; The downturn being driven by macro or systemic shocks unrelated to the company's core business fundamentals, creating a mispricing that quality companies eventually recover from. The conclusion is that while the current semiconductor rally may be in its later stages ("fish tail"), understanding these patterns—where tops form from crowded optimism and bottoms from panic unrelated to fundamentals—can help navigate remaining volatility.

marsbit37m ago

Semiconductor Mid-Game Check-in: How Much Left in the Tail-End Rally?

marsbit37m ago

Trading

Spot

Hot Articles

Discussions

Welcome to the HTX Community. Here, you can stay informed about the latest platform developments and gain access to professional market insights. Users' opinions on the price of ETH (ETH) are presented below.

活动图片