Прогноз цены Ethereum (ETH) на 31 июля

cryptonews.ruPublished on 2025-07-27Last updated on 2025-07-30

После параболического прорыва, поднявшего цену Ethereum с $2800 почти до $3850 всего за две недели, ралли демонстрирует первые признаки истощения. Сегодня цена Ethereum консолидируется вблизи $3758 после нескольких неудачных внутридневных попыток превысить $3800. В условиях снижения волатильности и уменьшения объёмов торгов трейдеры ждут решения быков в верхней части трендового канала.

Что происходит с ценой Ethereum?
Прогноз цены ETH (Источник: TradingView)

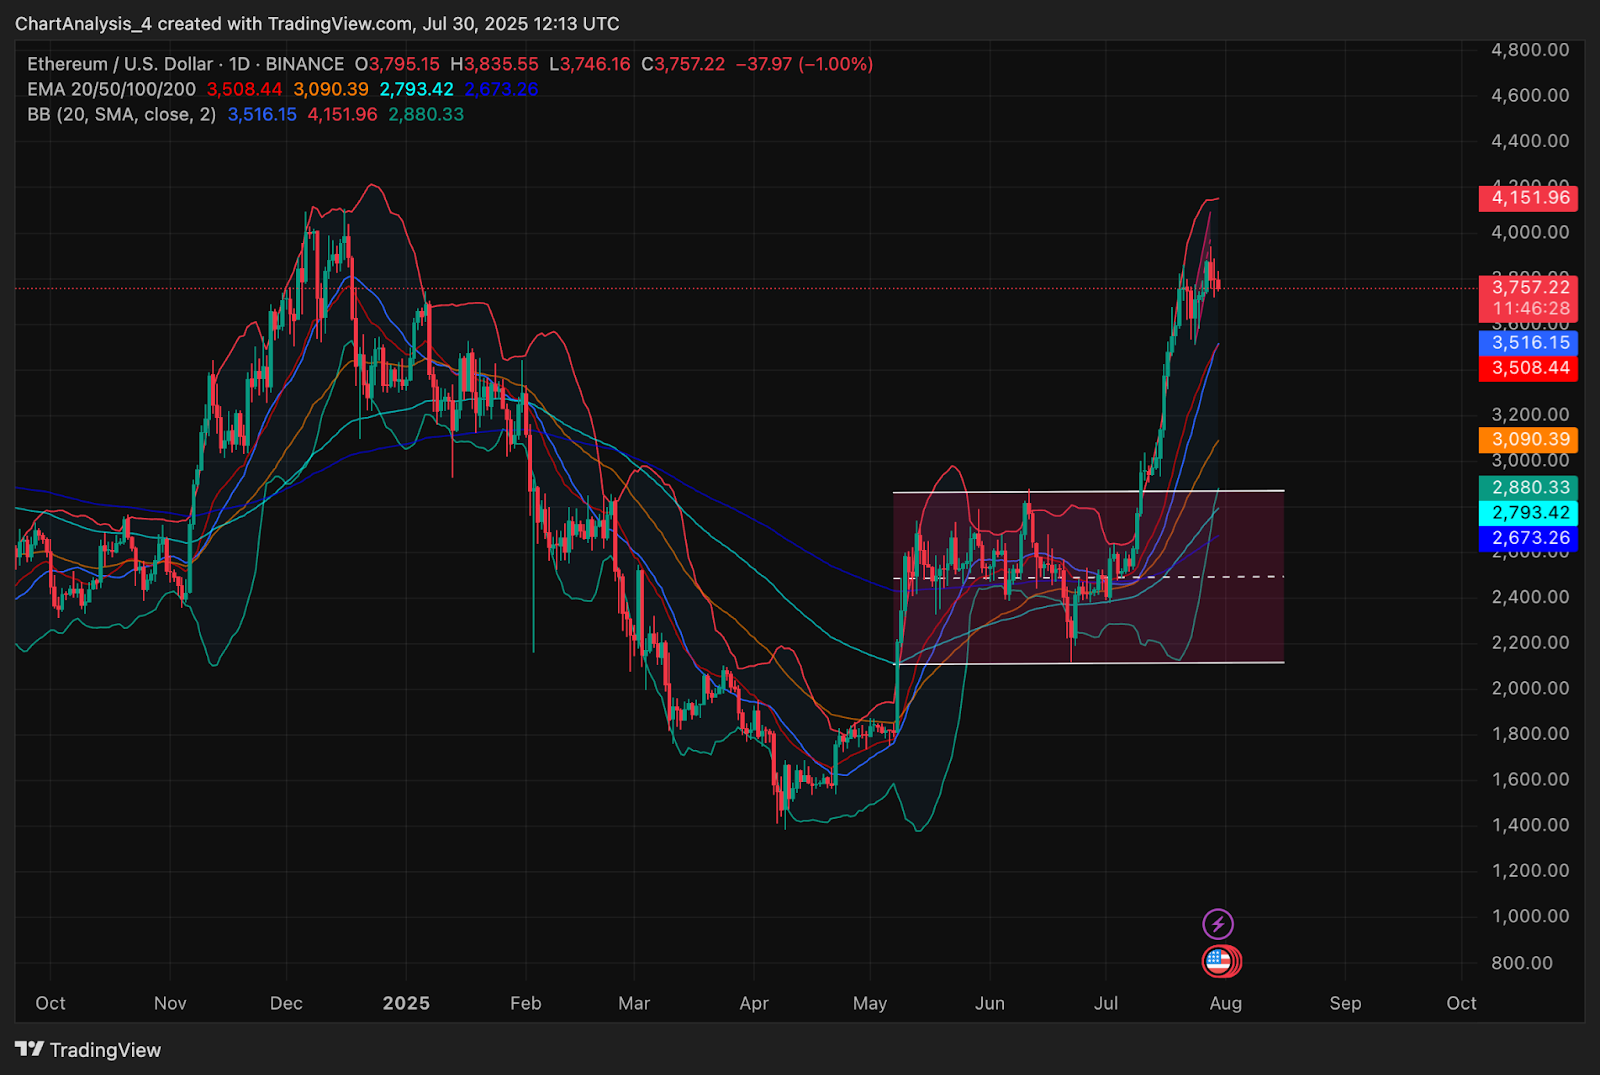
Дневная структура показывает, что ETH испытывает сопротивление чуть ниже верхней полосы Боллинджера на уровне $4151, что исторически совпадает с локальными пиками. Свечи формируют более мелкие тела и тени вблизи сопротивления $3835, что подтверждает давление предложения.

Полосы Боллинджера остаются широкими, отражая высокую историческую волатильность. Однако цена начинает замедляться вблизи верхней границы канала. Все экспоненциальные скользящие средние (20/50/100/200) в настоящее время расположены ниже, формируя бычий тренд, при этом EMA20 и EMA50 находятся вблизи отметок $3508 и $3090 соответственно. Любое падение в эту зону может привлечь агрессивных покупателей.
Прогноз цены ETH (Источник: TradingView)

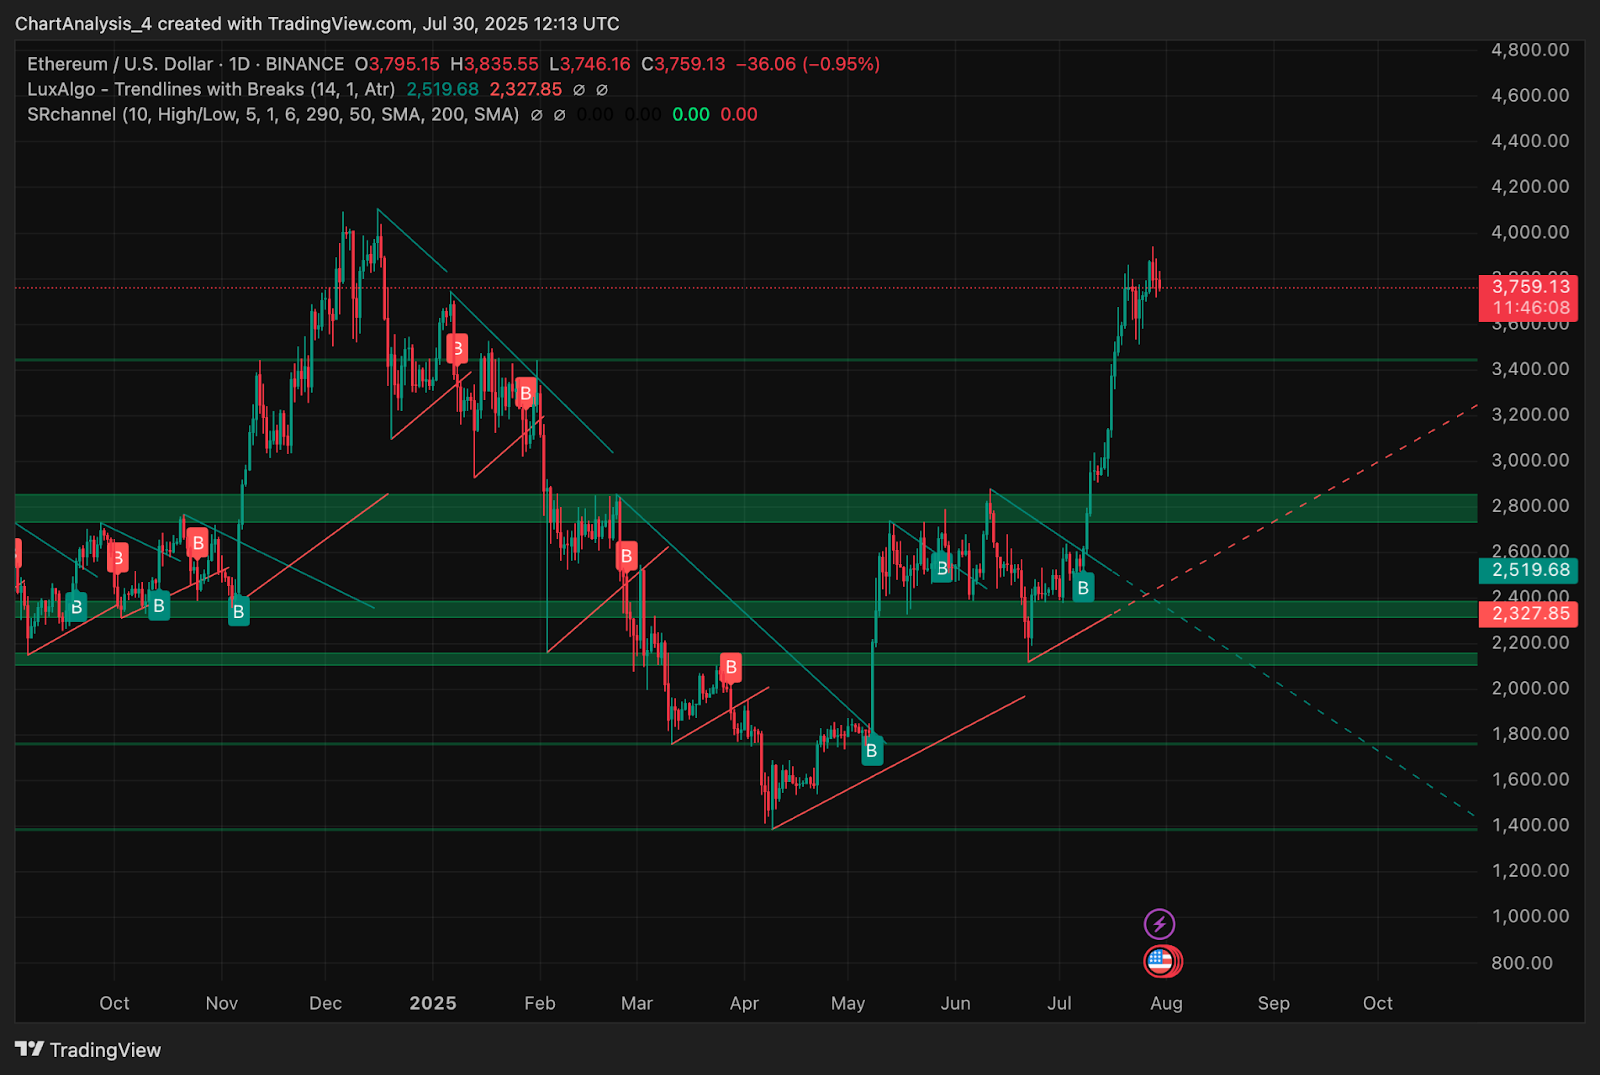
Трендовые линии на втором графике демонстрируют прорыв диапазона $2800, при этом Ethereum сейчас повторно тестирует верхнюю границу восходящей параллельной структуры. Ключевая зона поддержки для быков находится вблизи $3516, а точка начала прорыва — около $3090. Чистая потеря этих областей может свести на нет текущий импульсный отрезок.

Почему цена Ethereum сегодня падает?


Прогноз цены ETH (Источник: TradingView)

Несмотря на сильную макроэкономическую бычью структуру, в краткосрочной перспективе наблюдаются продажи. На 30-минутном графике цена Ethereum пробила нисходящий канал, колеблясь между сопротивлением $3820 и поддержкой $3720. RSI на этом таймфрейме опустился до 34,3, что указывает на внутридневную слабость и медвежий настрой, если только цена не поднимется выше 50. VWAP (средневзвешенная по объёму цена) находится на уровне $3798, при этом ETH торгуется ниже этого значения.


Прогноз цены ETH (Источник: TradingView)

Уровень супертренда на $3709 играет ключевую роль. Пробой ниже этого уровня может спровоцировать краткосрочную ликвидацию к $3516 или даже $3300. Это отражает краткосрочные медвежьи настроения. Тем временем, индекс направленного движения (DMI) на 4-часовом графике показывает снижение ADX, в то время как -DI загибается вверх, что указывает на то, что покупатели теряют контроль над трендом.


Прогноз цены ETH (Источник: TradingView)

Индекс денежного потока (MFI) поднялся до 76,18, что указывает на перекупленность и возможное распределение. Параболический индикатор SAR также приблизился к цене, указывая на риск разворота, если быкам не удастся защитить зону супертренда $3700–$3709.


Анализ производных ETH (Источник: Coinglass)

С точки зрения потоков, чистый спотовый отток по состоянию на 30 июля составил -137,71 млн. Это свидетельствует о значительной фиксации прибыли и поддерживает текущее снижение цены Ethereum.

Прогноз цены ETH: краткосрочный прогноз (24H)

Если ETH удержится на уровне $3709 и отыграет $3800 за счёт объёма, вероятным станет движение к $3940 и $4000. Однако, если цена не удержится выше VWAP на уровне $3798, это повысит риск пробоя к $3516. Ниже этого диапазона диапазон $3090–3100 выступает в качестве зоны структурной проверки.

Подтверждённая потеря поддержки 30-минутного канала и отскок от VWAP откроет путь к более глубокой коррекции в районе $3300. Учитывая угасающий MACD, медвежьи сигналы RSI и давление оттока, цена Ethereum сегодня выглядит уязвимой для краткосрочного снижения, если быки не смогут быстро восстановить ключевые уровни.

Таблица прогноза цены Ethereum: 31 июля 2025 г.

Индикатор/Зона Уровень/Сигнал
Цена Ethereum сегодня $3,758
Сопротивление 1 $3,800
Сопротивление 2 $3,940 to $4,000
Поддержка 1 3709 долларов США (Supertrend, 4H)
Поддержка 2 3516 долларов США (средняя полоса Боллинджера)
Кластер EMA (20/50/100/200) $3,508 / $3,090 / $2,793 / $2,673
VWAP (30 мин) 3798,5 долл. США (краткосрочное сопротивление)
RSI (30 мин) 34.3 (медвежий)
МФО (ежедневно) 76,2 (Перекупленность, риск фиксации прибыли)
DMI (4H) -DI сворачивается, ослабевающий тренд
Spot Netflow -$137,71 млн (отток, медвежье давление)
САР (ежедневно) 3552 долл. США (конечная поддержка)

Trending Cryptos

Related Reads

BitMart's Final 9 Days: A True Exchange Crisis Is Never About Shutting Down

BitMart's Final 9 Days: A True Exchange Crisis Is Not About Shutting Down On August 17, 2026, with just 9 days until BitMart's scheduled cessation of trading, the focus shifted from the platform's orderly closure to serious questions about user withdrawals, platform solvency, employee payments, and reserve transparency. Stakeholders, claiming to represent users and staff, publicly demanded asset/liability disclosures, explanations for withdrawal delays, a user repayment plan, and an independent audit, setting an August 19 deadline. While BitMart CEO Sheldon Lee denied allegations of insolvency or wrongdoing, the controversy highlighted a core vulnerability of centralized exchanges (CEXs). When an exchange announces its shutdown, normal user behavior changes dramatically, triggering a mass withdrawal event—the ultimate stress test for its liquidity and custodial integrity. The key question becomes not whether the platform has assets, but whether it holds sufficient *liquid* assets to cover all user liabilities on demand. The article argues that the trust placed in CEXs is based on the convenience they provide, abstracting users from direct control of their private keys. This trust is rarely questioned during normal operations but becomes critically exposed during a wind-down. The situation underscores the limitations of simple Proof of Reserves, which shows "what we have" but not the crucial "what we owe." True financial credibility requires transparent, auditable data on assets, liabilities, and segregated user funds. BitMart's situation reflects a broader, often overlooked issue in the crypto industry: while there is extensive focus on growth mechanisms for exchanges, there is little discussion or established protocol for a safe and transparent "exit mechanism." The final measure of an exchange's integrity, the article concludes, is not its user count or trading volume during a bull market, but its ability to ensure every last user can successfully withdraw their assets when the doors are closing. The outcome will be determined not by statements, but by whether the final user's funds securely leave the platform.

marsbit15m ago

BitMart's Final 9 Days: A True Exchange Crisis Is Never About Shutting Down

marsbit15m ago

Don't Speculate on 100x Coins, Just Bet on 'Cash Cows': Which Projects Are Worth Dollar-Cost Averaging in the Bear Market?

In a bearish crypto market, finding sustainable investments is more prudent than chasing speculative meme coins. This article analyzes projects generating consistent revenue, highlighting them as potential "cash cows" for long-term dollar-cost averaging (DCA). The top performers are "picks-and-shovels" plays. **Pump.fun**, a Solana-based meme coin launchpad, leads with $415.3M in monthly revenue, profiting from a 1.25% fee on token transactions. Despite market volatility, it has averaged tens of millions in monthly income in 2024. Perpetual DEX **Hyperliquid** stands out as a "bear market star," accumulating ~$352M in revenue over seven months. Its model funnels ~99% of fees into buying back and permanently burning its HYPE token. Established giants are also adapting. **Uniswap**, after enabling its fee switch, now earns protocol revenue (e.g., $5.6M recently), which is used to buy back and burn UNI, giving the token direct value accrual. Similarly, oracle provider **Chainlink** generates stable monthly revenue (~$4.57M recently) from its essential data, cross-chain, and automation services. Its new Payment Abstraction feature automatically converts service fees into LINK, accruing value in its treasury. The core thesis is clear: in a downturn, focus on projects with proven, resilient business models—those acting as essential infrastructure or capturing consistent transaction fees—rather than speculative narratives.

marsbit30m ago

Don't Speculate on 100x Coins, Just Bet on 'Cash Cows': Which Projects Are Worth Dollar-Cost Averaging in the Bear Market?

marsbit30m ago

Trends in U.S. Stocks (August 18): U.S.-Iran Deal Prospects Dim, Major Indices See Two Consecutive Down Days, Chip Stocks Defy Market Decline

**Market Overview:** On August 18th, U.S. stock indices declined for a second consecutive day. The S&P 500 fell 0.52%, the Dow dropped 0.51% to a two-week low, and the Nasdaq slipped 0.32%. The decline was driven by heightened geopolitical risk as U.S.-Iran negotiations reached a key deadline without an extension, dimming the prospect of a long-term agreement. **Key Drivers:** * **Geopolitics & Oil:** The failure to extend the U.S.-Iran memorandum led to a surge in oil prices, with Brent crude closing above $90/barrel for the first time in three weeks. * **Treasury Yields:** The 30-year U.S. Treasury yield hit a high not seen since 2007, driven by heavy corporate issuance (notably for AI investments) and ongoing fiscal deficits. * **Sector Performance:** While the "Magnificent Seven" tech giants all closed lower, semiconductor stocks bucked the trend. The Philadelphia Semiconductor Index rose 1.6%, led by memory chipmakers (e.g., SanDisk, Micron) and optical communication companies, as investors focused on the strong demand outlook for AI-related hardware. * **Currency & Safe Havens:** The U.S. Dollar Index fell for a third day, while the offshore Chinese Yuan hit a three-year high. Gold prices rose to a two-month peak, supported by safe-haven demand outweighing pressure from rising yields. Bitcoin also gained. **Outlook:** Market focus remains on potential escalation in the Middle East and its impact on oil, alongside continued scrutiny of AI-related earnings and demand signals.

marsbit36m ago

Trends in U.S. Stocks (August 18): U.S.-Iran Deal Prospects Dim, Major Indices See Two Consecutive Down Days, Chip Stocks Defy Market Decline

marsbit36m ago

Trading

Spot

Hot Articles

Discussions

Welcome to the HTX Community. Here, you can stay informed about the latest platform developments and gain access to professional market insights. Users' opinions on the price of ETH (ETH) are presented below.

活动图片