数据揭秘:SOL都在谁手里?

Odaily星球日报Published on 2025-07-23Last updated on 2025-07-24

Abstract

3万个钱包控制着54%的SOL总供应;120个钱包持有大于100万枚SOL;SOL流通供应量的71%正在被质押。

原文作者:Ignas,DeFi 研究员
编译|Odaily星球日报(@OdailyChina
译者|CryptoLeo(@LeoAndCrypto

数据揭秘:SOL都在谁手里?


刚刚,DeFi 研究员 Ignas 撰文分析了 SOL 代币的分布情况,包括质押中的 SOL,锁仓质押的 SOL 数据,还有钱包持有 SOL 数额的比例,Odaily星球日报将其编译如下:


去年,我写了 ETH 的分布情况,Eekeyguy 制作了一个很棒的公开仪表板来检查 ETH 都存在哪里。现在轮到 SOL 了。


数据显示: 88% 的 SOL 供应量正在流通,约为 5.3817 亿枚。

数据揭秘:SOL都在谁手里?


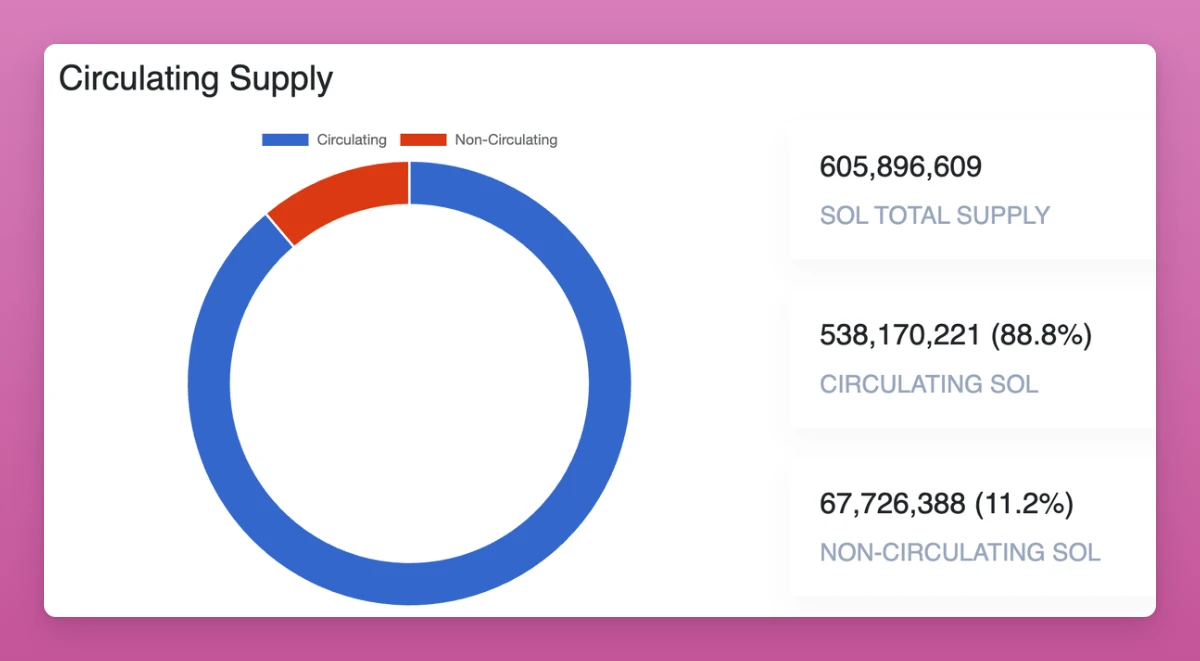
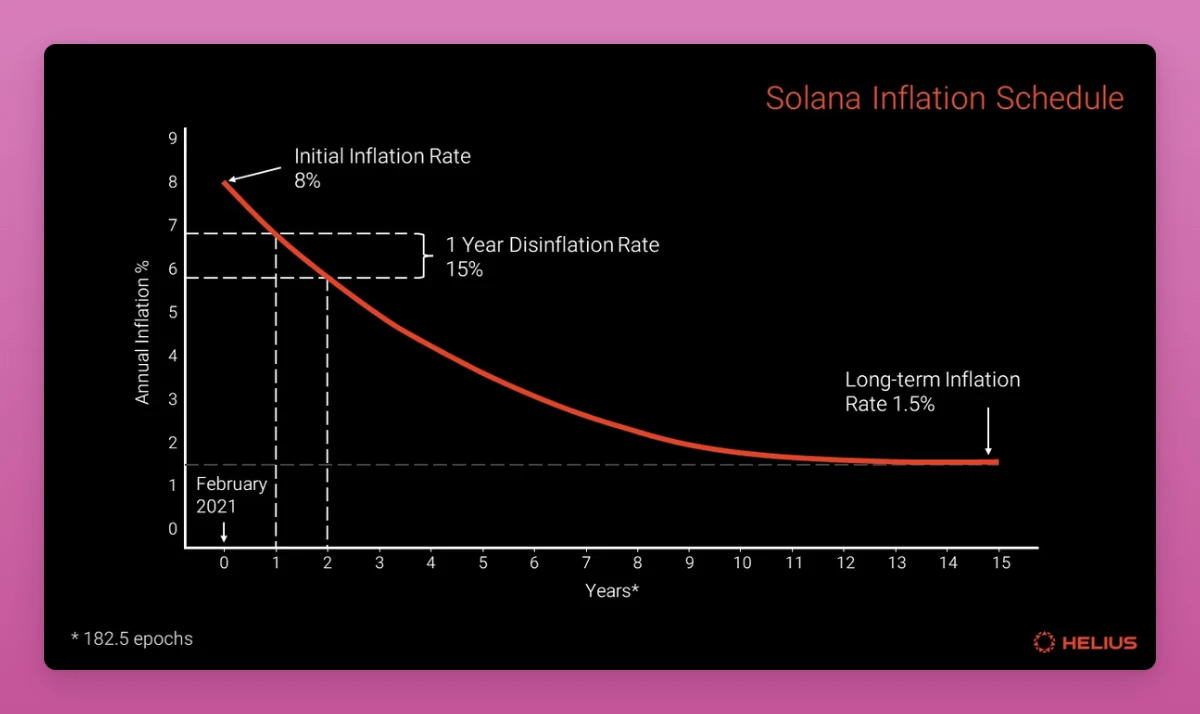
需要注意的是,Solana 的总供应量没有上限(像 ETH 一样),通胀率为 4.395% ,年通缩率为 15% ,最终通胀率应稳定在 1.5% 。

数据揭秘:SOL都在谁手里?


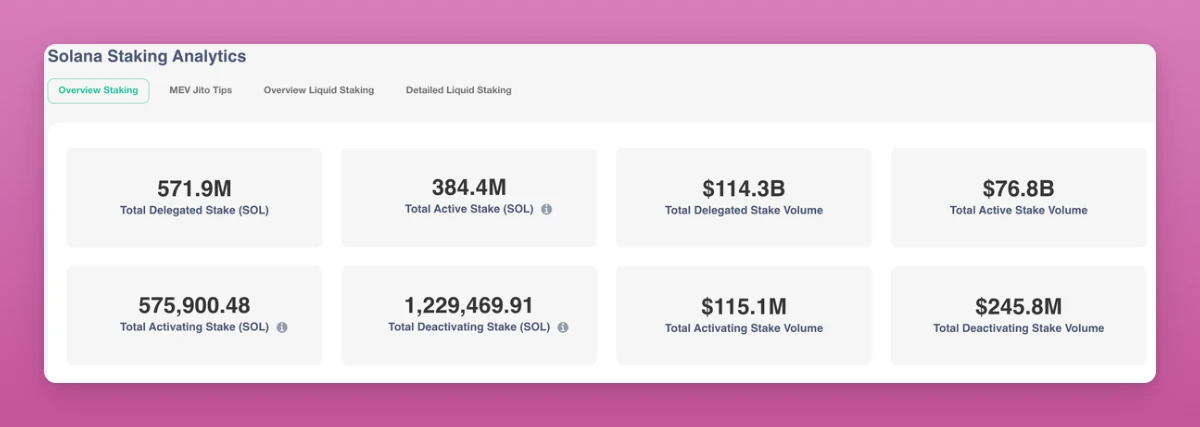
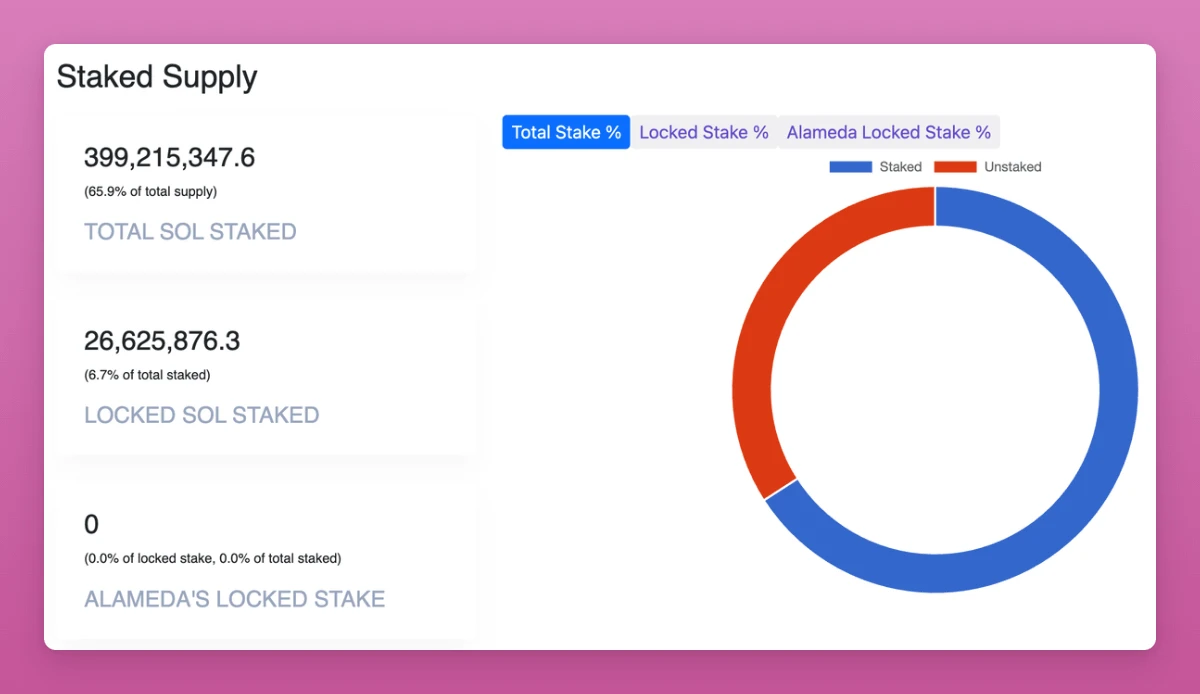
Solscan 数据显示, 71% 的 SOL 流通供应量正在被质押。(而 ETH 为 30% 。)

数据揭秘:SOL都在谁手里?


Solanacompass数据显示, 6.7% 的 SOL 正在被锁仓质押,或为风投/团队/内部人士行为,但我无法弄清这部分 SOL 的持有人具体是谁。

数据揭秘:SOL都在谁手里?


根据 Messari 数据, 99.88% 的 SOL 解锁已完成。目前“锁定”的代币仅有 60 万枚 SOL,由 FTX 持有(或已在场外交易中出售)。

数据揭秘:SOL都在谁手里?


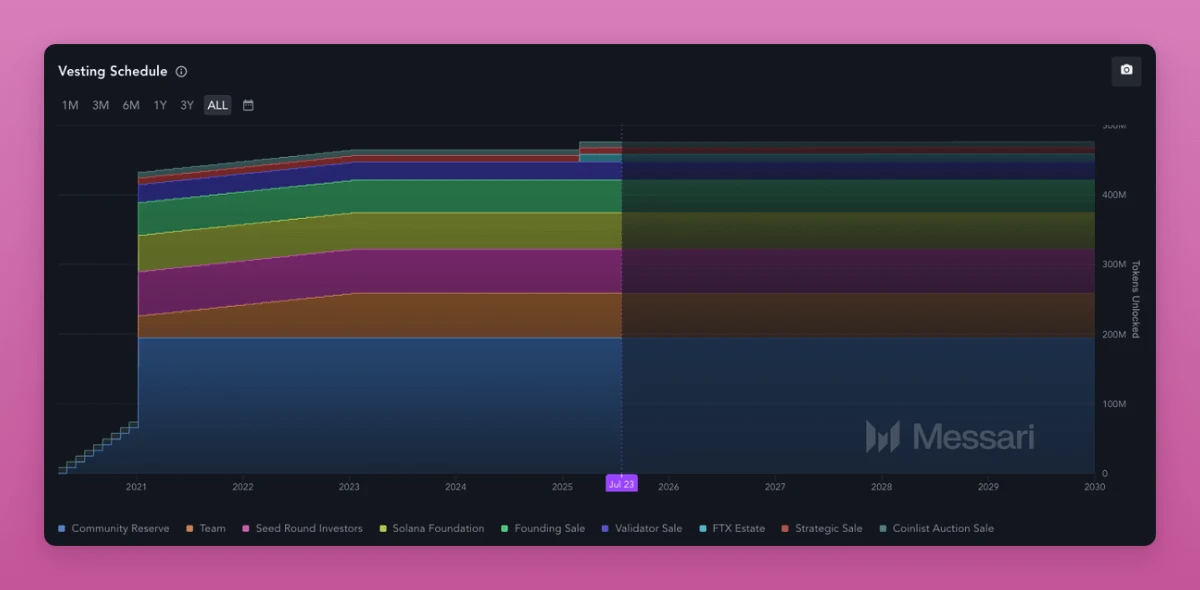
那么,Solanacompass 和 CMC 报告的 11.2% 锁仓的 SOL 代币究竟是什么呢?
机构 SOL 持有者

据 Arkham Intelligence 数据,Coinbase 持有价值 50 亿美元的 SOL,占 SOL 总供应量的 4.7% 。

数据揭秘:SOL都在谁手里?


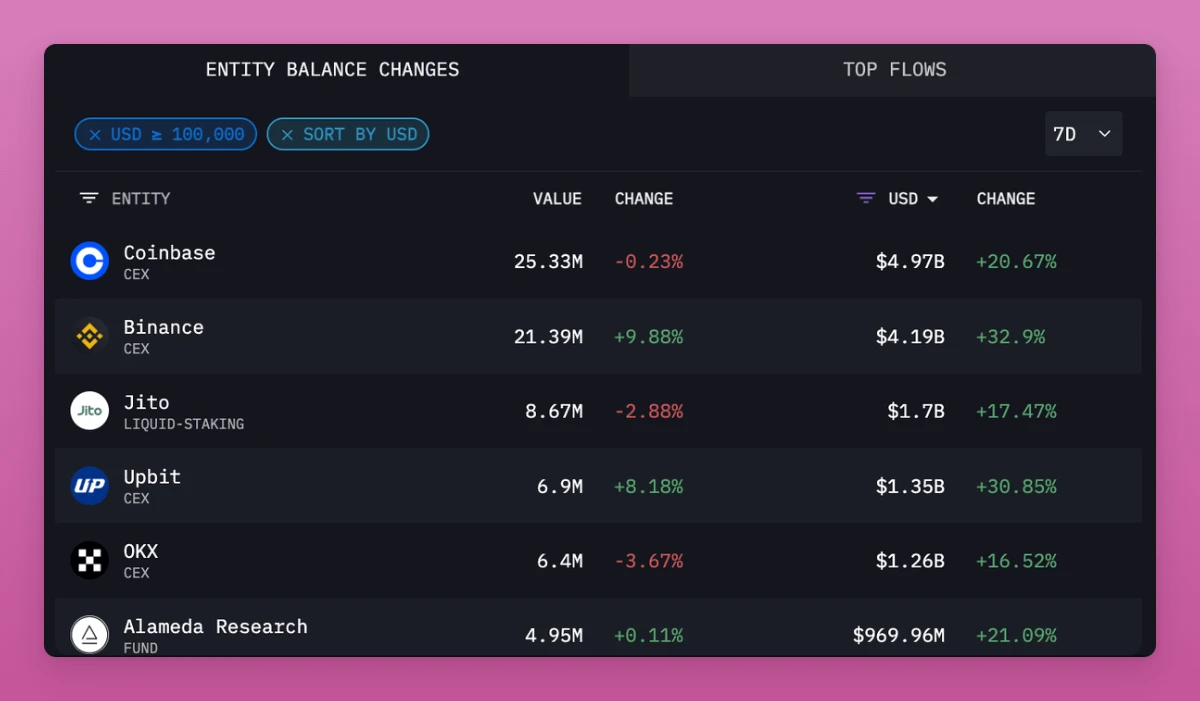
此外,还有一些机构也持有大额 SOL,数据如下:

  • 币安 - 3.97% 
  • Jito - 1.61% 
  • Upbit - 1.28% 
  • OKX - 1.19% 
  • Alameda - 0.92% (或是 Messari 提到的部分锁仓代币)
  • Marinade Finance - 0.79% 
  • Robinhood - 0.74% 
  • Kraken - 0.53% 
  • Bybi - 0.49% 
  • Jump Crypto - 0.33% 
  • Crypto com - 0.33% 
  • Wintermute -  0.14% 
  • Bitstamp - 0.13% 

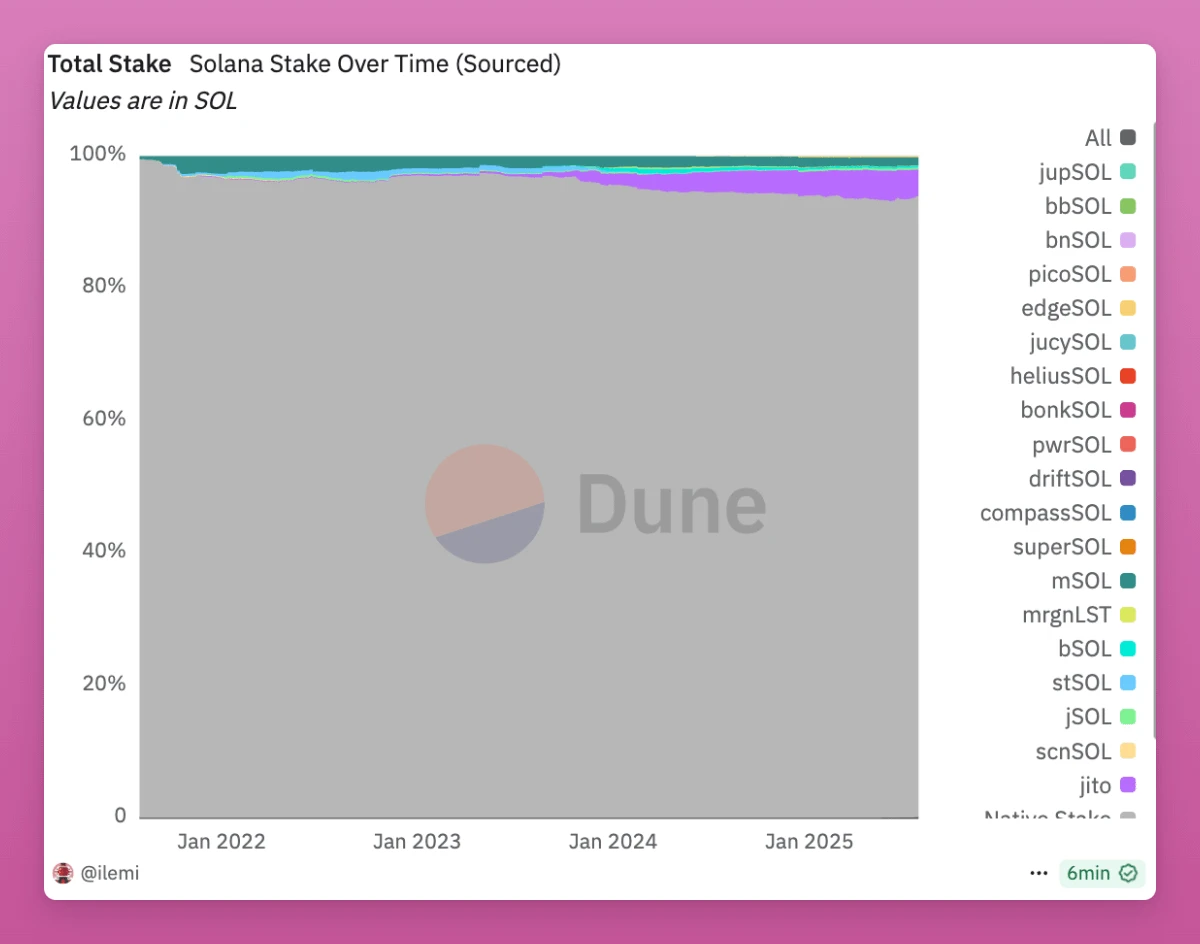
总之,Arkham 可以追溯到 SOL 流通供应的 20% 数据。此外,我们还可以通过数据平台 Dune 来发现更多 SOL 持有和质押实体。

数据揭秘:SOL都在谁手里?


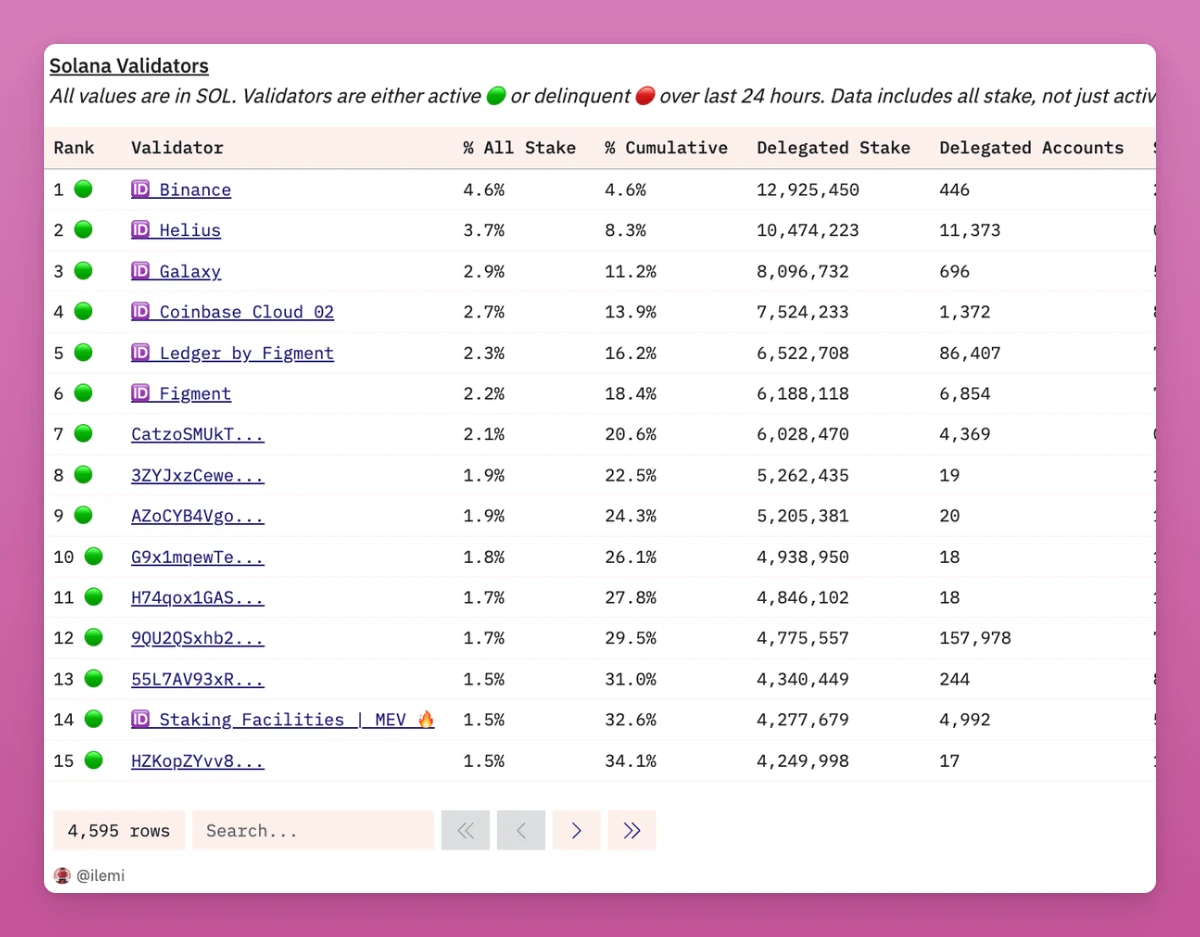
上图显示,除了前文提到过的币安、Coinbase 外,还可以看到 Helius 拥有 3.7% 的活跃质押供应。此外 Galaxy 拥有 800 万枚质押 SOL 委托,还有 Ledger、Figment、Kiln 1、Everstake 等。但前 15 名中很多钱包都为标记。令人惊讶的是只有 6.6% 的 SOL 是来自流动性质押代币 LST,这限制了 DeFi 的增长潜力,如果 SOL 的原生质押比例再高一点,质押全部来自 LST ,Solana DeFi 生态可能会增长数十亿美元。

数据揭秘:SOL都在谁手里?


独立 SOL 持有者

下文我将通过 AI 来计算 SOL 持有者数据。(可能会出错,数据不是完全准确。)

数据揭秘:SOL都在谁手里?


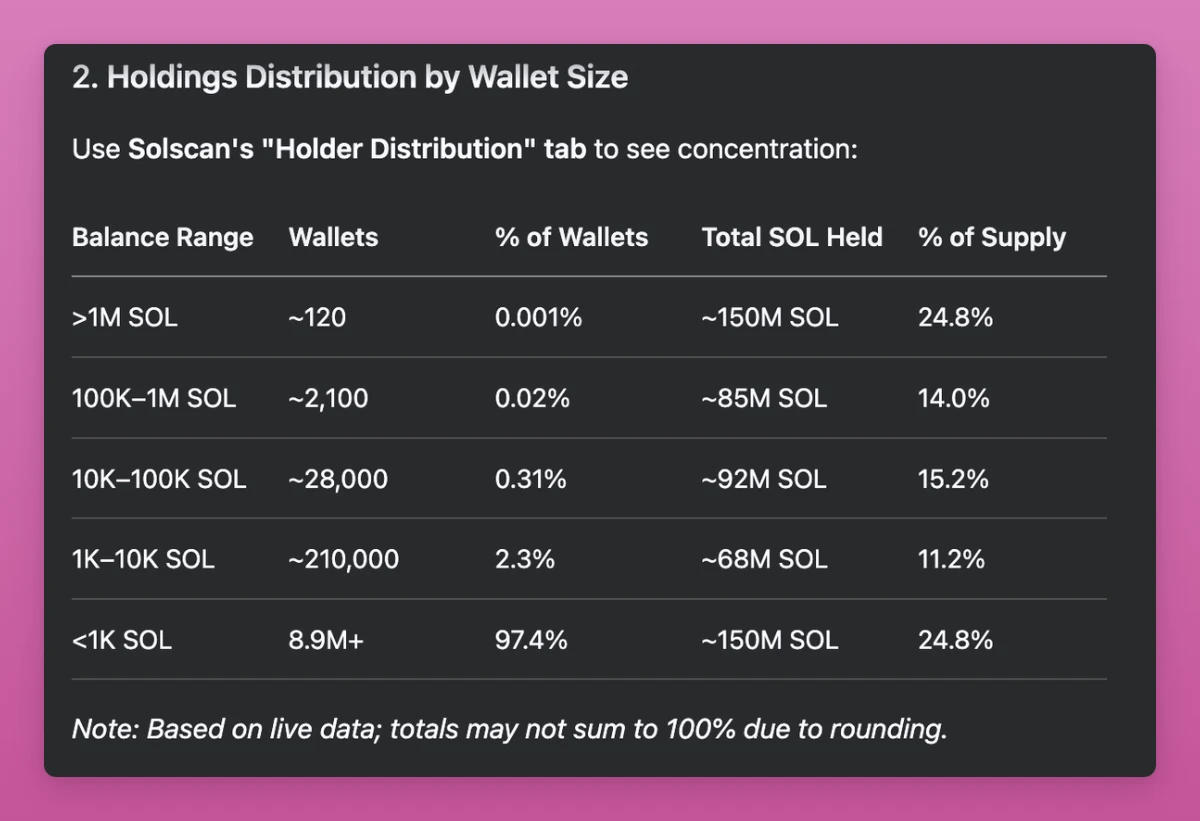
根据 AI 得出的数据,持有大于 100 万枚 SOL 的钱包多达 120 个,总持有超过 1.5 亿枚 SOL;


而数额低于 1000 枚 SOL 的钱包数量超过 890 万;
平均每个钱包持有 16.8 枚 SOL(偏向少数量持有者)。


总的来看,


集中度: 0.33 % 的钱包(30220 个)控制着 54 %的 SOL 供应量(但其中包括 CEX、托管人等);
散户主导地位: 97.4 %的钱包持有少于 1000 枚 SOL,共占 24.8 %的供应量。


免责声明:本文尚在更新中,欢迎评论提供有关 SOL 现状及其所有权的新数据。

Trending Cryptos

Related Reads

Report Interpretation: J.P. Morgan Details Micron's Pre-Earnings Sentiment, Current Hardware Sector Dynamics

Morgan Stanley analyst Joshua Meyers' report (June 21, 2026) highlights key trends in the hardware and semiconductor sector ahead of Micron's earnings. The core takeaways are: 1. **Micron & Memory:** Memory remains a high-conviction long theme, driven by strong AI demand and rising ASPs. However, investor focus is shifting to the sustainability of Micron's >80% gross margins and the specifics of potential new long-term supply agreements (SCAs). 2. **Hardware Supply Chain:** AI-related demand for servers, networking, and storage remains robust, but company performance is diverging. Celestica (CLS) shows improved margin confidence, Western Digital and Seagate benefit from pricing, Fabrinet (FN) sees predictable AI optics growth, and Teradyne (TER) anticipates a new Google customer. 3. **AI Capex & WFE Forecasts:** JPMorgan increased its Wafer Fab Equipment (WFE) market growth forecasts to 28% in 2026 and 29% in 2027. AI infrastructure financing is evolving, with higher project-level debt reducing constraints on capex expansion. The report signals that while the AI-driven hardware cycle is strong, the market is entering a phase focused on execution verification (e.g., Micron's SCA details, Fabrinet's ramp with Amazon) and valuation sustainability. Key near-term signals include Micron's guidance, Arista Networks' outlook, and the pace of demand normalization post potential tariff-related pull-ins.

marsbit8h ago

Report Interpretation: J.P. Morgan Details Micron's Pre-Earnings Sentiment, Current Hardware Sector Dynamics

marsbit8h ago

Research Report Analysis: The Fed's New Chair's Debut – New Leader, But Same Script?

Report Analysis: Federal Reserve's New Chair Debut – A New Captain, But the Same Script? Morgan Stanley's chief global economist Seth B. Carpenter analyzes the first FOMC meeting under new Fed Chair Kevin Warsh in a June 21 report. Warsh deliberately avoided providing forward guidance on interest rates, aligning with his philosophy. However, market expectations for a rate hike this year were reinforced. Key signals lie elsewhere: inflation may fall more than expected, and quantitative tightening (QT) could be more aggressive than anticipated. The FOMC's "dot plot" suggests only one rate hike in 2026. Carpenter argues that if inflation undershoots forecasts, the logic for even a single hike weakens, especially as projections indicate potential rate cuts in 2027. On QT, Warsh's stance is clear. Carpenter notes that measures like halving the Treasury's account balance could shrink the Fed's balance sheet by around $500 billion with minimal market impact. Combined with adjustments to reserve interest and liquidity rules, the ultimate QT scale may exceed expectations, though its market effect might be less disruptive unless the Fed actively sells Mortgage-Backed Securities (MBS). While Warsh initiated a review of the Fed's policy framework, the 2% inflation target remains intact for now. The report concludes that the market may be overestimating the significance of reduced forward guidance and the near-term rate hike risk, while potentially underestimating the scope and manageable nature of the coming balance sheet reduction. The key debates will hinge on upcoming core PCE data, the specifics of the QT path, and the framework review's findings.

marsbit8h ago

Research Report Analysis: The Fed's New Chair's Debut – New Leader, But Same Script?

marsbit8h ago

Critical Game Week: BTC Retracement Confirmation vs. HYPE Support Battle | Guest Analysis

This weekly analysis outlines a critical juncture for BTC and HYPE markets, focusing on key price level confirmations. **BTC Analysis:** BTC is at a pivotal point after a five-wave rally from the June 5th low of $59,100. The price has broken below a short-term rising channel's lower boundary, with the current move seen as a pullback to test this breakdown. Failure to reclaim this level could lead to a retest of the $59,000-$60,000 support zone. The core scenario hinges on this channel retest outcome. * **Key Levels:** Resistance at $64,500-$65,000 (channel boundary) and $69,500-$70,500. Support at $59,000-$60,000 and $55,000. * **Strategy:** A core bearish stance is maintained (20% short from last week), with short-term plans for tactical trades. Three detailed contingency plans (A/B/C) are provided for short positions on resistance tests or breakdowns, emphasizing strict stop-loss discipline. **HYPE Analysis:** HYPE shows strong momentum but is currently in a corrective phase after hitting a new high of $76.94. The price is retesting the crucial $64-$66 support area. * **Key Levels:** Resistance near $77 and $80-$82. Support at $64-$66 and $52-$54. * **Strategy:** The short-term approach is "buy on dips, avoid chasing rallies." A long position is considered only if clear stabilization signals appear at the $64-$66 or deeper $52-$54 support zones, with tight risk controls. **General Risk Management:** A standardized trailing stop-loss protocol is emphasized: set initial stop, breakeven at +1% profit, then trail stops upward to lock in gains. *Disclaimer: All analysis is presented as a personal trading framework, not investment advice. Market conditions are complex and require dynamic adjustment.*

marsbit8h ago

Critical Game Week: BTC Retracement Confirmation vs. HYPE Support Battle | Guest Analysis

marsbit8h ago

Trading

Spot
Futures

Hot Articles

Discussions

Welcome to the HTX Community. Here, you can stay informed about the latest platform developments and gain access to professional market insights. Users' opinions on the price of SOL (SOL) are presented below.

活动图片