Bitcoin hit a new ATH of $111.8k before retracing, as profit-taking by long-term holders began to weigh on momentum. With key support at $103.7k and $95.6k, and signs of older investors offloading, the bulls now face a critical test of their resolve.
Executive Summary
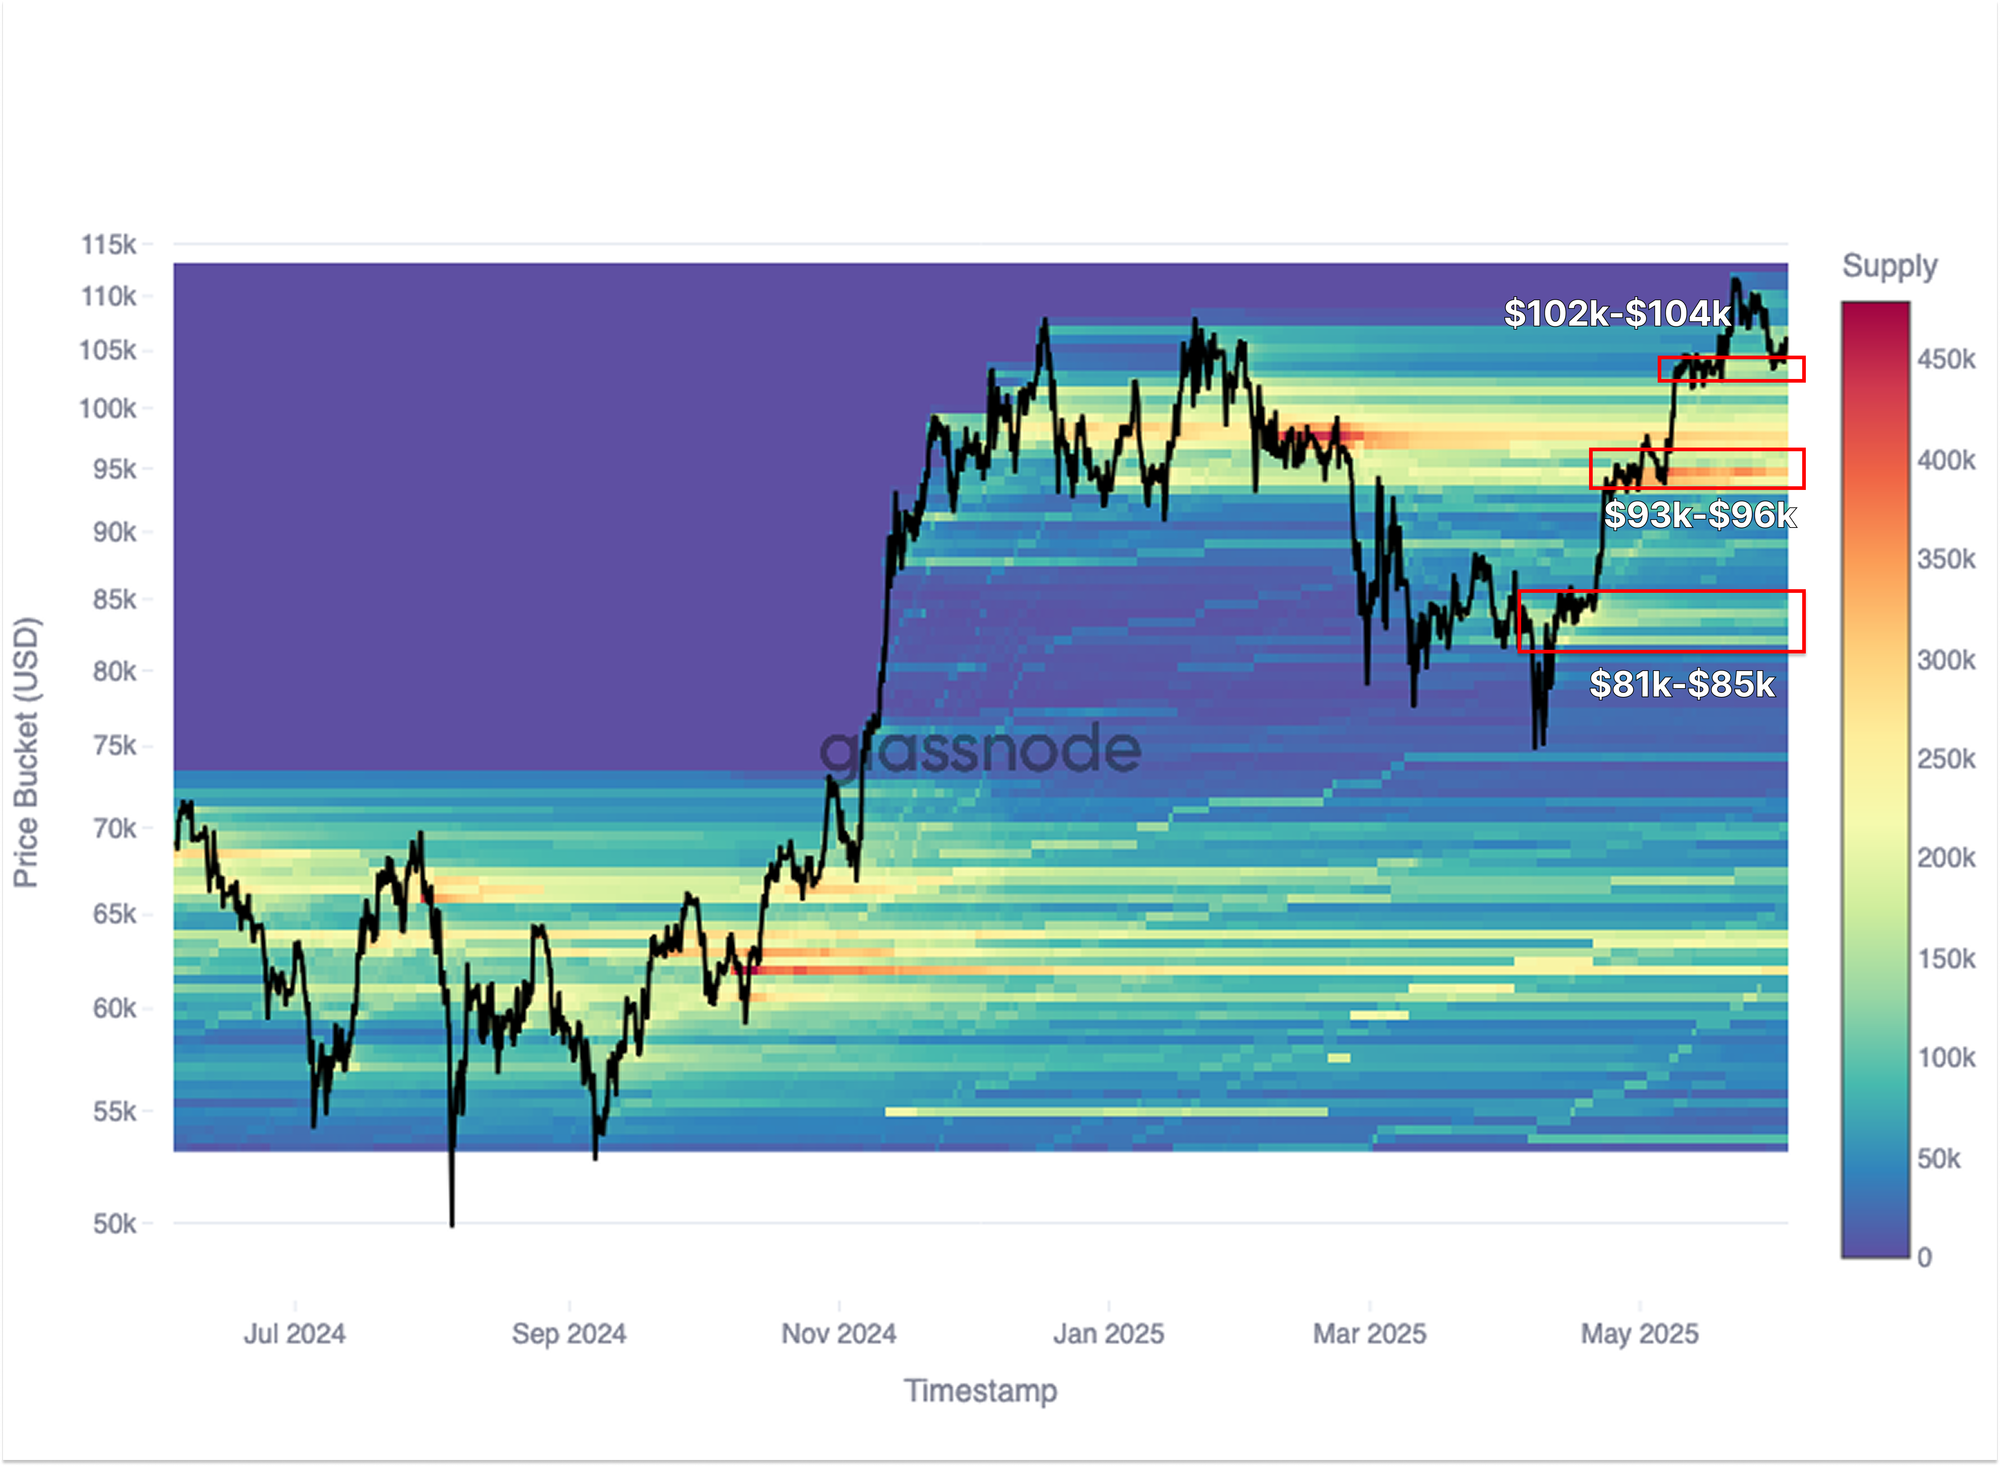
- BTC reached a new all-time high at $111.8k, but quickly retraced to $103.2k. The initial rally appears to be spot-driven, with major accumulation zones at $81–85k, $93–96k, and $102–104k now acting as potential support.
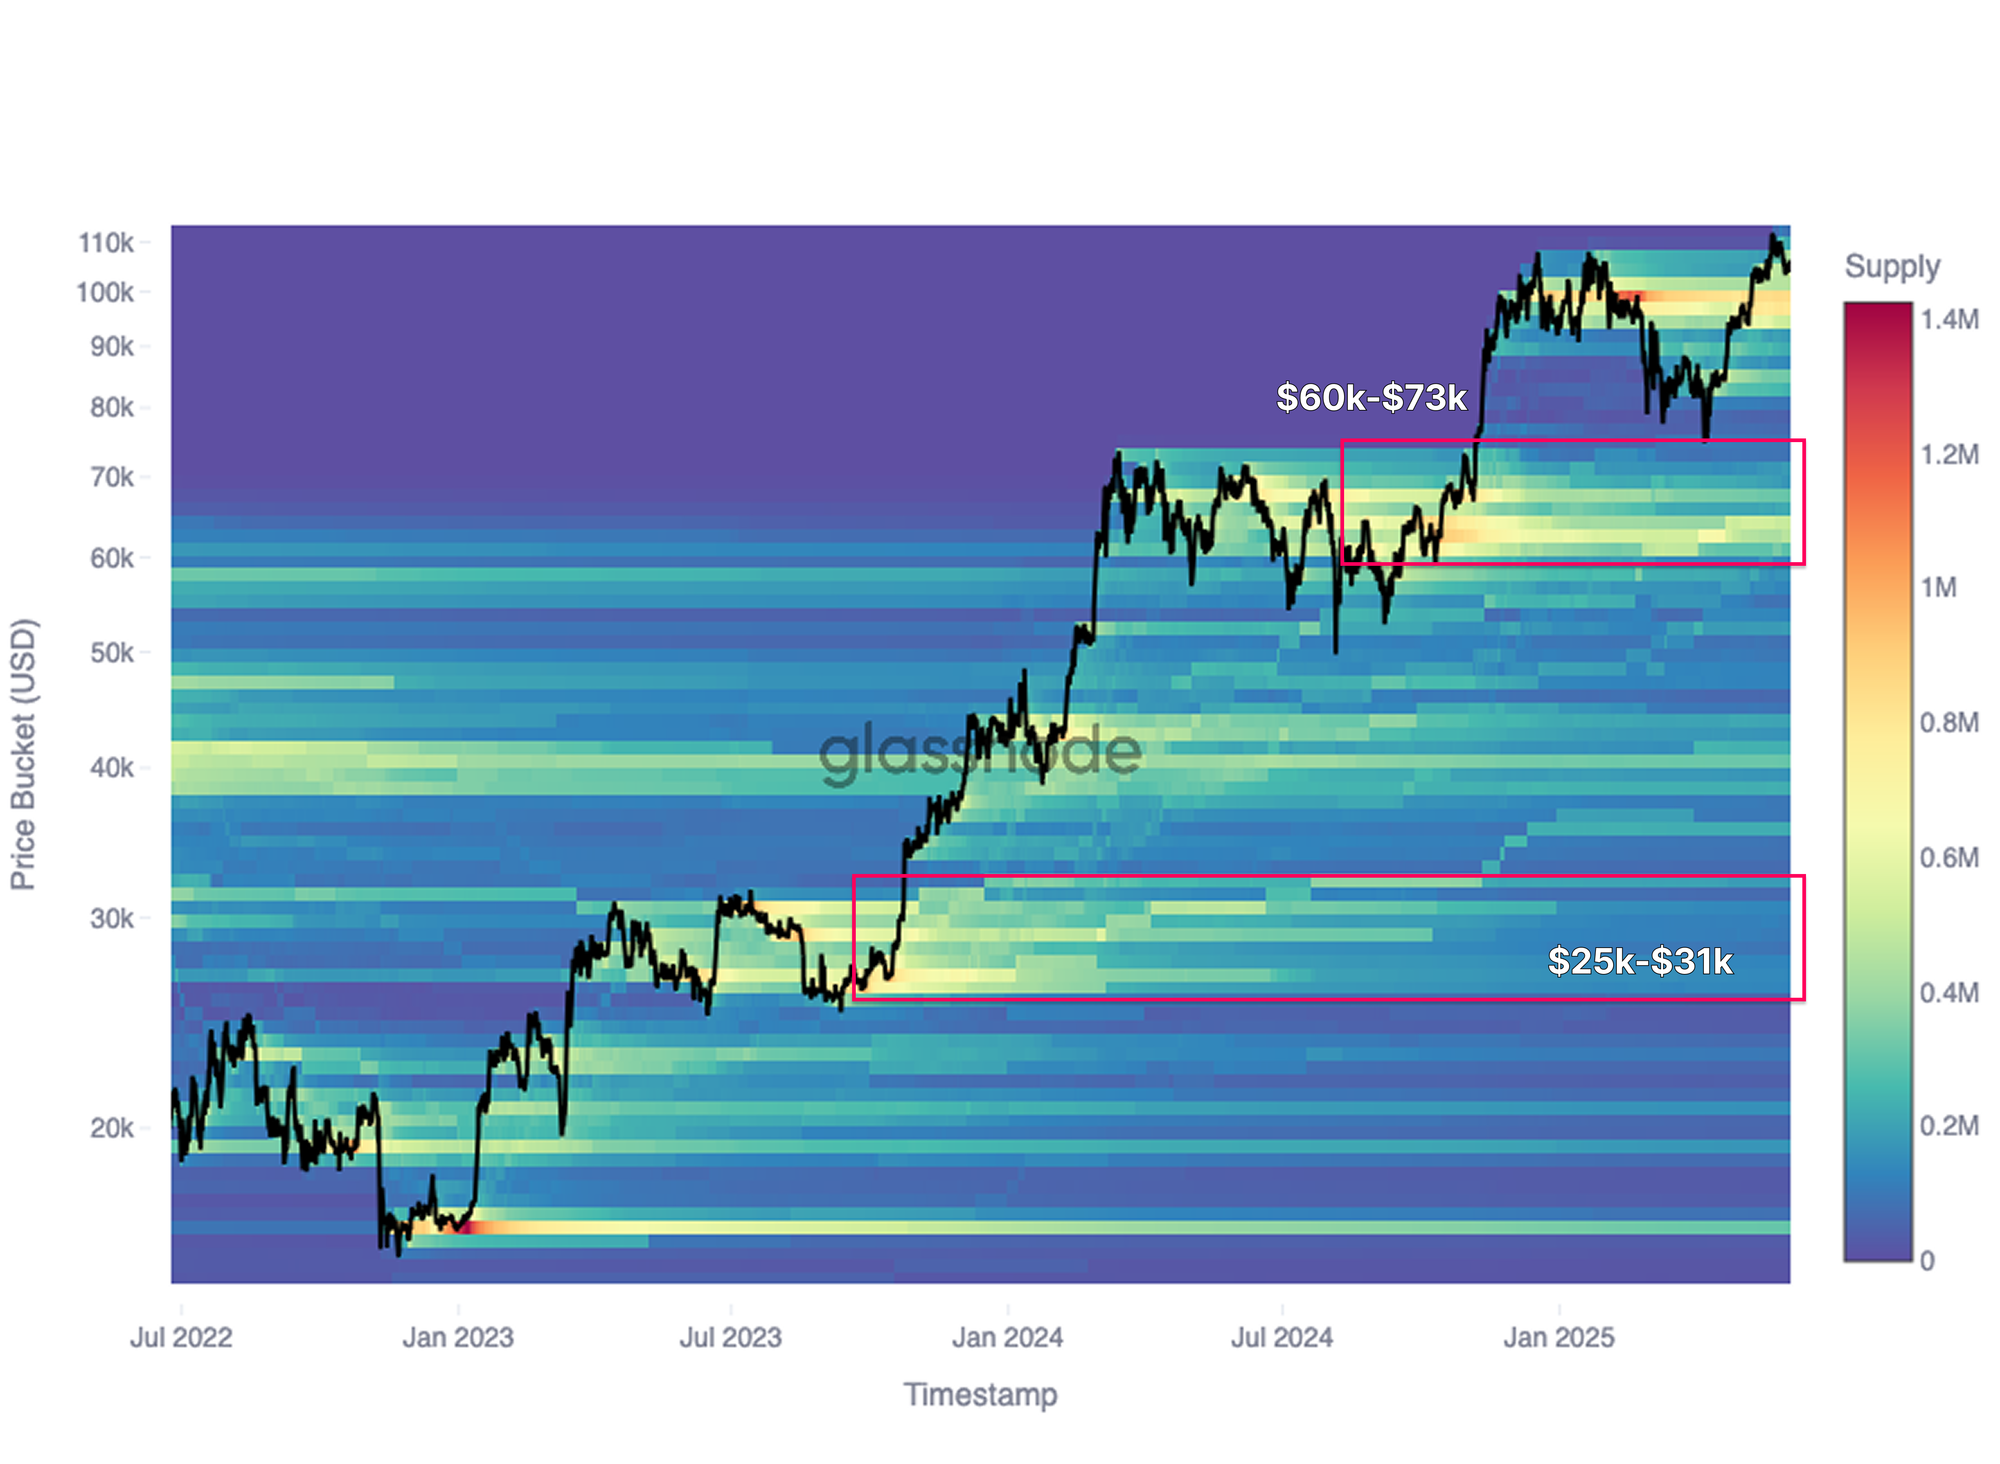
- Zooming out with the CBD Heatmap, many historical accumulation zones flipped into distribution zones. Sellers from $25k–31k, $38k–44k, and $60k–73k ranges are now weighing on price action.
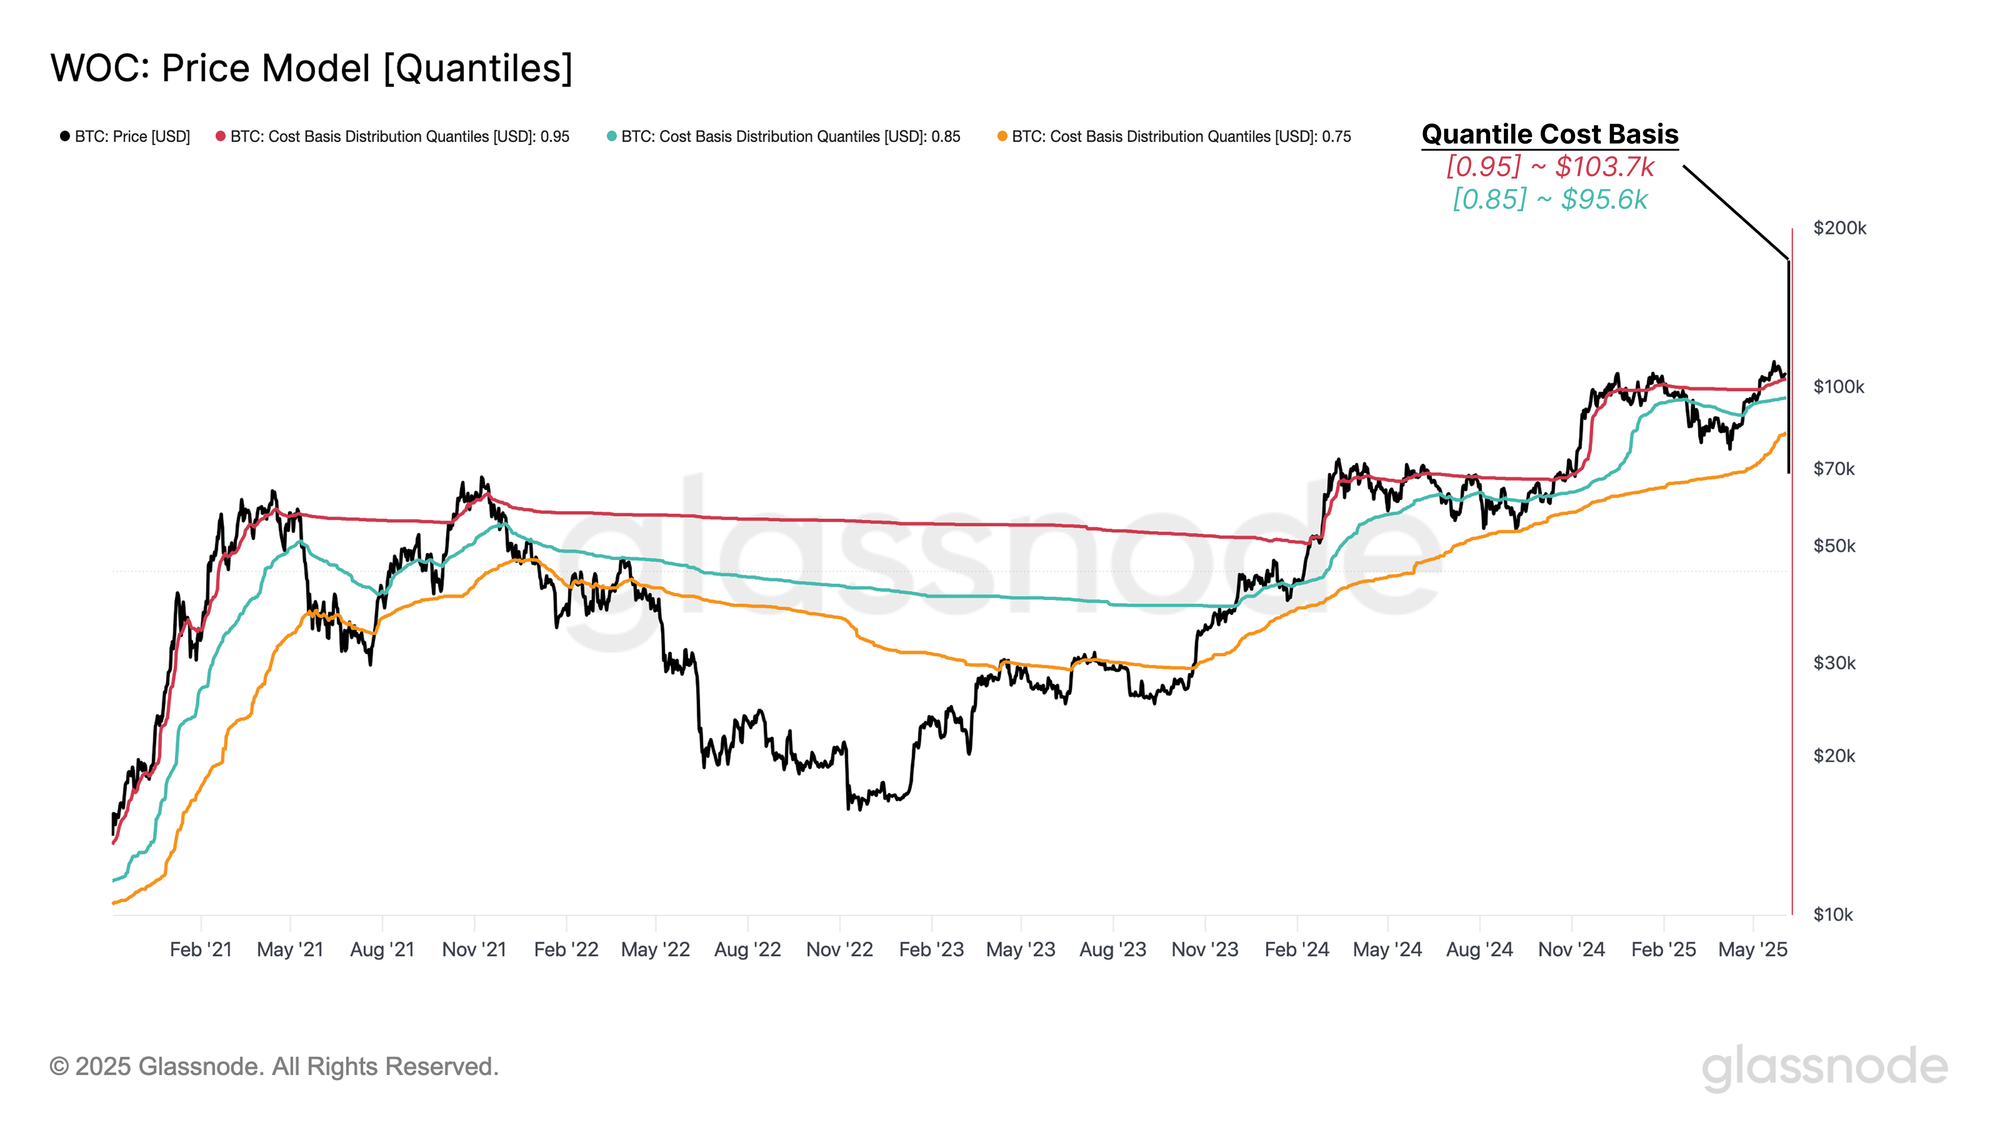
- Cost basis quantiles and short-term holder bands place immediate support near $103.7k and $95.6k, with resistance at $114.8k. These levels are statistically significant markers of broader sentiment shifts.
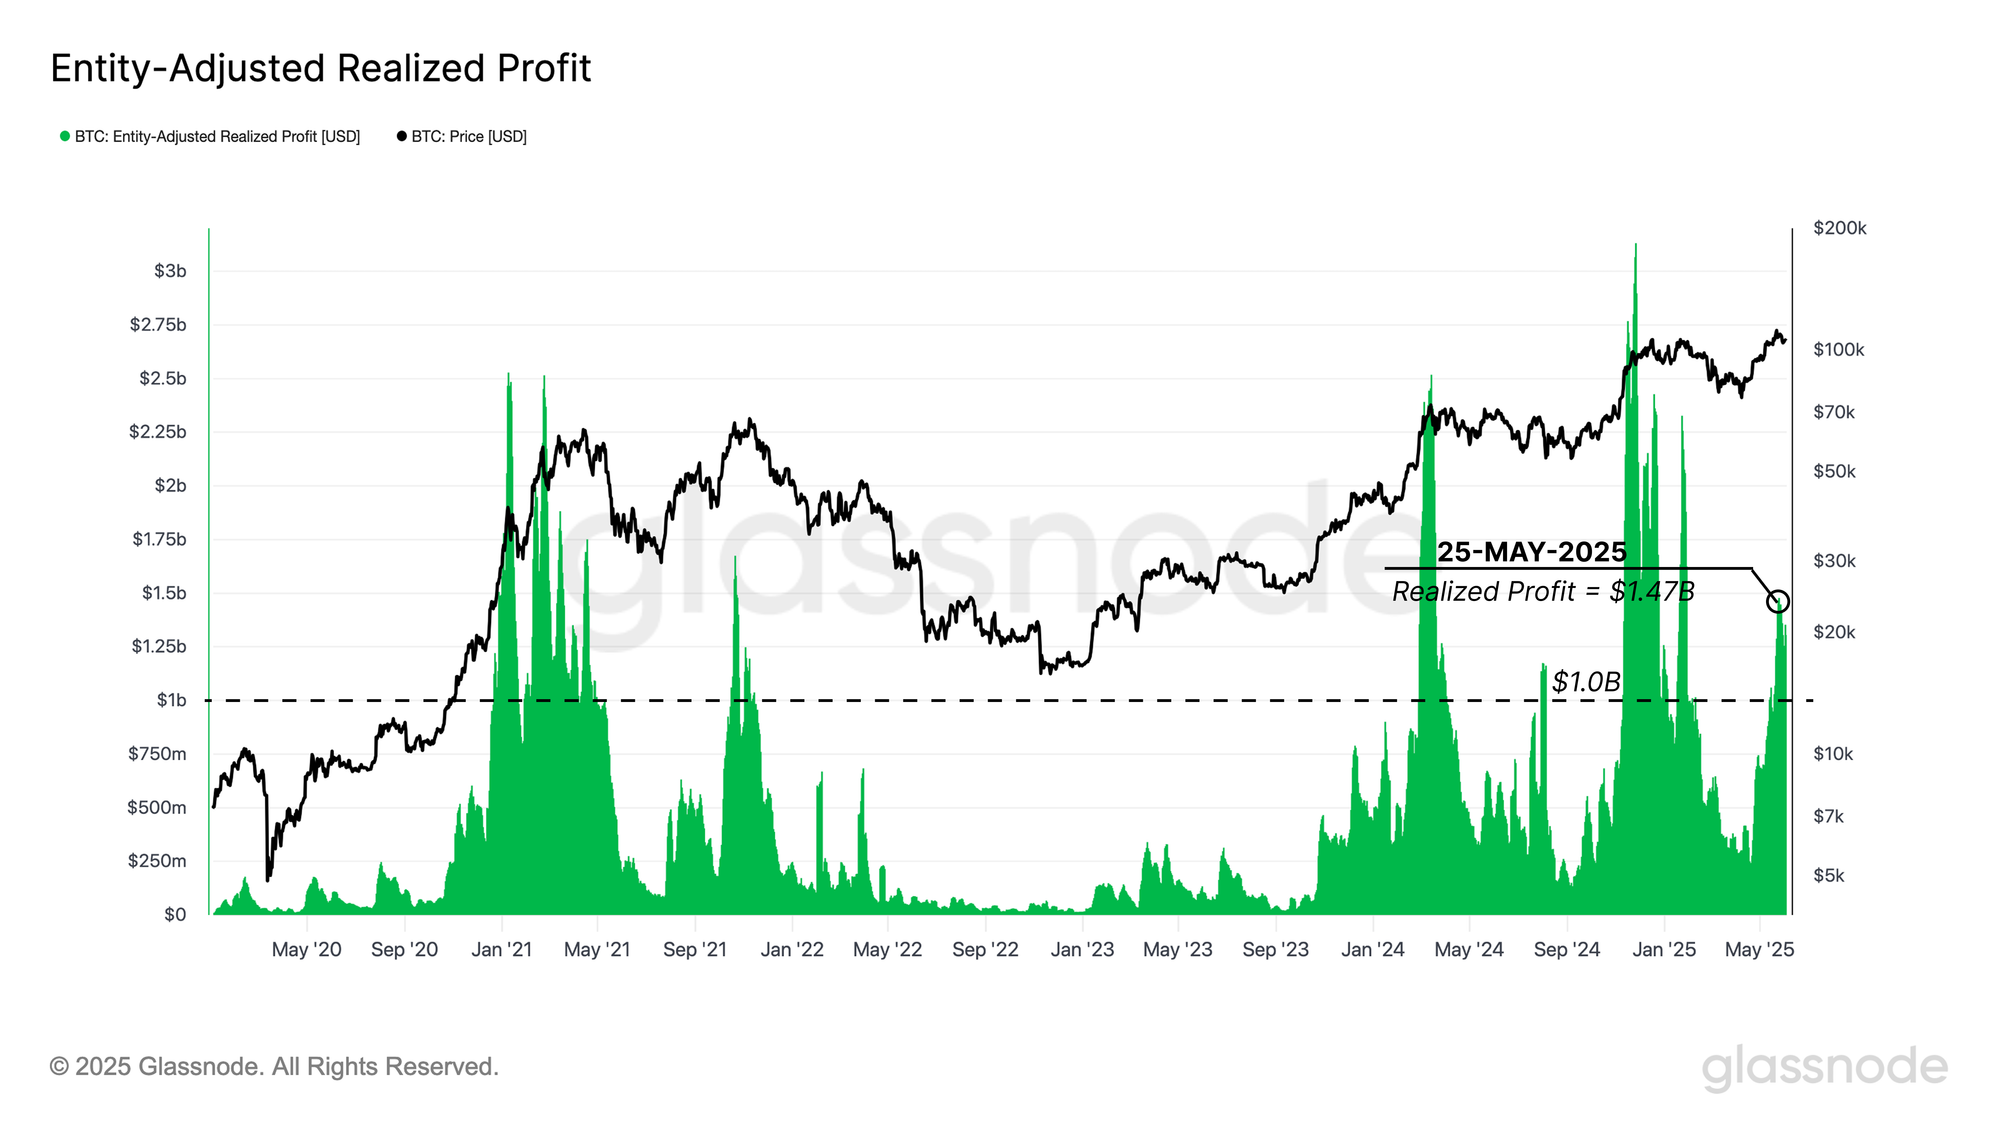
- Realized profits spiked to $1.47B/day, marking the fifth major profit-taking wave in this cycle. Selling was led by long-term holders, not short-term traders.
- Cohorts holding for >12 months dominated the recent realized profits, reflecting mature capital rotation. This aligns with earlier observations from the CBD Heatmap, confirming that seasoned investors are shaping the current top formation phase.
Mapping the Rungs of the Rally
Over the past two weeks, Bitcoin extended its rally to a new high of $111.8k, briefly surpassing the previous ATH set in January 2025. However, this move was followed by a correction to $103.2k, signalling a potential pause in bullish momentum.
To understand the anatomy of this rally, we turn to the Cumulative Volume Delta (CBD) Heatmap, a tool that tracks the net difference between aggressive buying and selling across price levels. Visually, it reveals zones of concentrated spot-driven accumulation or distribution, helping pinpoint where demand was strongest.
From the heatmap, it's evident this rally was largely spot-led and stair-stepped higher, with clear accumulation clusters at $81–85k, $93–96k, and $102–104k. These zones now potentially can serve as supply-dense regions that may act as short-term support, depending on broader market sentiment.
Notably, top buyers from Q1 2025, who held through the drawdown below $80k, are once again being tested as price churns sideways. This edition will examine the fading momentum behind recent demand, the forces draining market strength, and where potential support may emerge if weakness continues.
Old Hands Sell Pressure
To understand the forces driving Bitcoin’s recent move beyond $111k, we need to take a broader view of the market structure. By examining the CBD Heatmap from the June 2022 cycle bottom onward, a clear pattern of distribution by past accumulators begins to emerge.
As the price marched upward, the supply-dense zones that previously acted as bases of accumulation, often marked by sideways consolidation, have now turned into active selling zones. Visually, the heatmap reveals a gradual shift; areas that once supported the rally have flipped into sources of resistance, as earlier holders take the opportunity to offload.
The most notable selling pressure has come from cohorts who accumulated during key historical ranges: $25k–31k and $60k–73k. These groups, many of whom held through multiple volatility phases, are now contributing to the supply overhang that appears to be capping further upside, at least in the short term.
Navigating Price Discovery
With long-term holders gradually applying sell pressure, the probability of a short-term correction continues to build, particularly in the absence of a strong upside catalyst to push Bitcoin decisively above $111.8k. In such phases, where bullish momentum stalls, on-chain pricing models become essential tools for identifying likely support levels during pullbacks.
One particularly effective framework is the Spent Supply Distribution (SSD) Quantiles. This metric analyzes the cost basis of coins being spent at a given time, dividing them into 100 percentiles. It provides a high-resolution view of where supply originally entered the market, enabling us to pinpoint zones with elevated turnover, likely driven by profit-taking or loss realization.
Here, we focus on three key quantiles:
- 🔴 0.95 (top 5% of spent supply)
- 🔵 0.85 (top 15%)
- 🟠 0.75 (top 25%)
Historical patterns over the past five years suggest that absolute euphoria tends to occur when price trades above the 0.95 quantile, while sideways bull phases often unfold between 0.85 and 0.95. On the other hand, sustained trading below the 0.75 quantile has typically marked bearish or risk-off periods.
At present, the 0.95 quantile sits at ~$103.7k, acting as the first on-chain support zone. Should selling pressure persist, the next level to watch is the 0.85 quantile at $95.6k, which may provide structural support, or, if breached, confirm a broader risk reset.
With a substantial portion of Bitcoin's supply changing hands over the past six months, driven by two separate pushes to new all-time highs, it becomes increasingly important to track recent investor behaviour. One of the most insightful models for this is the Short-Term Holder (STH) Cost Basis, which captures the average acquisition price of coins held for less than 155 days.
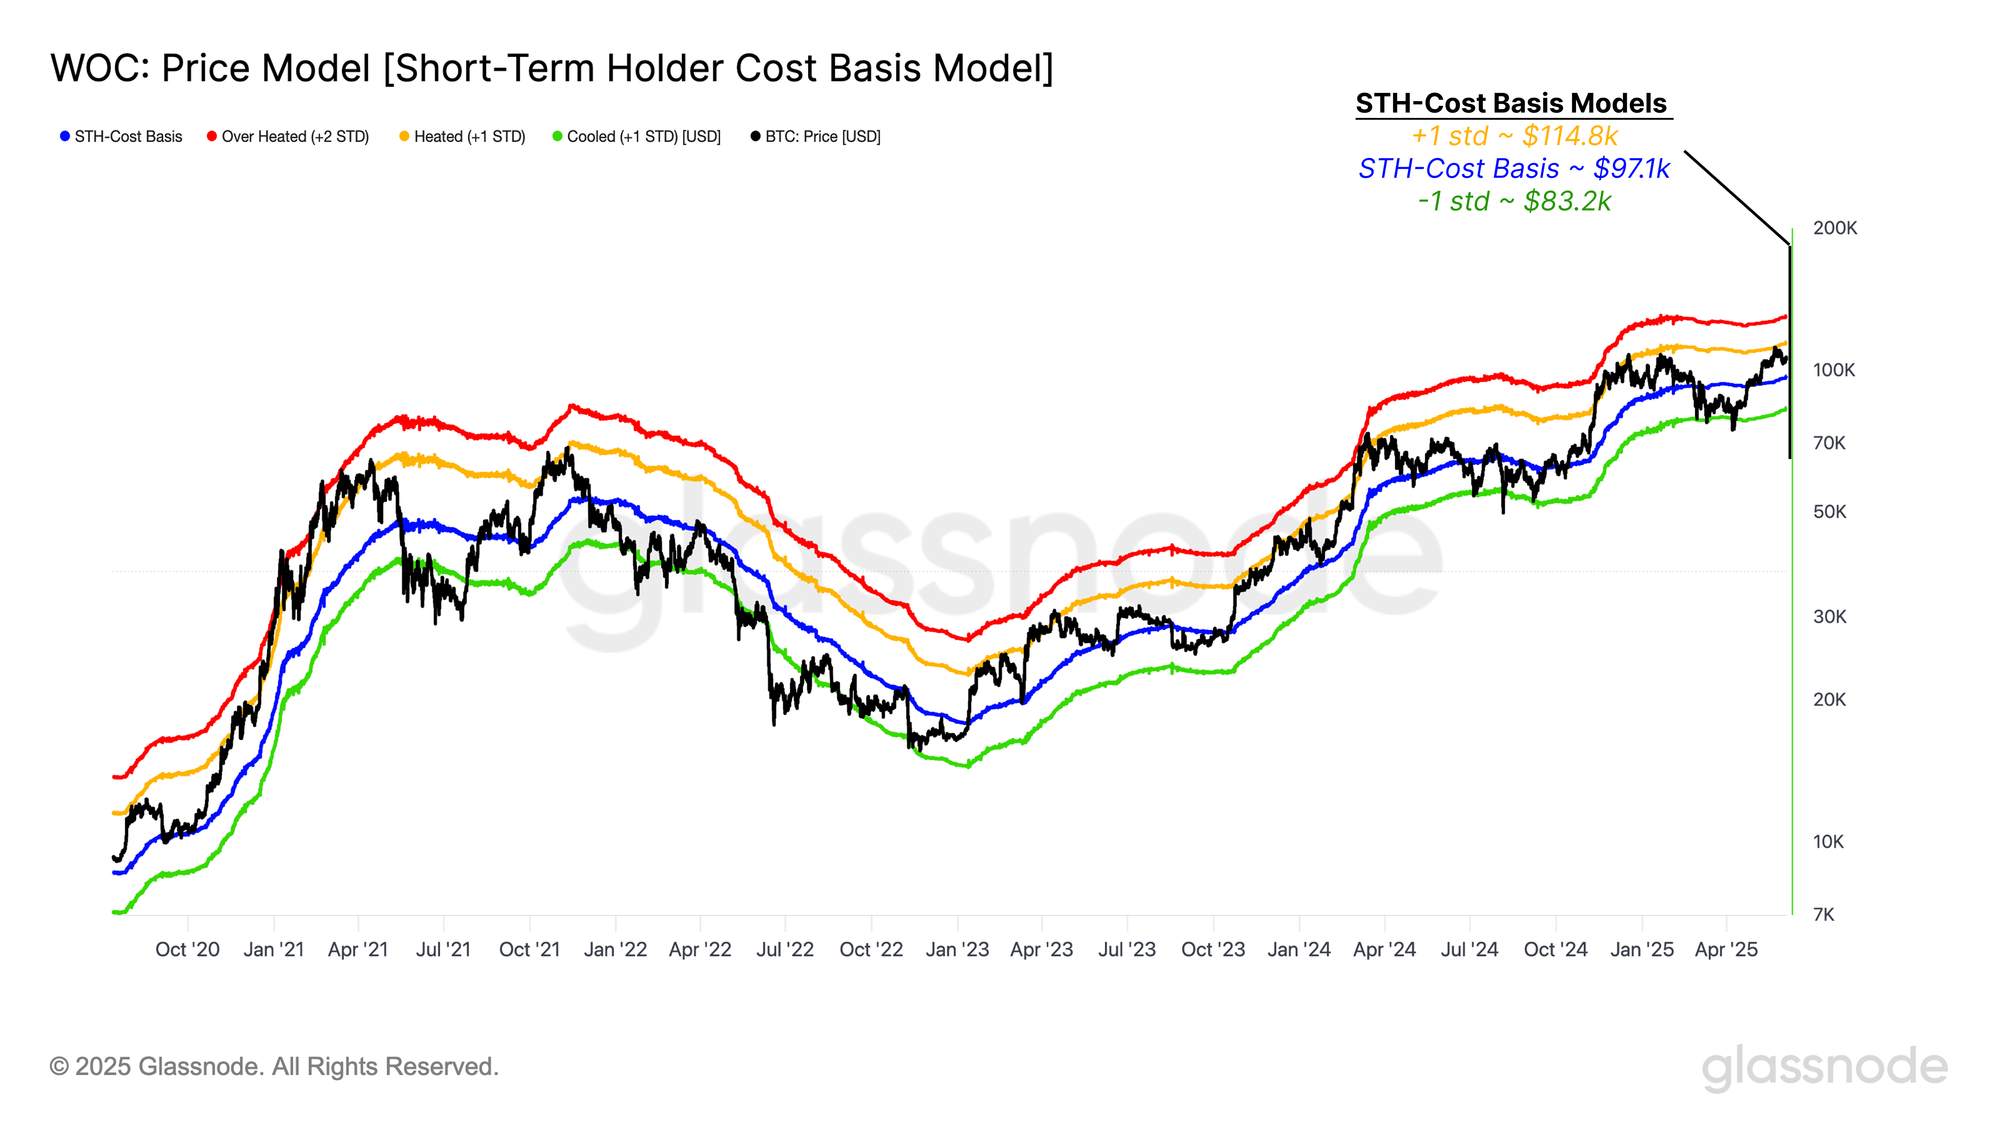
To add statistical context, we apply standard deviation bands around this cost basis to define key support and resistance zones. These bands help quantify the range of market consensus among short-term participants and can signal trend exhaustion or breakout thresholds.
Currently, the STH cost basis sits at $97.1k, representing the average entry price for recent buyers. The +1 standard deviation band, often associated with overbought or bullish breakout conditions, lies at $114.8k, while the -1 standard deviation band at $83.2k marks a level of elevated downside risk.
These three levels, $114.8k, $97.1k, and $83.2k, now define the statistical boundaries of short-term sentiment. A break above or below these thresholds will likely shape the next leg of market direction, signalling whether momentum is returning or fading.
A High Profit Realization
As Bitcoin retreats from its recent $111.8k high, much of the selling pressure appears to stem from intra-cycle seasoned holders, those who accumulated earlier in the rally and are now realizing substantial gains. In this phase, the profit realization regime is a key concept for evaluating the risk of demand exhaustion.
Using the 7-day SMA of daily profit realization, adjusted to exclude intra-entity flows, we see that realized profits peaked at $1.47B per day last week. This is a notable level, highlighting the intensity of recent capital rotation.
More importantly, this marks the fifth wave in this cycle where daily profit-taking has surpassed the $1B threshold. Such events often coincide with local market tops or slowdowns, especially if incoming demand cannot absorb the scale of realized gains. This puts a spotlight on the market’s resilience in the face of elevated selling pressure.
A Dynamic Shift
To better understand the significance of the current elevated wave of profit realization, it helps to view it through a cyclical lens. Not all profit-taking events are created equal, and the dynamic nature of these regimes can reveal how market maturity and volatility shape investor behaviour over time.
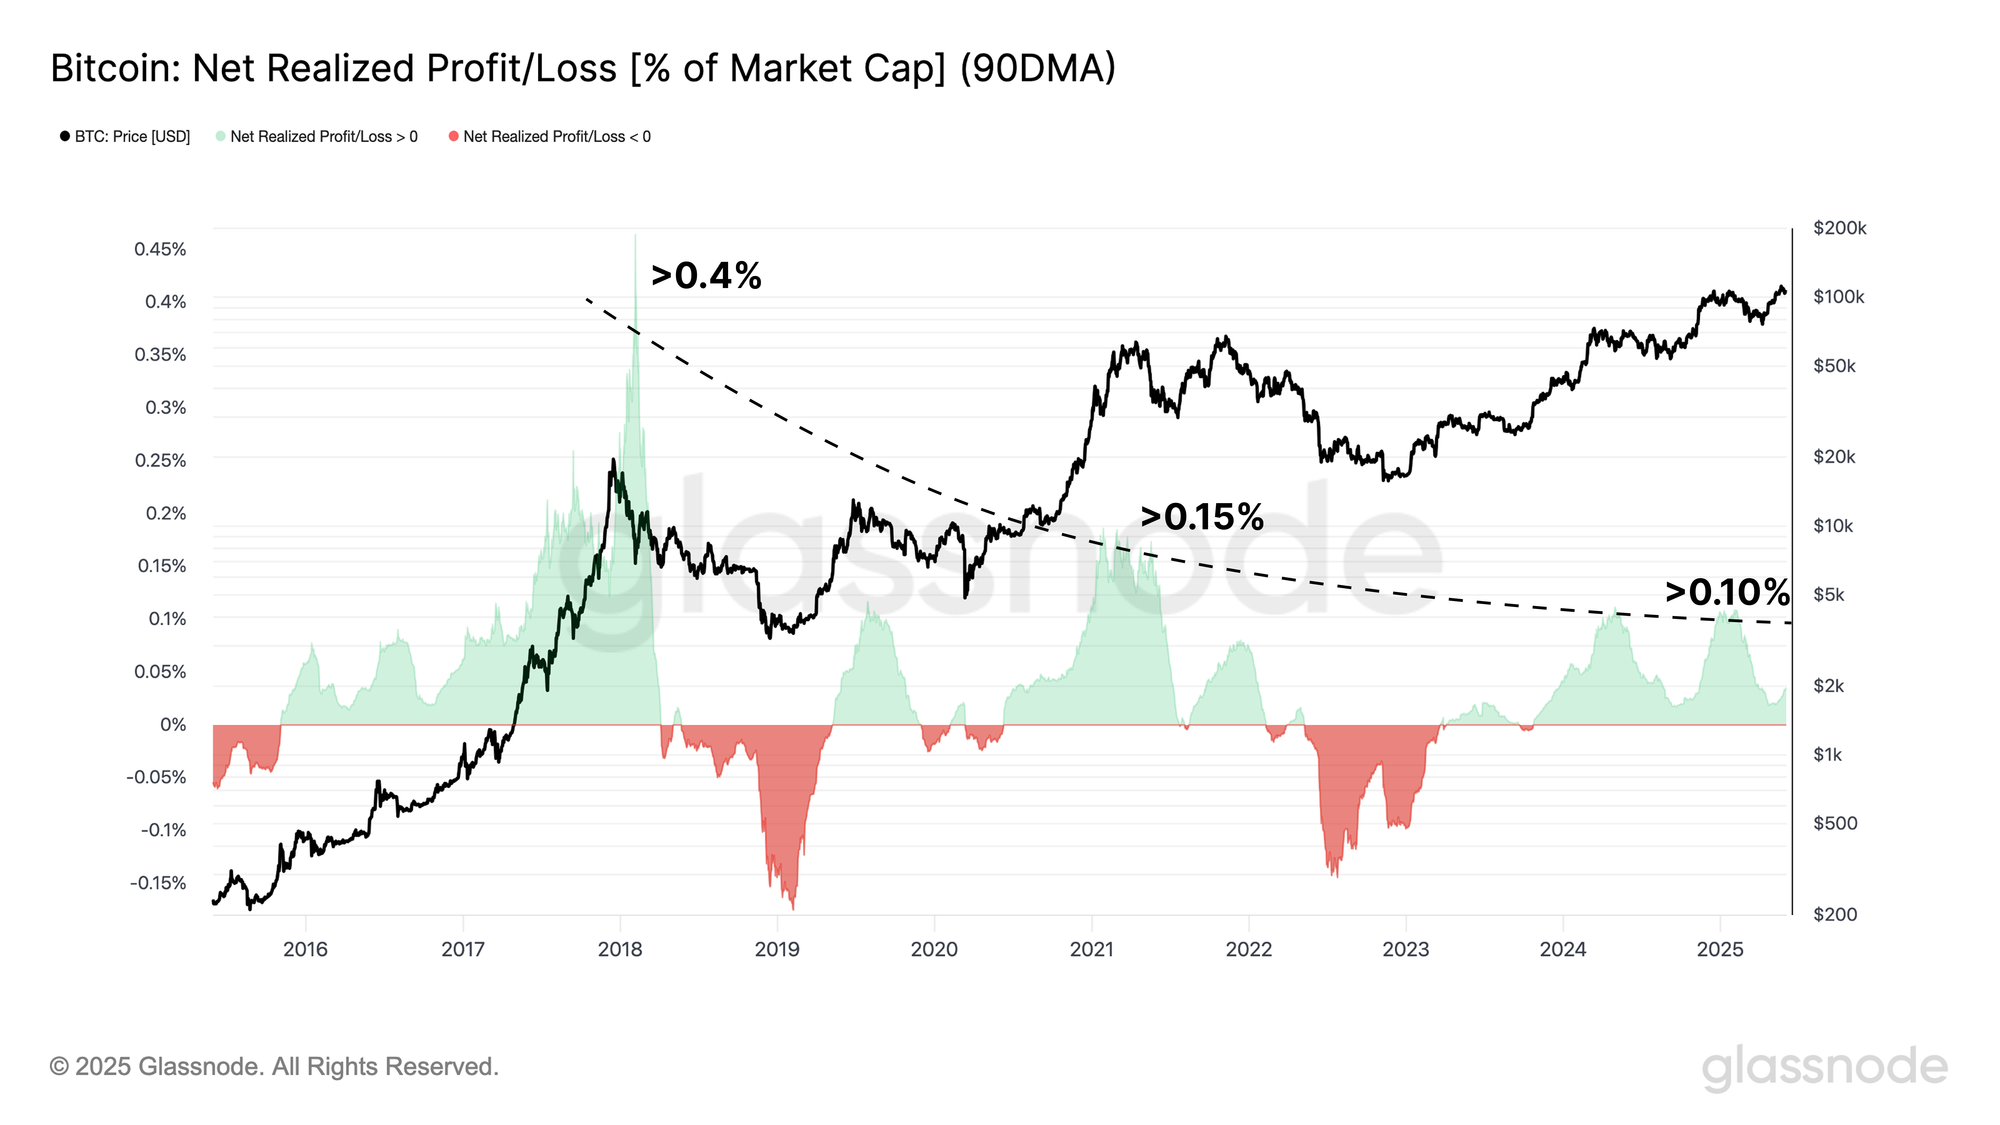
One effective approach is to examine the 90-day SMA of net realized profit, normalized by market cap. This adjustment allows us to compare profit-taking intensity across cycles on an apples-to-apples basis. A clear trend emerges: profit-taking has grown less euphoric over time, reflecting the broader degradation in cyclical upside performance and lower volatility profiles as the market matures.
- From November 2015 to April 2018, the net profit-taking regime lasted ~25 months, peaking above 0.4% of market cap.
- In the 2020–2022 cycle, this region persisted for ~20 months, but only peaked at around 0.15%.
- In the current cycle, beginning November 2023, the net profit-taking phase has stretched across 18 months, forming two distinct peaks near 0.1%..
This trend suggests that while profit-taking still exerts significant pressure, it has become more tempered, possibly signalling a shift from boom-bust euphoria to structured capital rotation in a more mature asset class.
Who Is Realizing Profit?
Another useful lens for evaluating profit-taking cycles is to identify which investor cohorts are behind the selling.
Since the 2015–2018 cycle, the share of realized profit attributed to long-term holders (LTHs) has steadily increased during euphoric market tops. This trend highlights a structural shift in market maturity, where more seasoned investors dominate capital rotation rather than fast-moving speculators.
At the most recent peak, the 30-day moving average of realized profit by LTHs surged to ~$1B per day, while short-term holders (STHs) realized just $0.32B per day. This marks a more than 3X difference, reinforcing that this wave of profit-taking is being led by older, higher-conviction investors.
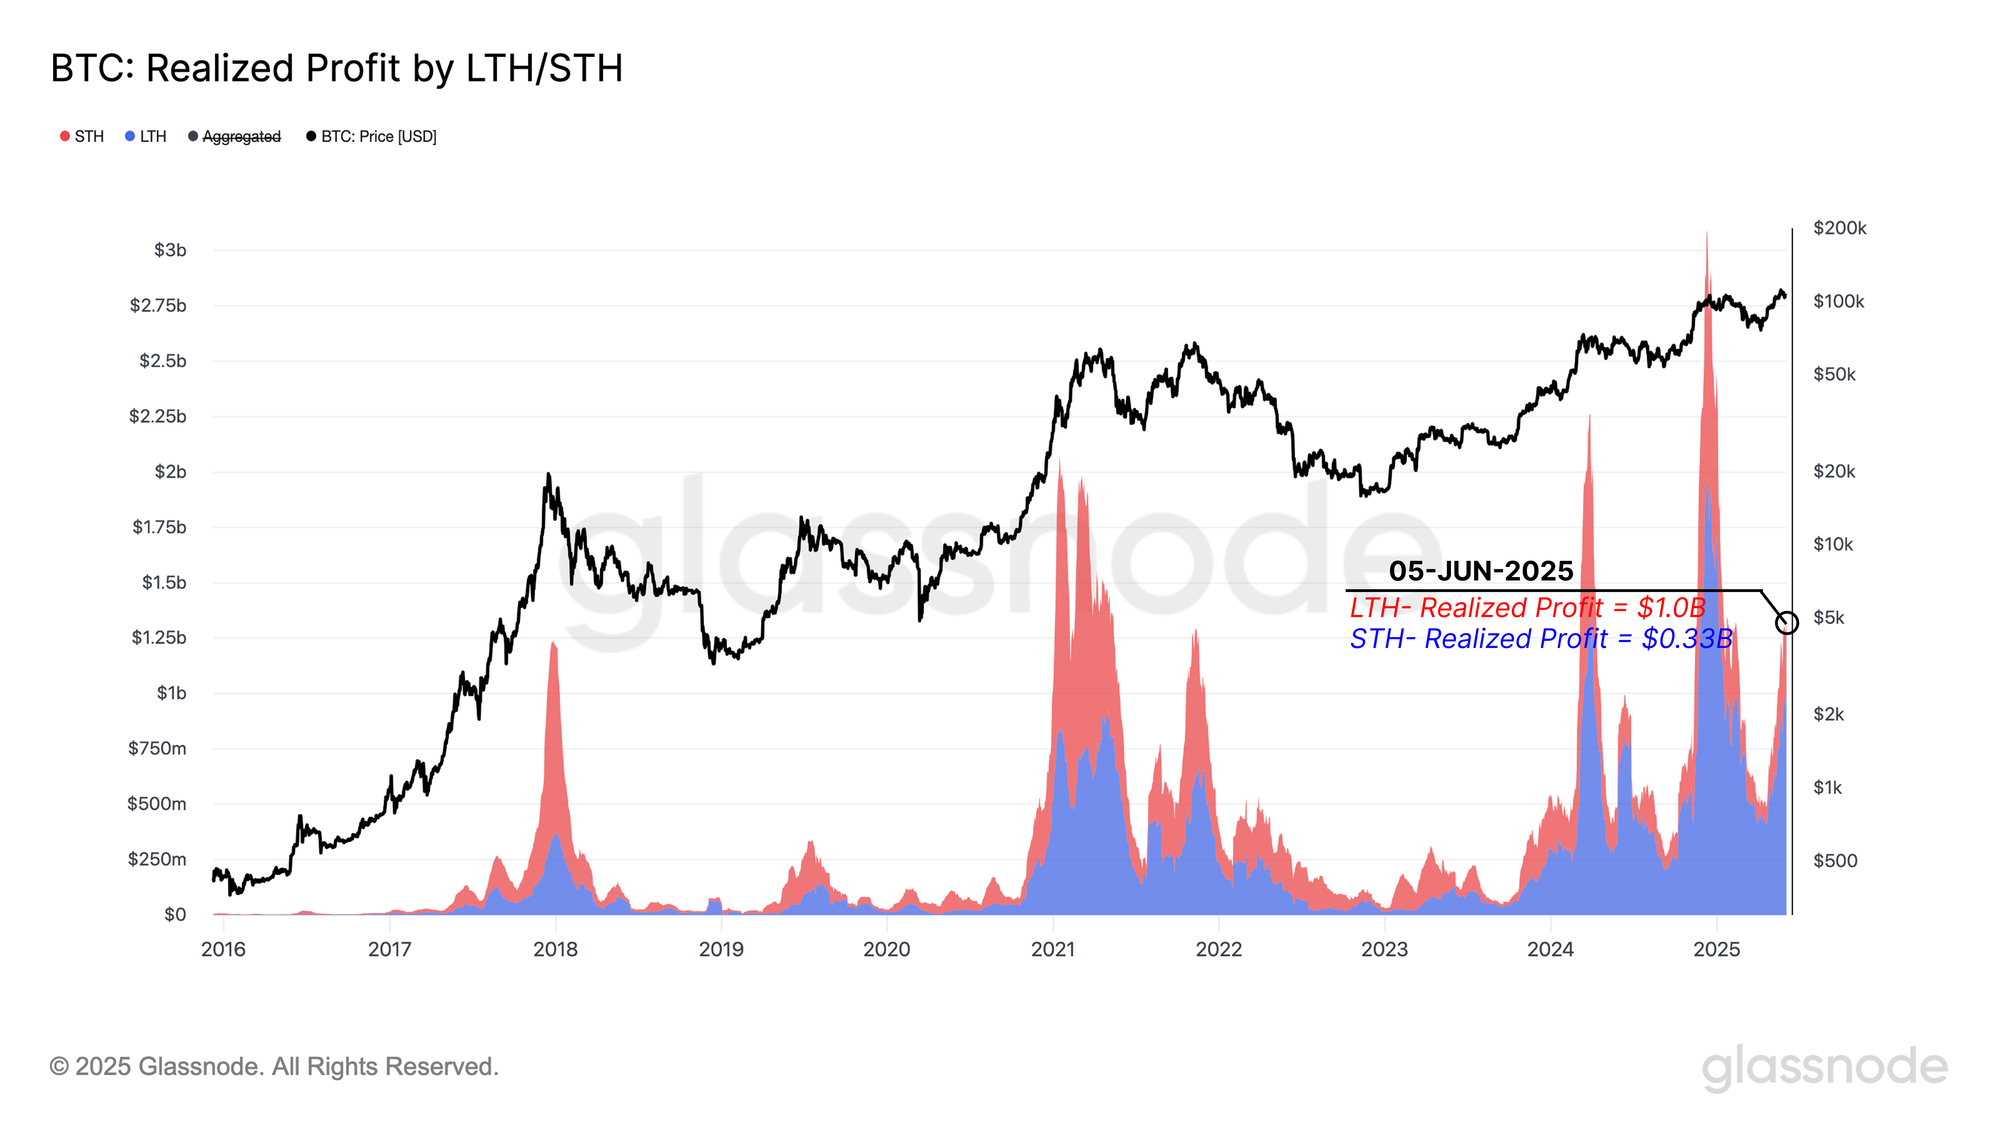
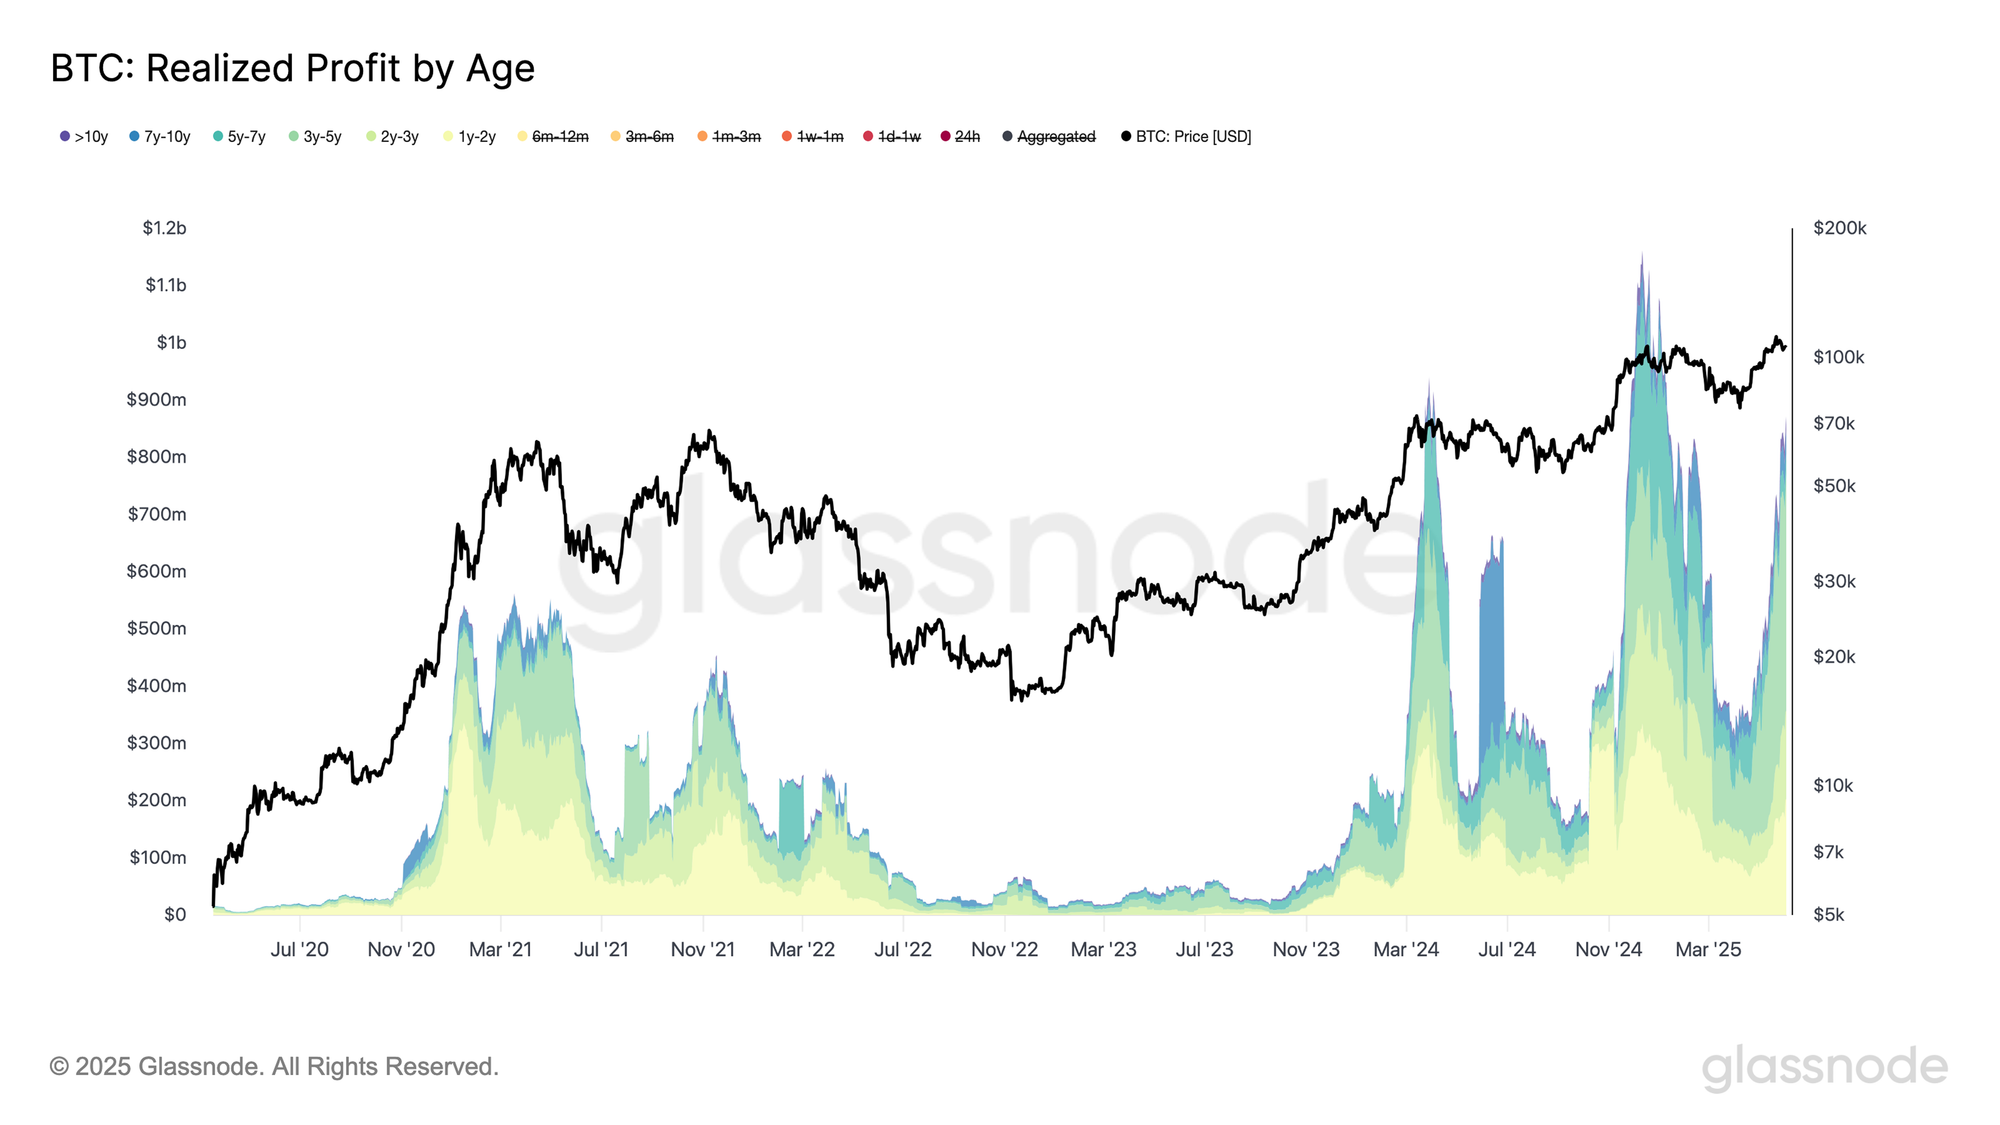
At first glance, the current ~$1B per day in realized profit by long-term holders (those holding >6 months) may seem modest compared to the $1.8B peak during the December 2024 top. However, a deeper breakdown reveals a familiar pattern.
Throughout bull markets, the 6–12 month holder cohort tends to contribute less to profit-taking as the cycle matures. This dynamic is playing out again in the current cycle. As the rally stretches, it's increasingly the older segments of long-term holders who are stepping in as dominant sellers, shaping what appears to be the top formation phase of this cycle.
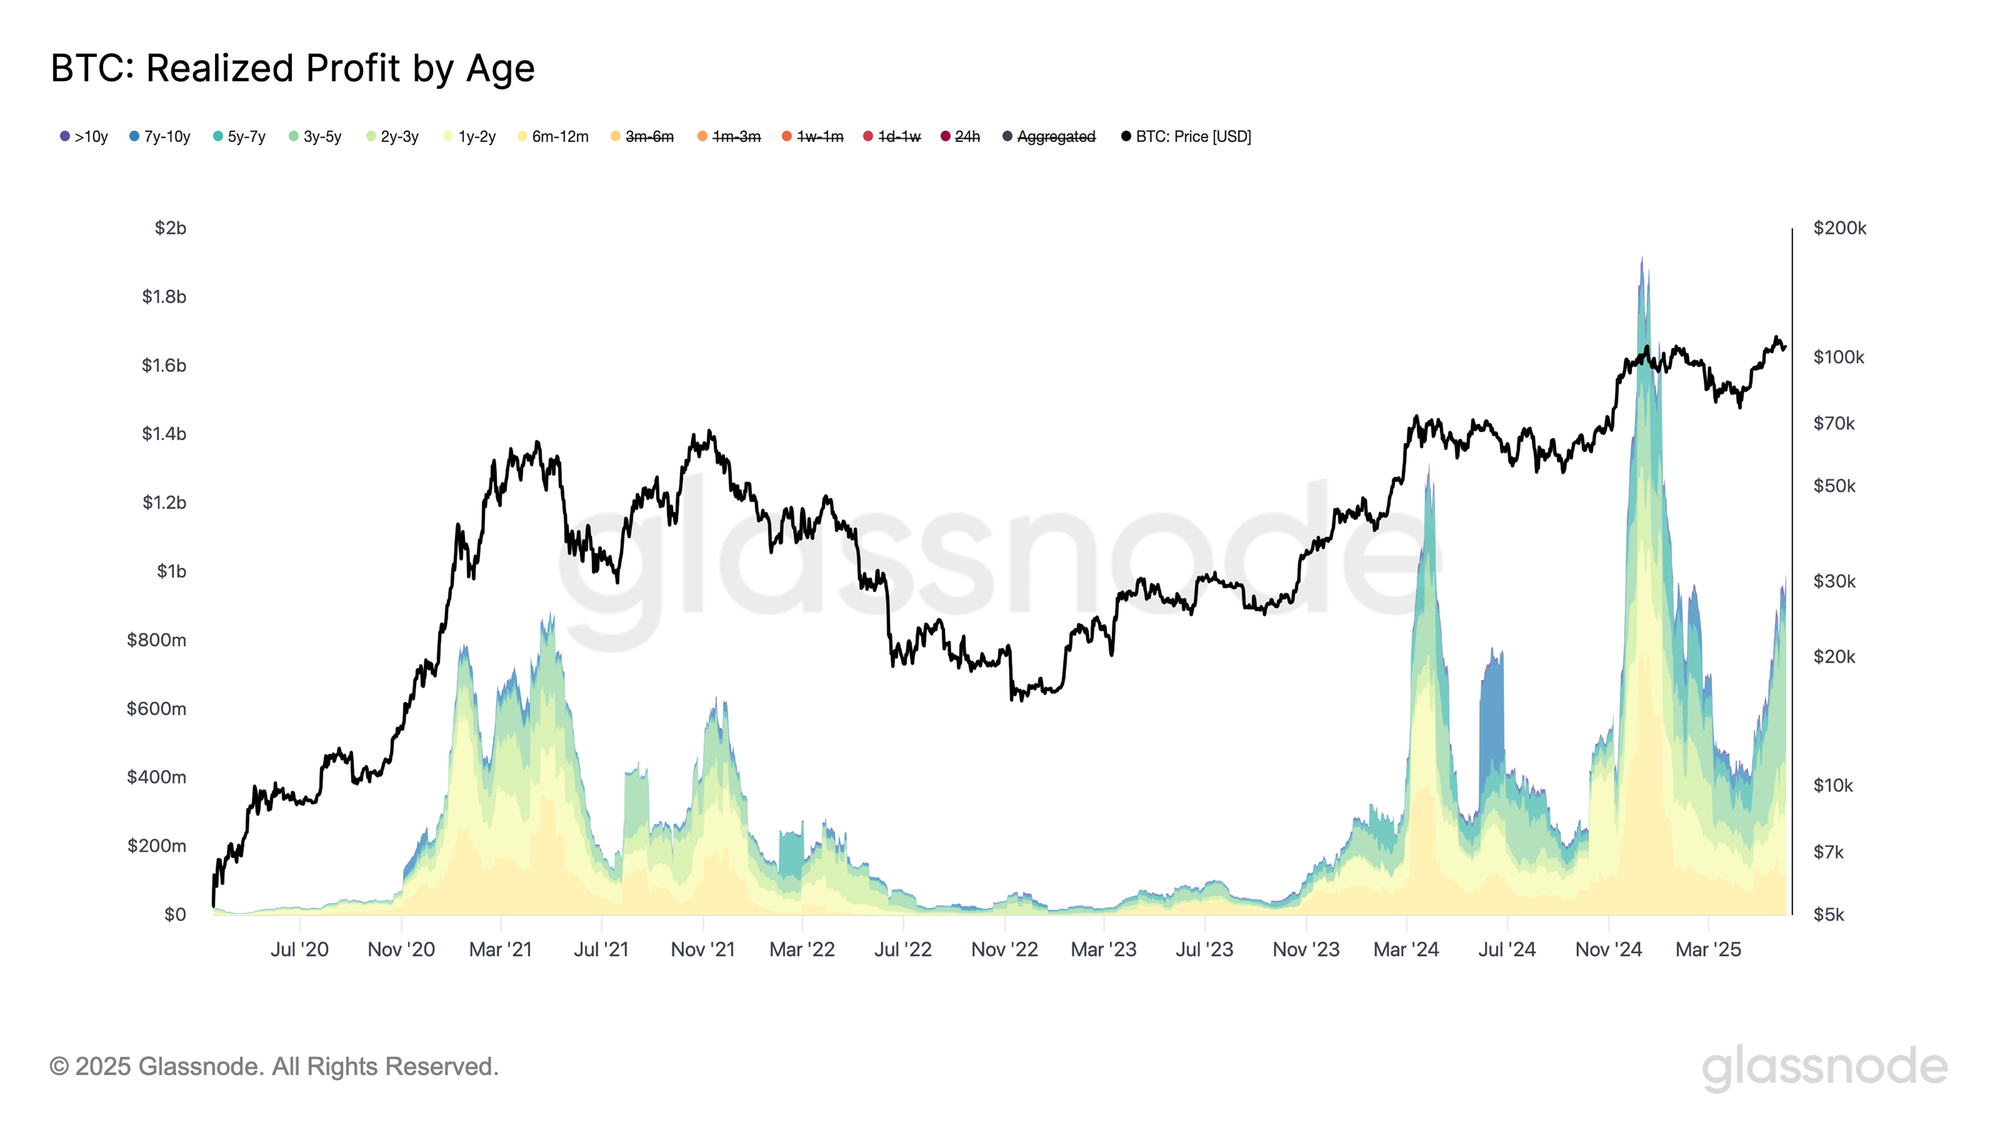
Therefore, by excluding the 6–12 month cohort from the total realized profit of long-term holders, we can better assess the true impact of seasoned investors on current market dynamics. This adjustment removes the influence of Q1 2025 top buyers, who have relatively limited unrealized gains, and focuses on those holding for over a year with deeper profit margins.
When isolating realized profit by >12-month holders, the significance of the current wave becomes more apparent. This cohort, often associated with conviction-driven investors, is now taking profits at scale, a behaviour that typically signals maturity or exhaustion in a bull trend.
This observation is in confluence with the earlier findings from the CBD Heatmap, which also pointed to older investors contributing most of the recent selling pressure, reinforcing the narrative that long-term holders are increasingly active in this top formation phase.
Conclusion
Bitcoin’s recent climb to a new all-time high of $111.8k has met growing resistance, as market data points to exhaustion from earlier buyers and profit-taking by long-standing holders. The CBD Heatmap shows that many of the strong accumulation zones from previous cycles have flipped into active selling regions, particularly among cohorts who bought in the >$25k and <$73k zones.
On-chain pricing models such as the Cost Basis Quantiles and Short-Term Holder statistical bands now define the immediate structure of the market. Key support levels at $103.7k and $95.6k will be critical to hold if demand falters, while the upper resistance band at $114.8k remains a test for renewed strength.
The profit realization regime is also showing signs of intensity, with daily profits peaking at $1.47B, primarily led by older long-term holders. This trend, along with the rising share of profit-taking from the >12-month cohort, suggests we may be witnessing a distribution phase rather than a fresh breakout.
Altogether, the market appears to be at a crossroads, shaped by elevated sell pressure, maturing bullish momentum, and demand that must prove itself resilient. The coming weeks will be crucial in determining whether this is a mid-cycle consolidation or the start of a broader top formation.
Disclaimer: This report does not provide any investment advice. All data is provided for informational, and educational purposes only. No investment decision shall be based on the information provided here and you are solely responsible for your own investment decisions.
Exchange balances presented are derived from Glassnode’s comprehensive database of address labels, which are amassed through both officially published exchange information and proprietary clustering algorithms. While we strive to ensure the utmost accuracy in representing exchange balances, it is important to note that these figures might not always encapsulate the entirety of an exchange’s reserves, particularly when exchanges refrain from disclosing their official addresses. We urge users to exercise caution and discretion when utilizing these metrics. Glassnode shall not be held responsible for any discrepancies or potential inaccuracies.
Please read our Transparency Notice when using exchange data.
- Join our Telegram channel.
- For on-chain metrics, dashboards, and alerts, visit Glassnode Studio.



















![Will Maple Finance [SYRUP] extend rally as TVL hits $2.2B? THESE metrics say…](https://d1x7dwosqaosdj.cloudfront.net/images/2026-07/4e3b0433345c4ea8a9dd04a53e363624.jpg)



