Прогноз цены биткоина (BTC) на 10 июня: волатильность растет около $106 тыс. по мере прорыва уровней «бычьего глаза»

cryptonews.ruPublished on 2024-02-08Last updated on 2025-06-08

После возвращения к уровню $105 000 в начале июня цена биткоина сегодня демонстрирует признаки краткосрочных колебаний. Более широкий рынок остается осторожным, цена биткоина колеблется около середины $105 000, поскольку трейдеры оценивают сопротивление чуть ниже $106 000. Хотя бычий импульс сохраняется на более высоких таймфреймах, ключевые индикаторы намекают на риски консолидации, приближающиеся к 10 июня.

Что происходит с ценой биткоина?

Динамика цены BTCUSD (Источник: TradingView)

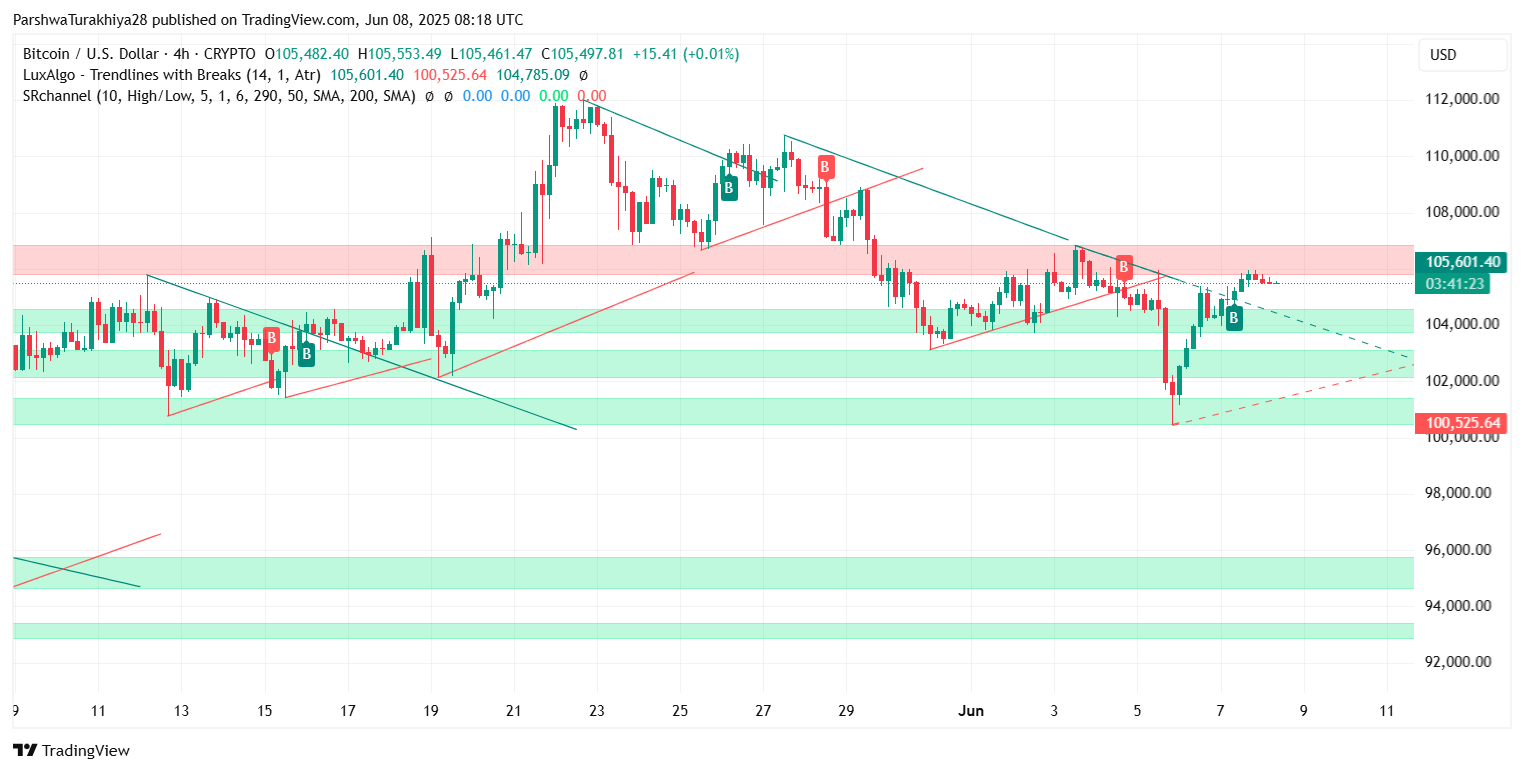
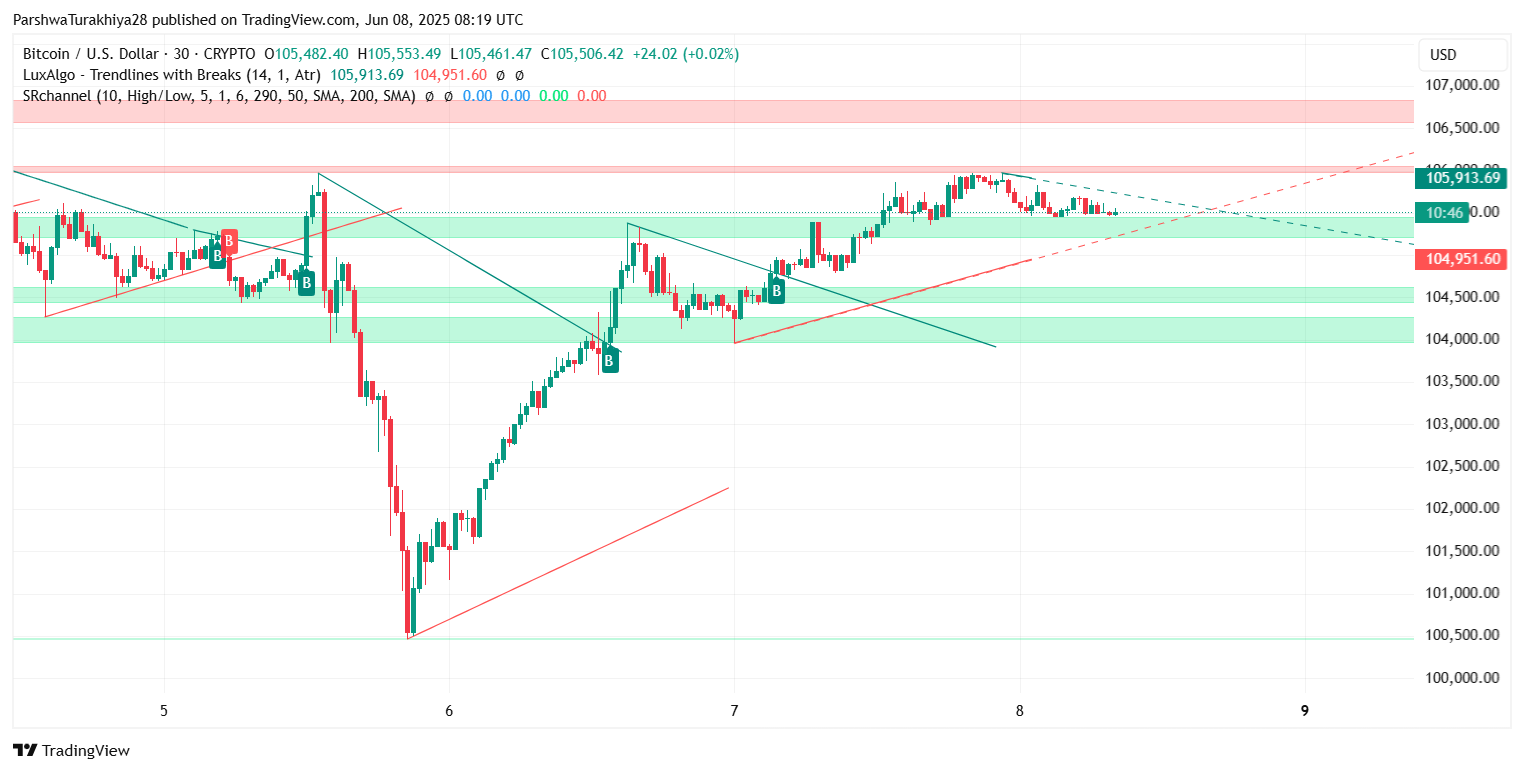
Ценовое действие биткоина показало решительный отскок от области $102 000, восстановившись более чем на 3% всего за две сессии. Этот шаг последовал за отскоком от слияния динамической поддержки около 100-ЕМА и горизонтального спроса около $101 000. Однако 4-часовой график показывает, что цена снова застопорилась около значительного блока сопротивления между $105 800 и $106 900 — области, которая совпадает с верхней полосой Боллинджера и предыдущими зонами отклонения с конца мая.

Недавнее обновление цен на биткоины подчеркивает, насколько тесно актив закручен в краткосрочном симметричном треугольнике, с растущим давлением прорыва по мере сжатия волатильности. Эта модель формируется чуть ниже ключевого сопротивления и обычно предшествует направленному движению, либо подтверждая продолжение прорыва, либо указывая на краткосрочную коррекцию.

RSI и MACD указывают на краткосрочную осторожность

Динамика цены BTCUSD (Источник: TradingView)

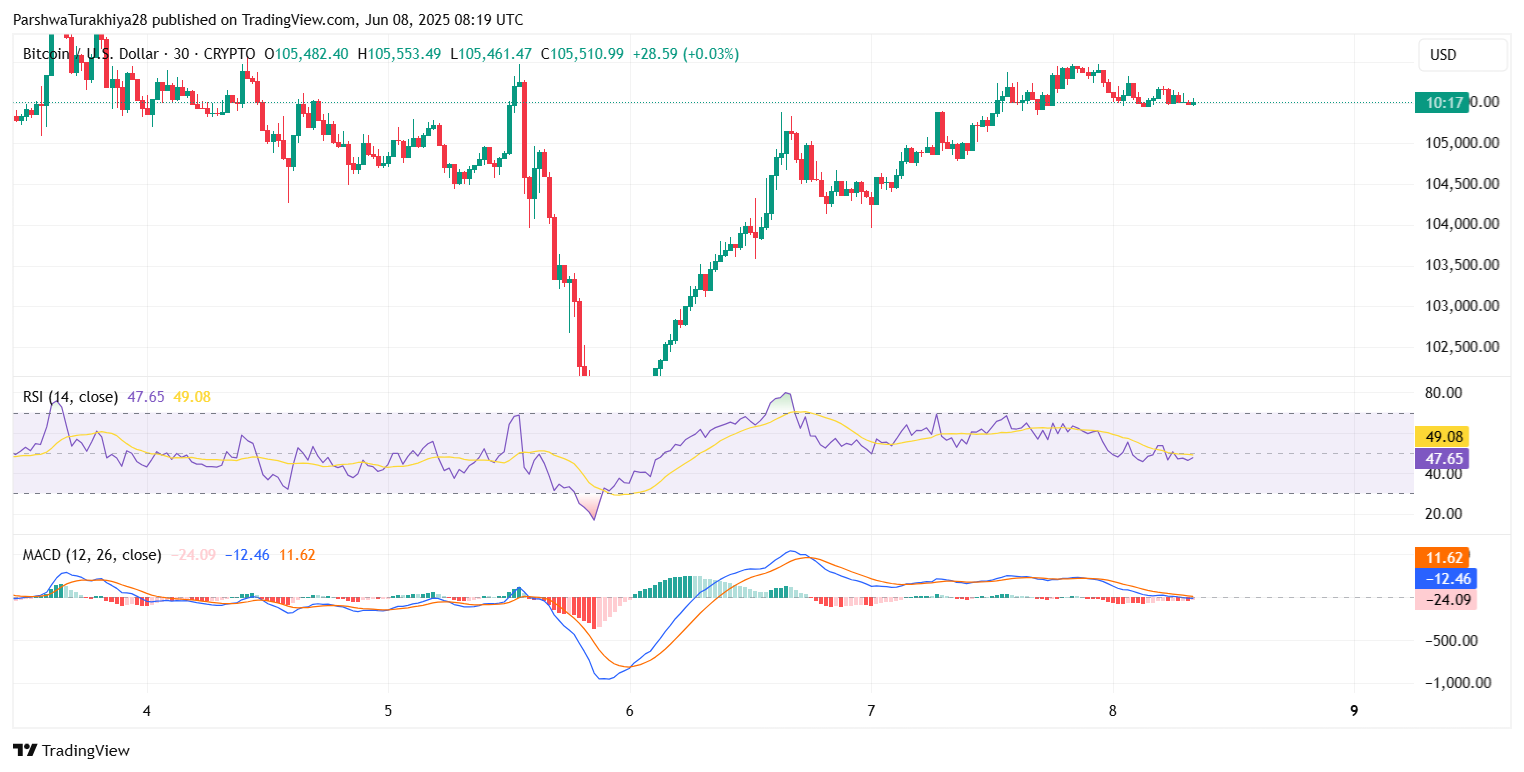
Индикаторы импульса на 30-минутном и 4-часовом графиках отражают осторожность, несмотря на отскок. RSI на 30-минутном графике в настоящее время колеблется около нейтральной зоны 50 (47,65), не в силах пробиться выше, несмотря на многочисленные внутридневные попытки. Это расхождение между ценовой силой и импульсом RSI предполагает ослабление бычьего давления на текущих уровнях.

Гистограмма MACD, хотя и положительная, выравнивается после недавнего бычьего пересечения. Это плато указывает на то, что покупательский интерес может ослабевать, и быкам нужен явный толчок объема, чтобы поддерживать дальнейший рост. Без этого волатильность цены биткоина может увеличиться в обоих направлениях в течение следующих 24–48 часов.

Ключевые кластеры EMA и анализ Ишимоку

Динамика цены BTCUSD (Источник: TradingView)

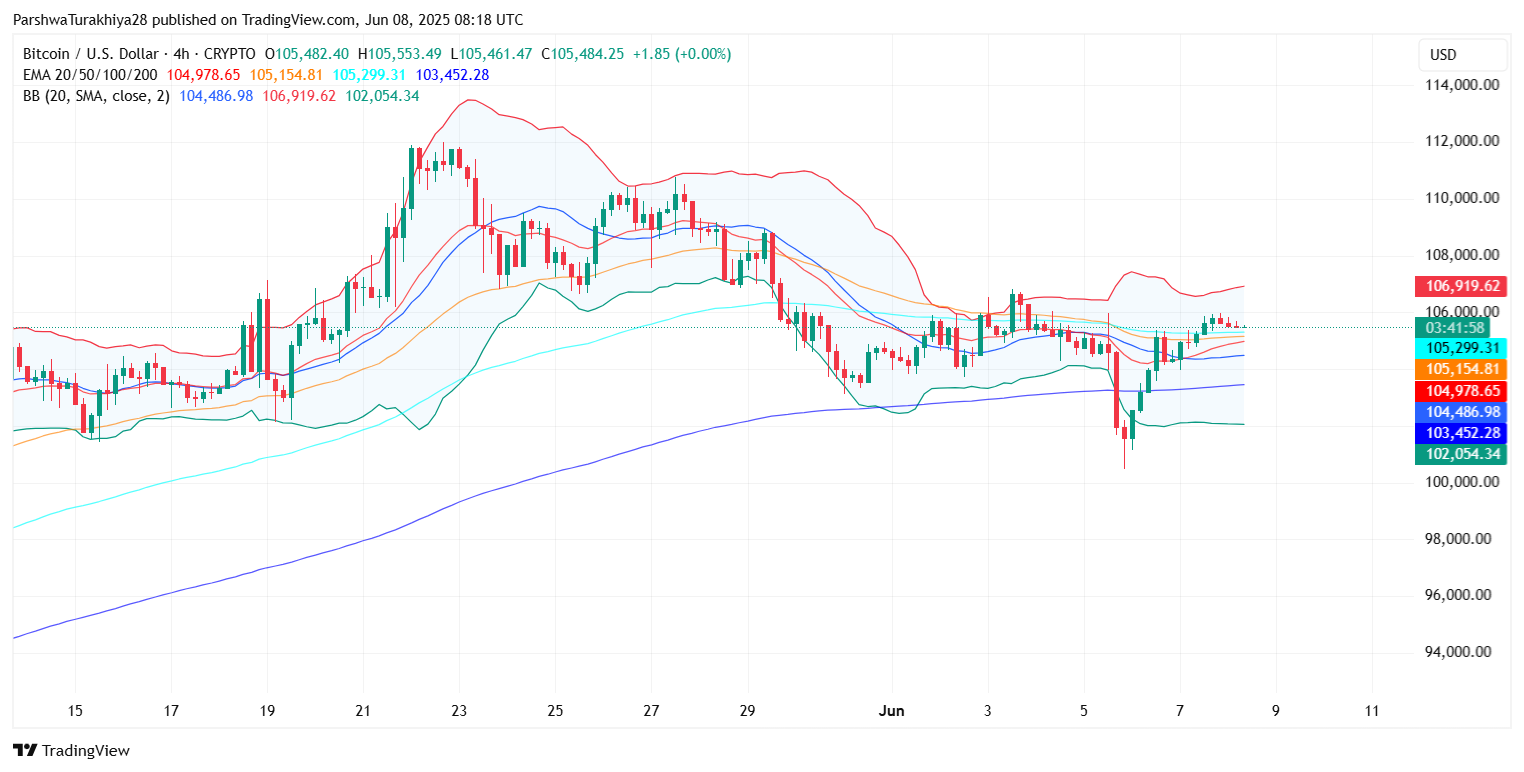
На 4-часовом графике цена биткоина торгуется выше кластера EMA 20/50/100, который в настоящее время находится между $104 900 и $105 300. Эта зона выступает в качестве внутридневной динамической поддержки, и потеря ниже $104 800 сведет на нет краткосрочную бычью структуру.

Динамика цены BTCUSD (Источник: TradingView)

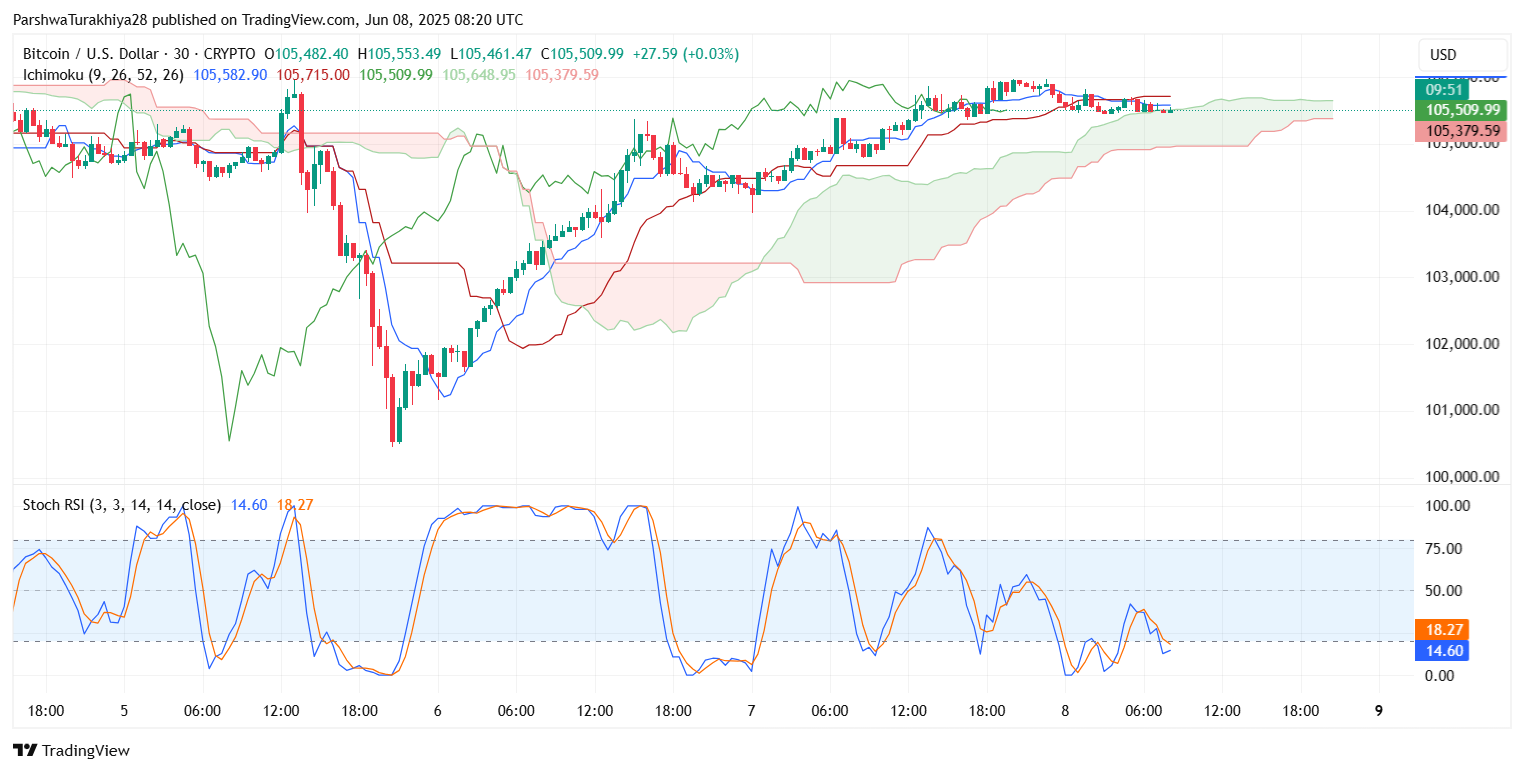
Облако Ишимоку на 30-минутном графике показывает, что BTC пытается удержаться выше плоской линии Киджун-сен на уровне $105 400, но будущее облако выглядит тонким и медвежьим, что указывает на уязвимость к незначительным откатам.

Между тем, полосы Боллинджера остаются узкими, отражая снижение волатильности цены биткоина, которая часто предшествует резким направленным движениям. Дневное закрытие выше $106 500 будет означать чистый прорыв и потенциально обнажит область $108 300–$109 000, последний раз протестированную в конце мая.

Перспективы более высокого временного интервала остаются конструктивными

Динамика цены BTCUSD (Источник: TradingView)

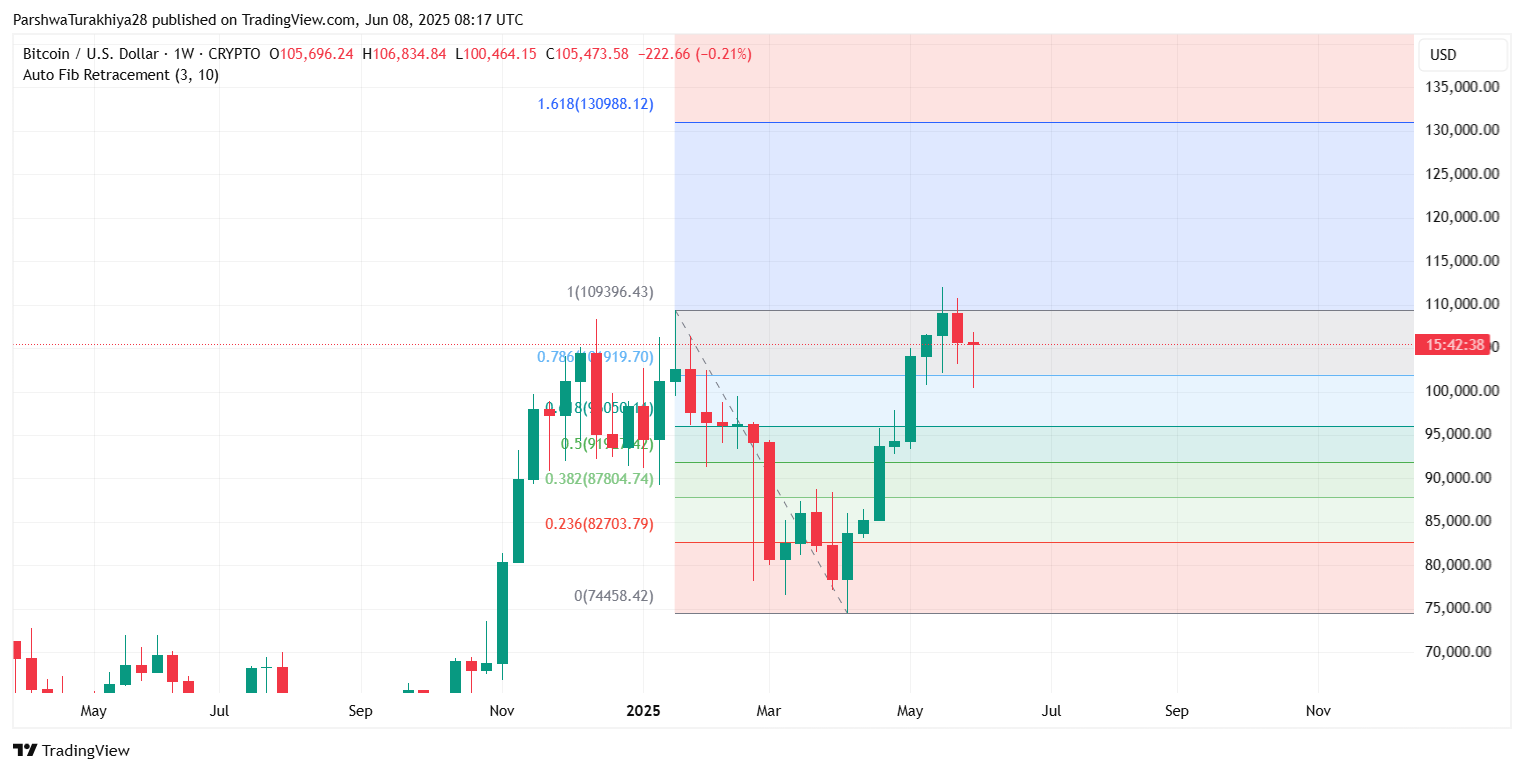
На недельном таймфрейме цена биткоина формирует более высокую низкую структуру после восстановления уровня коррекции Фибоначчи 0,618 на уровне $100 942. Этот уровень сохранялся во время майской коррекции, а уровень Фибоначчи 0,786 около $104 900 теперь выступает в качестве среднесрочной поддержки. Если BTC удержится выше этого уровня Фибоначчи до 10 июня, следующей важной целью роста останется максимум $109 000, за которым последует расширенная проекция Фибоначчи 1,618 на уровне $130 900.

Динамика цены BTCUSD (Источник: TradingView)

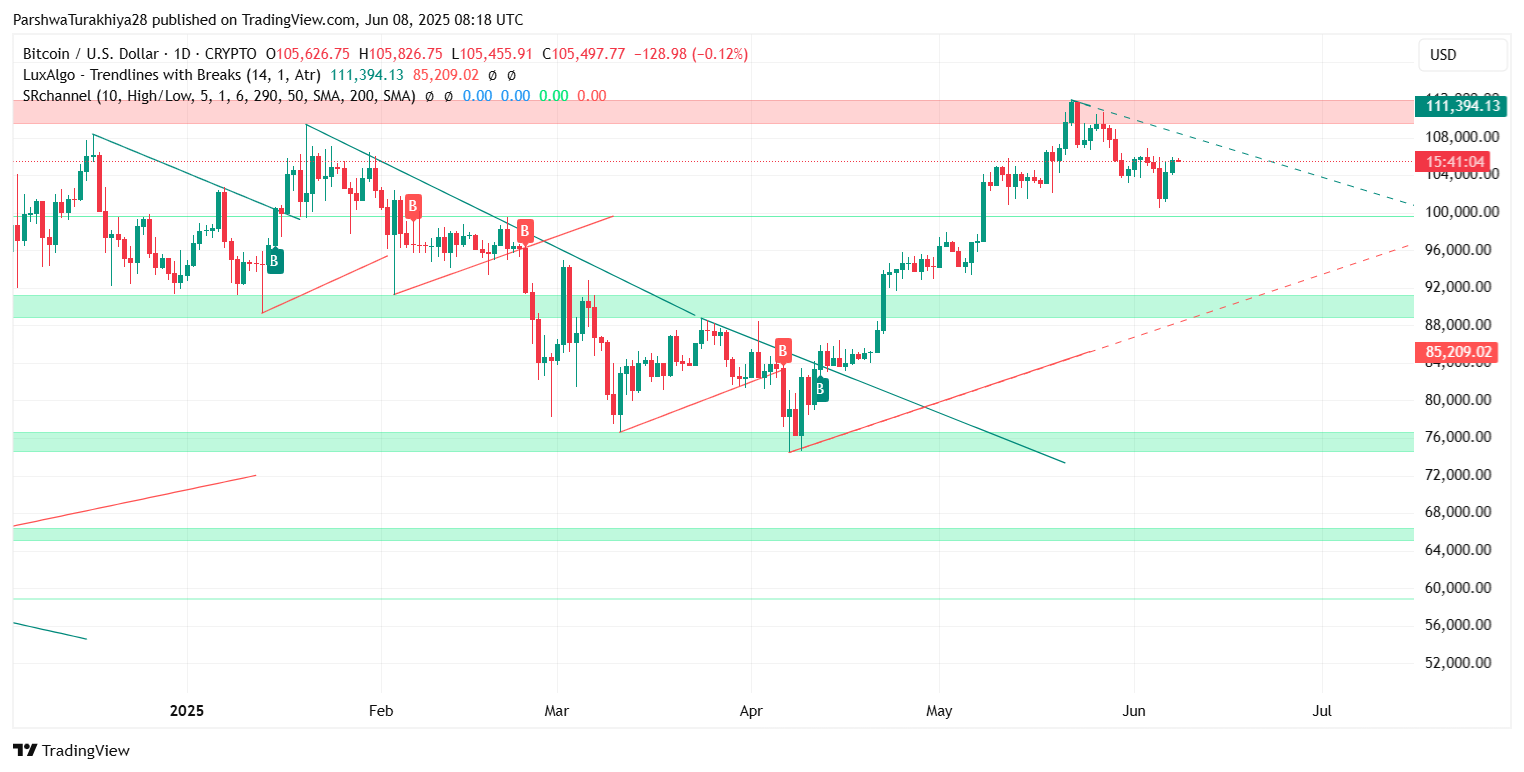
График 1D также подтверждает это предубеждение, поскольку BTC торгуется значительно выше зоны прорыва предыдущего нисходящего тренда. Однако все еще видна зона предложения чуть выше $106 800, и цене необходимо решительно очистить этот диапазон, чтобы сохранить бычий импульс.

Почему цена биткоина сегодня растет?

Динамика цены BTCUSD (Источник: TradingView)

Многие трейдеры задают вопрос: почему цена биткоина сегодня растет? Ответ кроется в сочетании факторов. Во-первых, недавний отскок от линий поддержки EMA и прорыв бычьего треугольника на часовом графике возобновили краткосрочный интерес. Во-вторых, макроэкономические настроения вокруг снижения инфляции в США и голубиные сигналы центральных банков повысили аппетит к риску среди основных криптоактивов.

Скачки объема около $104 000 также указывают на сильный институциональный интерес к заявкам, возможно, подпитываемый спросом, связанным с ETF, и накоплением в кошельке на блокчейне. Тем не менее, без подтверждения прорыва выше $106 900, ценовое действие остается технически ограниченным в краткосрочной перспективе.

Таблица прогнозов BTC на 10 июня

Индикатор/Уровень Стоимость (приблизительная) Сигнал
Немедленное сопротивление $106,900 Уровень крупного прорыва
Зона поддержки $104,800 – $105,000 Кластер EMA, Фибоначчи 0,786
MACD (30 мин.) Слабый бычий Сглаживание
RSI (30 мин) 47.65 Нейтрально-медвежья дивергенция
Смещение полос Боллинджера Узкий диапазон Сжатие перед прорывом
Ichimoku Kijun (30-min) $105,400 Внутридневная поддержка
Еженедельное ключевое сопротивление $109,000 Еженедельный максимум
Долгосрочная цель роста $130,900 Расширение Фибоначчи 1.618

В заключение, цена биткоина сегодня демонстрирует устойчивость, но также признаки истощения ниже $106 900. Прорыв выше этой зоны будет необходим для быков, чтобы повторно протестировать предыдущие максимумы, в то время как падение ниже $104 800 может спровоцировать краткосрочную коррекцию в направлении области $102 500. Трейдерам следует внимательно следить за структурой треугольника и поддержкой EMA, поскольку ценовое действие биткоина движется в зону принятия решений на предстоящую неделю.

Trending Cryptos

Related Reads

On the Eve of Its U.S. Journey, SK Hynix Plummets Sharply

Just before its highly anticipated U.S. listing, SK Hynix saw its share price plummet dramatically, losing over 14% in a single day. The sell-off was triggered by market fears of a potential slowdown in AI capital expenditure. This followed a news report suggesting Meta might sell "excess AI compute," which was later amended to remove the word "excess." The initial phrasing sparked a chain reaction in investor sentiment, linking it to a potential peak in AI demand. Despite the sharp downturn, the article argues this is likely an overreaction driven by market sentiment and structural de-leveraging, rather than a fundamental reversal of the AI trend. The author points out that even if Meta proceeds, it could be an optimization of existing assets, not a systemic demand contraction. SK Hynix is in the final stages of its U.S. IPO via an ADR listing on Nasdaq, aiming to raise approximately $29.4 billion—one of the largest such offerings ever. The funds are earmarked for expanding domestic Korean production capacity for HBM (High Bandwidth Memory) and advanced packaging. A key motivation for the U.S. listing is to achieve a valuation re-rating, escaping the so-called "Korea discount" and tapping into the higher valuation multiples typically given to AI-related semiconductor stocks in the U.S. market. In conclusion, the article views the current price drop as a potential buying opportunity, suggesting the long-term industry fundamentals for SK Hynix—particularly its leading position in the crucial HBM market—remain strong. The significant capital raised from the IPO is also seen as a factor that could provide underlying support for the stock post-listing.

Odaily星球日报20m ago

On the Eve of Its U.S. Journey, SK Hynix Plummets Sharply

Odaily星球日报20m ago

World Cup Upsets Keep Coming, the 'Dumb Money' in Prediction Markets Got Me Laughing

The 2026 FIFA World Cup has been marked by frequent upsets, turning prediction markets into a high-stakes game of chance. Odaily Planet Daily examines several high-profile cases where "smart money" bets went disastrously wrong, questioning if these losses offer any contrarian insights. A major upset occurred when underdog Cape Verde held football powerhouse Spain to a 0-0 draw. A trader, betting $1 million on a Spanish victory at 0.92 odds to earn $85,000, instead lost their entire principal. This match set a precedent for underdogs stifling favorites. Similarly, Portugal, despite featuring star Cristiano Ronaldo, was held to a 1-1 draw by debutants DR Congo. A trader with a 49% win rate lost over $243,000 predicting a Portuguese win. The article highlights the case of a notorious "anti-indicator" address, @Zzzz87. After initially losing over $620,000 (with a sub-40% win rate) by betting on underdog upsets, the address switched strategy. It began backing favorites in the knockout stages, reportedly turning a $269,000 profit in a week, despite being down $255,000 over the past month. This exemplifies the market's volatility and the difficulty of establishing a consistent strategy. The core conclusion is that football's inherent unpredictability defies simple logic based on player valuations or national rankings. Whether following "smart money" or betting against "dumb money," the only certainty is uncertainty. The article advises enthusiasts to enjoy the games while remaining adaptable in their approach to the prediction markets.

Odaily星球日报27m ago

World Cup Upsets Keep Coming, the 'Dumb Money' in Prediction Markets Got Me Laughing

Odaily星球日报27m ago

Trading

Spot

Hot Articles

What is $BITCOIN

DIGITAL GOLD ($BITCOIN): A Comprehensive Analysis Introduction to DIGITAL GOLD ($BITCOIN) DIGITAL GOLD ($BITCOIN) is a blockchain-based project operating on the Solana network, which aims to combine the characteristics of traditional precious metals with the innovation of decentralized technologies. While it shares a name with Bitcoin, often referred to as “digital gold” due to its perception as a store of value, DIGITAL GOLD is a separate token designed to create a unique ecosystem within the Web3 landscape. Its goal is to position itself as a viable alternative digital asset, although specifics regarding its applications and functionalities are still developing. What is DIGITAL GOLD ($BITCOIN)? DIGITAL GOLD ($BITCOIN) is a cryptocurrency token explicitly designed for use on the Solana blockchain. In contrast to Bitcoin, which provides a widely recognized value storage role, this token appears to focus on broader applications and characteristics. Notable aspects include: Blockchain Infrastructure: The token is built on the Solana blockchain, known for its capacity to handle high-speed and low-cost transactions. Supply Dynamics: DIGITAL GOLD has a maximum supply capped at 100 quadrillion tokens (100P $BITCOIN), although details regarding its circulating supply are currently undisclosed. Utility: While precise functionalities are not explicitly outlined, there are indications that the token could be utilized for various applications, potentially involving decentralized applications (dApps) or asset tokenization strategies. Who is the Creator of DIGITAL GOLD ($BITCOIN)? At present, the identity of the creators and development team behind DIGITAL GOLD ($BITCOIN) remains unknown. This situation is typical among many innovative projects within the blockchain space, particularly those aligning with decentralized finance and meme coin phenomena. While such anonymity may foster a community-driven culture, it intensifies concerns about governance and accountability. Who are the Investors of DIGITAL GOLD ($BITCOIN)? The available information indicates that DIGITAL GOLD ($BITCOIN) does not have any known institutional backers or prominent venture capital investments. The project seems to operate on a peer-to-peer model focused on community support and adoption rather than traditional funding routes. Its activity and liquidity are primarily situated on decentralized exchanges (DEXs), such as PumpSwap, rather than established centralized trading platforms, further highlighting its grassroots approach. How DIGITAL GOLD ($BITCOIN) Works The operational mechanics of DIGITAL GOLD ($BITCOIN) can be elaborated on based on its blockchain design and network attributes: Consensus Mechanism: By leveraging Solana’s unique proof-of-history (PoH) combined with a proof-of-stake (PoS) model, the project ensures efficient transaction validation contributing to the network's high performance. Tokenomics: While specific deflationary mechanisms have not been extensively detailed, the vast maximum token supply implies that it may cater to microtransactions or niche use cases that are still to be defined. Interoperability: There exists the potential for integration with Solana’s broader ecosystem, including various decentralized finance (DeFi) platforms. However, the details regarding specific integrations remain unspecified. Timeline of Key Events Here is a timeline that highlights significant milestones concerning DIGITAL GOLD ($BITCOIN): 2023: The initial deployment of the token occurs on the Solana blockchain, marked by its contract address. 2024: DIGITAL GOLD gains visibility as it becomes available for trading on decentralized exchanges like PumpSwap, allowing users to trade it against SOL. 2025: The project witnesses sporadic trading activity and potential interest in community-led engagements, although no noteworthy partnerships or technical advancements have been documented as of yet. Critical Analysis Strengths Scalability: The underlying Solana infrastructure supports high transaction volumes, which could enhance the utility of $BITCOIN in various transaction scenarios. Accessibility: The potential low trading price per token could attract retail investors, facilitating wider participation due to fractional ownership opportunities. Risks Lack of Transparency: The absence of publicly known backers, developers, or an audit process may yield skepticism regarding the project's sustainability and trustworthiness. Market Volatility: The trading activity is heavily reliant on speculative behavior, which can result in significant price volatility and uncertainty for investors. Conclusion DIGITAL GOLD ($BITCOIN) emerges as an intriguing yet ambiguous project within the rapidly evolving Solana ecosystem. While it attempts to leverage the “digital gold” narrative, its departure from Bitcoin's established role as a store of value underscores the need for a clearer differentiation of its intended utility and governance structure. Future acceptance and adoption will likely depend on addressing the current opacity and defining its operational and economic strategies more explicitly. Note: This report encompasses synthesised information available as of October 2023, and developments may have transpired beyond the research period.

556 Total ViewsPublished 2025.05.13Updated 2025.05.13

What is $BITCOIN

Discussions

Welcome to the HTX Community. Here, you can stay informed about the latest platform developments and gain access to professional market insights. Users' opinions on the price of BTC (BTC) are presented below.

活动图片