Урок истории ETH: пересечения SMA ранее сигнализировали о крупных изменениях цен

cryptonews.ruPublished on 2022-03-31Last updated on 2025-03-31

  • Ethereum торгуется ниже $1810, поскольку на рынке преобладают медвежьи настроения.
  • Устойчивый отток валют свидетельствует о защитной позиции инвесторов ETH.
  • RSI и MACD отражают слабую динамику, при этом явных признаков разворота пока нет.

Цена Ethereum недавно упала ниже отметки $1810, поскольку на рынке криптовалют усилилось медвежье давление. Текущие технические и ончейн-индикаторы отражают осторожную позицию инвесторов. Торговая активность показывает признаки снижения, продолжается постоянный отток спотовых средств, а слабые показатели импульса сигнализируют о возможном продолжении нисходящего тренда.

Согласно последним рыночным данным, ставки финансирования Ethereum на основных биржах перешли в отрицательную зону. Это говорит о том, что многие трейдеры деривативов в настоящее время избегают высокорисковых длинных позиций с кредитным плечом по ETH. Исторические закономерности, наблюдаемые между ставками финансирования ETH и последующим ценовым движением, часто показывают сильную корреляцию.

Источник: CryptoQuant

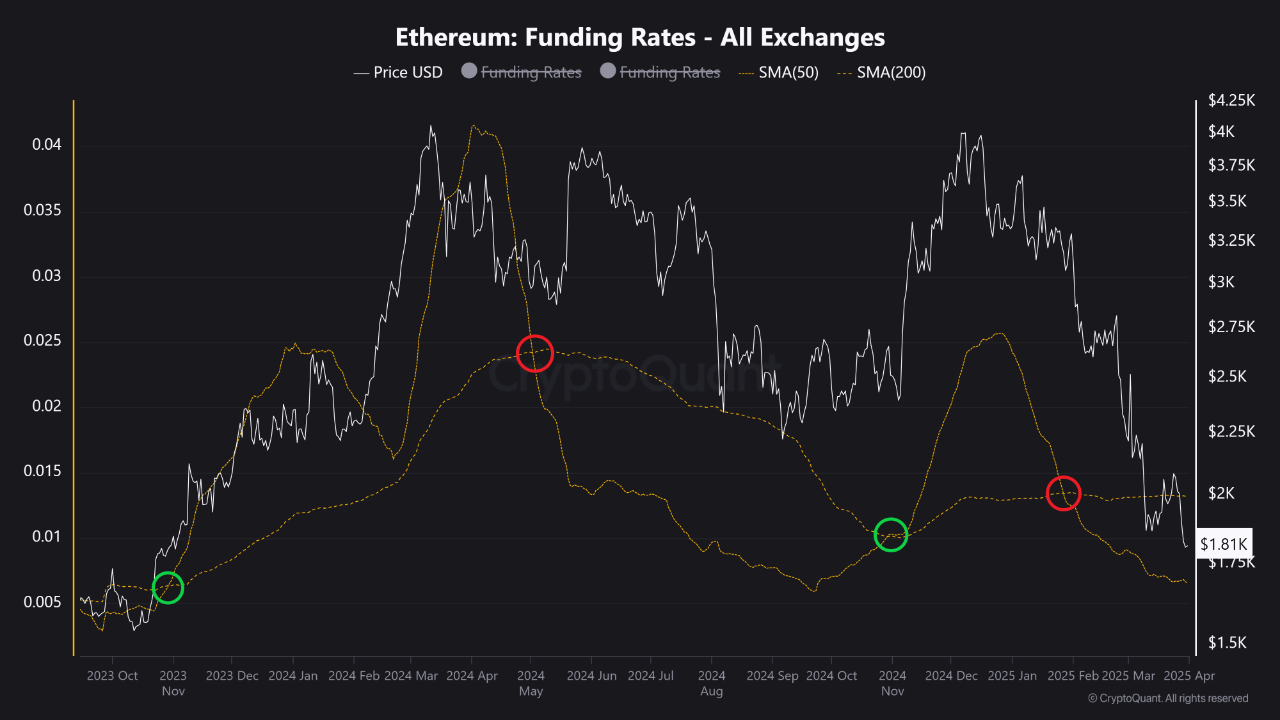
Как прошлые индикаторы предсказывали изменение цены ETH?

Предыдущие бычьи и медвежьи пересечения ключевых простых скользящих средних (SMA), таких как 50-дневная и 200-дневная, также исторически совпадали с основными изменениями цен Ethereum.

Например, бычье пересечение SMA в ноябре 2023 года предшествовало значительному ралли, в результате которого Ethereum поднялся выше $4000 к началу 2024 года. И наоборот, медвежье пересечение, наблюдавшееся в мае 2024 года, ознаменовало начало устойчивого спада рынка для ETH. Еще одна фаза восстановления последовала за бычьим пересечением в ноябре 2024 года, но последний медвежий сигнал SMA, произошедший в начале 2025 года, совпал с текущим падением цены, в результате чего ETH опустился ниже $2000.

Отток средств на спотовых биржах свидетельствует об осторожном поведении инвесторов

Последние данные CoinGlass показывают устойчивые оттоки спотовых бирж Ethereum. Это продолжает тенденцию, наблюдаемую с декабря 2023 года, при этом прошлые отчеты отмечали ежедневные чистые оттоки, регулярно превышающие $200 млн в определенные периоды.

Источник: Монетное стекло

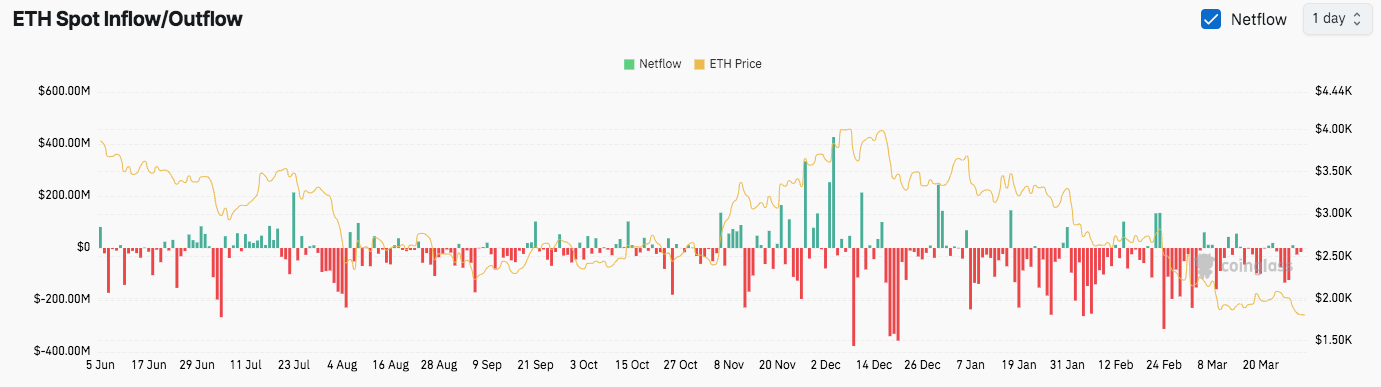
Эта устойчивая тенденция оттока, которая продолжалась до марта 2025 года, указывает на то, что инвесторы последовательно приобретают Ethereum напрямую с централизованных биржевых платформ. Хотя часть этого движения может отражать стратегический переход к долгосрочному самостоятельному хранению или стейкингу, она также в значительной степени соответствует значительной потере восходящего импульса цены ETH с момента его предыдущего пика цикла около $4000.

Модель сильного оттока в сочетании со снижением цен предполагает, что по крайней мере некоторые участники рынка могут занять более оборонительную позицию. Это может включать снижение подверженности непосредственным торговым средам в неопределенных рыночных условиях.

Технические индикаторы показывают слабую динамику, несмотря на сигналы перепроданности

На момент написания статьи Ethereum торговался по $1,806.31, зафиксировав снижение на 1.35% за последний день. Анализ 4-часового таймфрейма показывает технические индикаторы, такие как индекс относительной силы (RSI), читающий около 25.92, что сигнализирует о технических условиях перепроданности.

Источник: TradingView

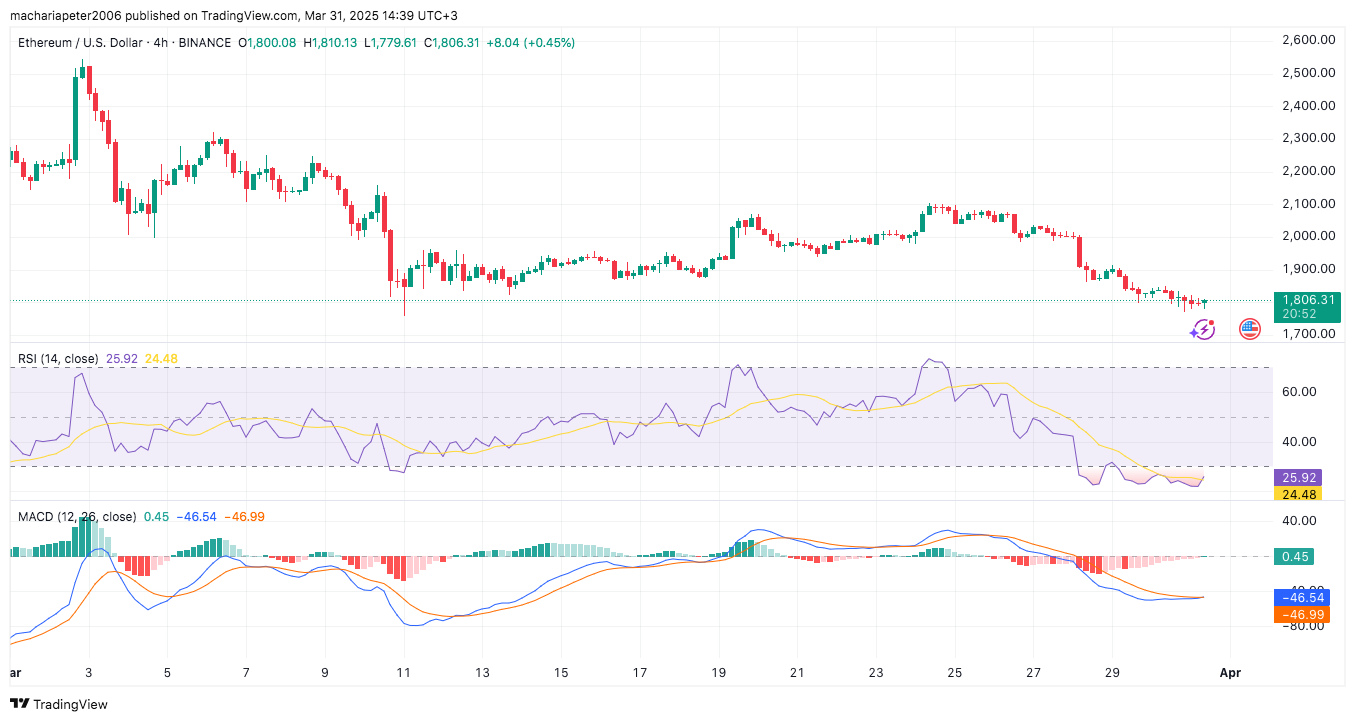
Кроме того, схождение и расхождение скользящих средних (MACD) также сигнализирует о слабости. Хотя линия MACD недавно поднялась выше своей сигнальной линии (часто бычий намек), обе линии остаются на отрицательной территории, а гистограмма показывает минимальную положительную дивергенцию.

Таким образом, на рынке в настоящее время отсутствуют сильные технические подтверждения неминуемого разворота тренда без более решительного сдвига индикатора в сторону повышения или восстановления RSI выше ключевых уровней, таких как 30 или 40.

Trending Cryptos

Related Reads

Report Interpretation: J.P. Morgan Details Micron's Pre-Earnings Sentiment, Current Hardware Sector Dynamics

Morgan Stanley analyst Joshua Meyers' report (June 21, 2026) highlights key trends in the hardware and semiconductor sector ahead of Micron's earnings. The core takeaways are: 1. **Micron & Memory:** Memory remains a high-conviction long theme, driven by strong AI demand and rising ASPs. However, investor focus is shifting to the sustainability of Micron's >80% gross margins and the specifics of potential new long-term supply agreements (SCAs). 2. **Hardware Supply Chain:** AI-related demand for servers, networking, and storage remains robust, but company performance is diverging. Celestica (CLS) shows improved margin confidence, Western Digital and Seagate benefit from pricing, Fabrinet (FN) sees predictable AI optics growth, and Teradyne (TER) anticipates a new Google customer. 3. **AI Capex & WFE Forecasts:** JPMorgan increased its Wafer Fab Equipment (WFE) market growth forecasts to 28% in 2026 and 29% in 2027. AI infrastructure financing is evolving, with higher project-level debt reducing constraints on capex expansion. The report signals that while the AI-driven hardware cycle is strong, the market is entering a phase focused on execution verification (e.g., Micron's SCA details, Fabrinet's ramp with Amazon) and valuation sustainability. Key near-term signals include Micron's guidance, Arista Networks' outlook, and the pace of demand normalization post potential tariff-related pull-ins.

marsbit3h ago

Report Interpretation: J.P. Morgan Details Micron's Pre-Earnings Sentiment, Current Hardware Sector Dynamics

marsbit3h ago

Research Report Analysis: The Fed's New Chair's Debut – New Leader, But Same Script?

Report Analysis: Federal Reserve's New Chair Debut – A New Captain, But the Same Script? Morgan Stanley's chief global economist Seth B. Carpenter analyzes the first FOMC meeting under new Fed Chair Kevin Warsh in a June 21 report. Warsh deliberately avoided providing forward guidance on interest rates, aligning with his philosophy. However, market expectations for a rate hike this year were reinforced. Key signals lie elsewhere: inflation may fall more than expected, and quantitative tightening (QT) could be more aggressive than anticipated. The FOMC's "dot plot" suggests only one rate hike in 2026. Carpenter argues that if inflation undershoots forecasts, the logic for even a single hike weakens, especially as projections indicate potential rate cuts in 2027. On QT, Warsh's stance is clear. Carpenter notes that measures like halving the Treasury's account balance could shrink the Fed's balance sheet by around $500 billion with minimal market impact. Combined with adjustments to reserve interest and liquidity rules, the ultimate QT scale may exceed expectations, though its market effect might be less disruptive unless the Fed actively sells Mortgage-Backed Securities (MBS). While Warsh initiated a review of the Fed's policy framework, the 2% inflation target remains intact for now. The report concludes that the market may be overestimating the significance of reduced forward guidance and the near-term rate hike risk, while potentially underestimating the scope and manageable nature of the coming balance sheet reduction. The key debates will hinge on upcoming core PCE data, the specifics of the QT path, and the framework review's findings.

marsbit3h ago

Research Report Analysis: The Fed's New Chair's Debut – New Leader, But Same Script?

marsbit3h ago

Critical Game Week: BTC Retracement Confirmation vs. HYPE Support Battle | Guest Analysis

This weekly analysis outlines a critical juncture for BTC and HYPE markets, focusing on key price level confirmations. **BTC Analysis:** BTC is at a pivotal point after a five-wave rally from the June 5th low of $59,100. The price has broken below a short-term rising channel's lower boundary, with the current move seen as a pullback to test this breakdown. Failure to reclaim this level could lead to a retest of the $59,000-$60,000 support zone. The core scenario hinges on this channel retest outcome. * **Key Levels:** Resistance at $64,500-$65,000 (channel boundary) and $69,500-$70,500. Support at $59,000-$60,000 and $55,000. * **Strategy:** A core bearish stance is maintained (20% short from last week), with short-term plans for tactical trades. Three detailed contingency plans (A/B/C) are provided for short positions on resistance tests or breakdowns, emphasizing strict stop-loss discipline. **HYPE Analysis:** HYPE shows strong momentum but is currently in a corrective phase after hitting a new high of $76.94. The price is retesting the crucial $64-$66 support area. * **Key Levels:** Resistance near $77 and $80-$82. Support at $64-$66 and $52-$54. * **Strategy:** The short-term approach is "buy on dips, avoid chasing rallies." A long position is considered only if clear stabilization signals appear at the $64-$66 or deeper $52-$54 support zones, with tight risk controls. **General Risk Management:** A standardized trailing stop-loss protocol is emphasized: set initial stop, breakeven at +1% profit, then trail stops upward to lock in gains. *Disclaimer: All analysis is presented as a personal trading framework, not investment advice. Market conditions are complex and require dynamic adjustment.*

marsbit4h ago

Critical Game Week: BTC Retracement Confirmation vs. HYPE Support Battle | Guest Analysis

marsbit4h ago

Trading

Spot
Futures

Hot Articles

Discussions

Welcome to the HTX Community. Here, you can stay informed about the latest platform developments and gain access to professional market insights. Users' opinions on the price of ETH (ETH) are presented below.

活动图片