Executive Summary
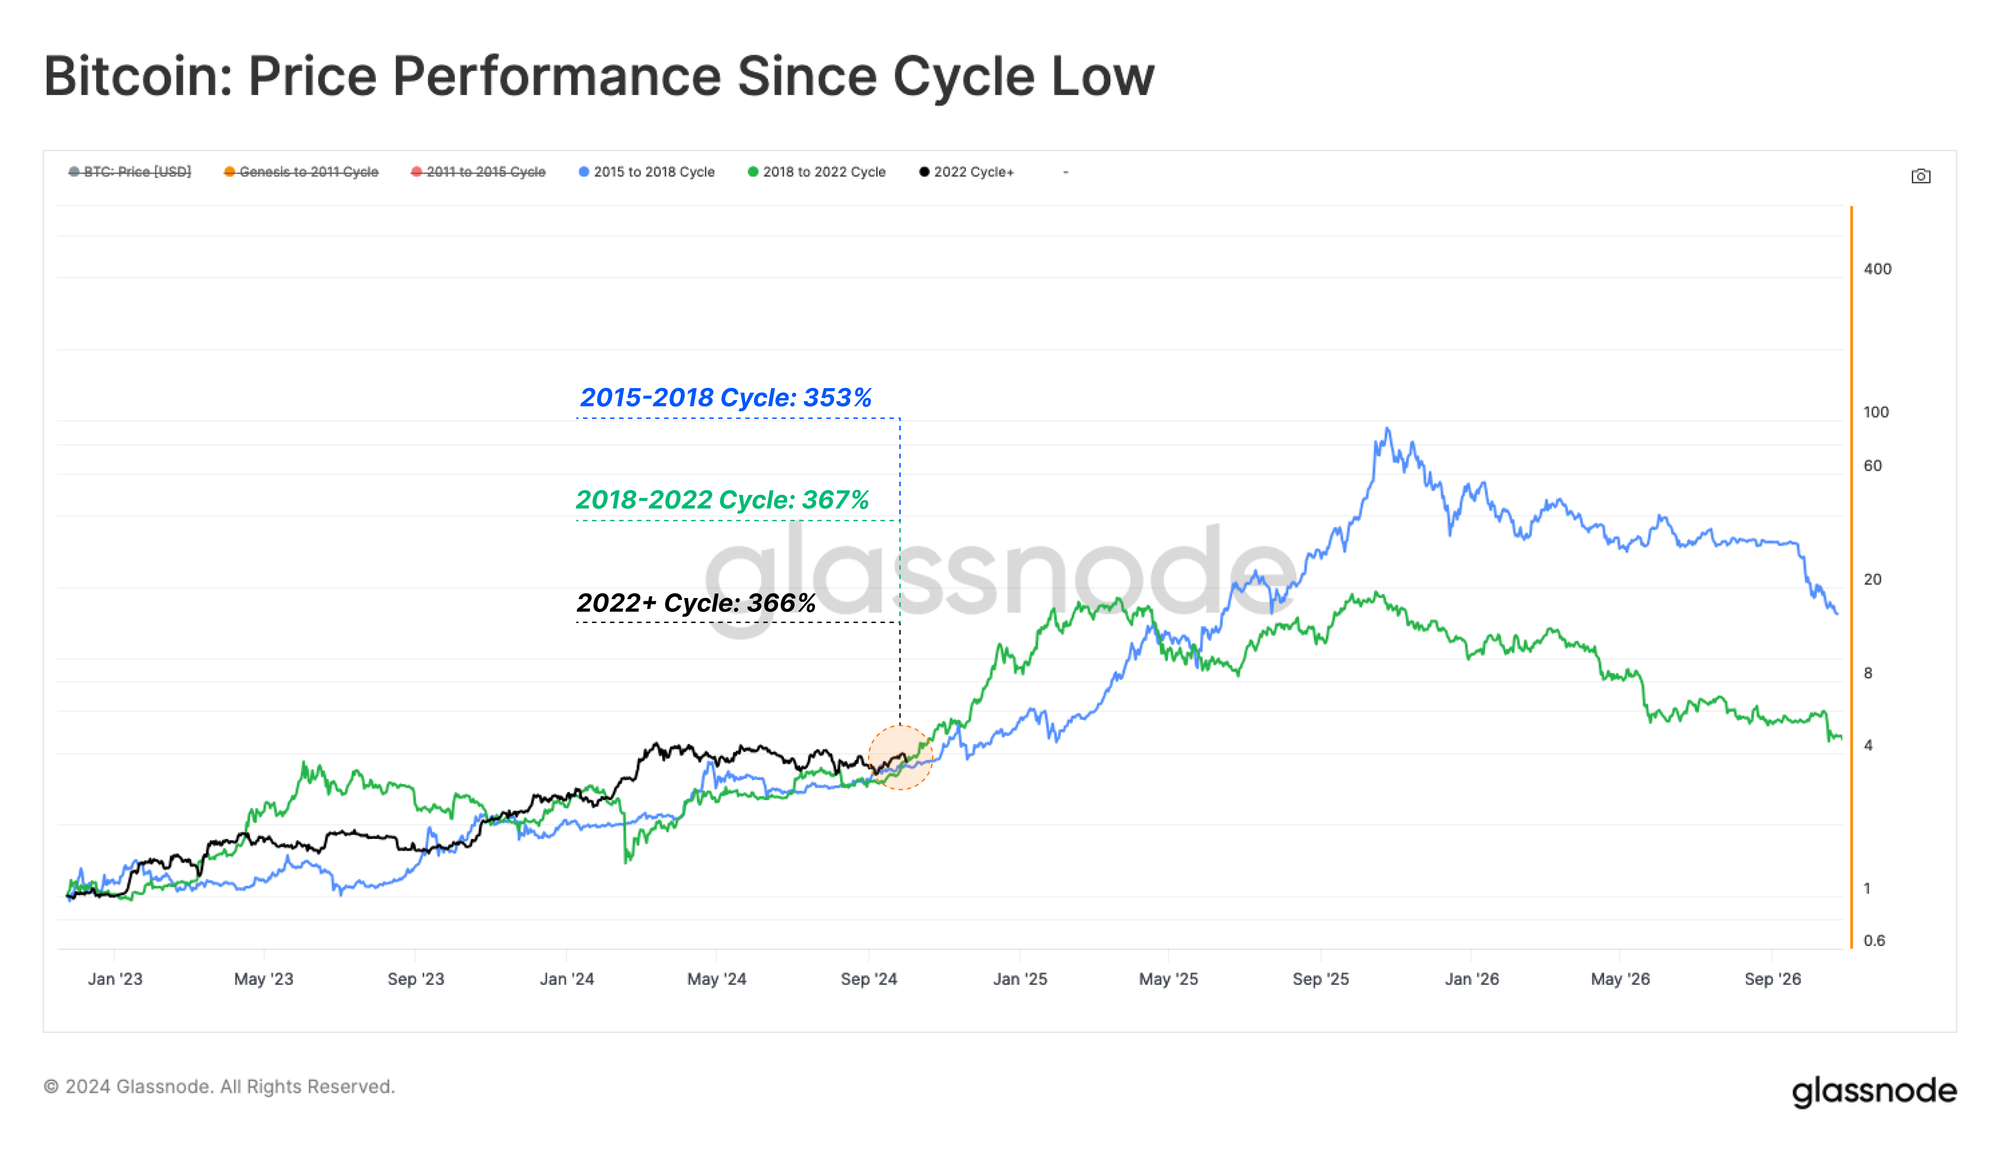
- When comparing Bitcoin’s cyclical price performance since the bear market was low, an uncanny similarity emerges over the prior three cycles, with the index trading at a nearly identical position.
- There has been a rise in the number of Long-term Holder coins held in loss, as large volumes of BTC acquired near the $73k ATH mature across the 155-day threshold.
- However, the magnitude of unrealized loss held by these investors remains small in scale, suggesting minimal financial pressure imposed on their portfolios.
- A clear improvement in Short-Term Holder profitability can be observed throughout the recent rally, providing relief for buyers who recently acquired their coins.
- The conviction of US ETF investors remains relatively robust, with only minor sell-side pressure taking place, despite being underwater on average inflow cost basis positions.
Cycle Navigation
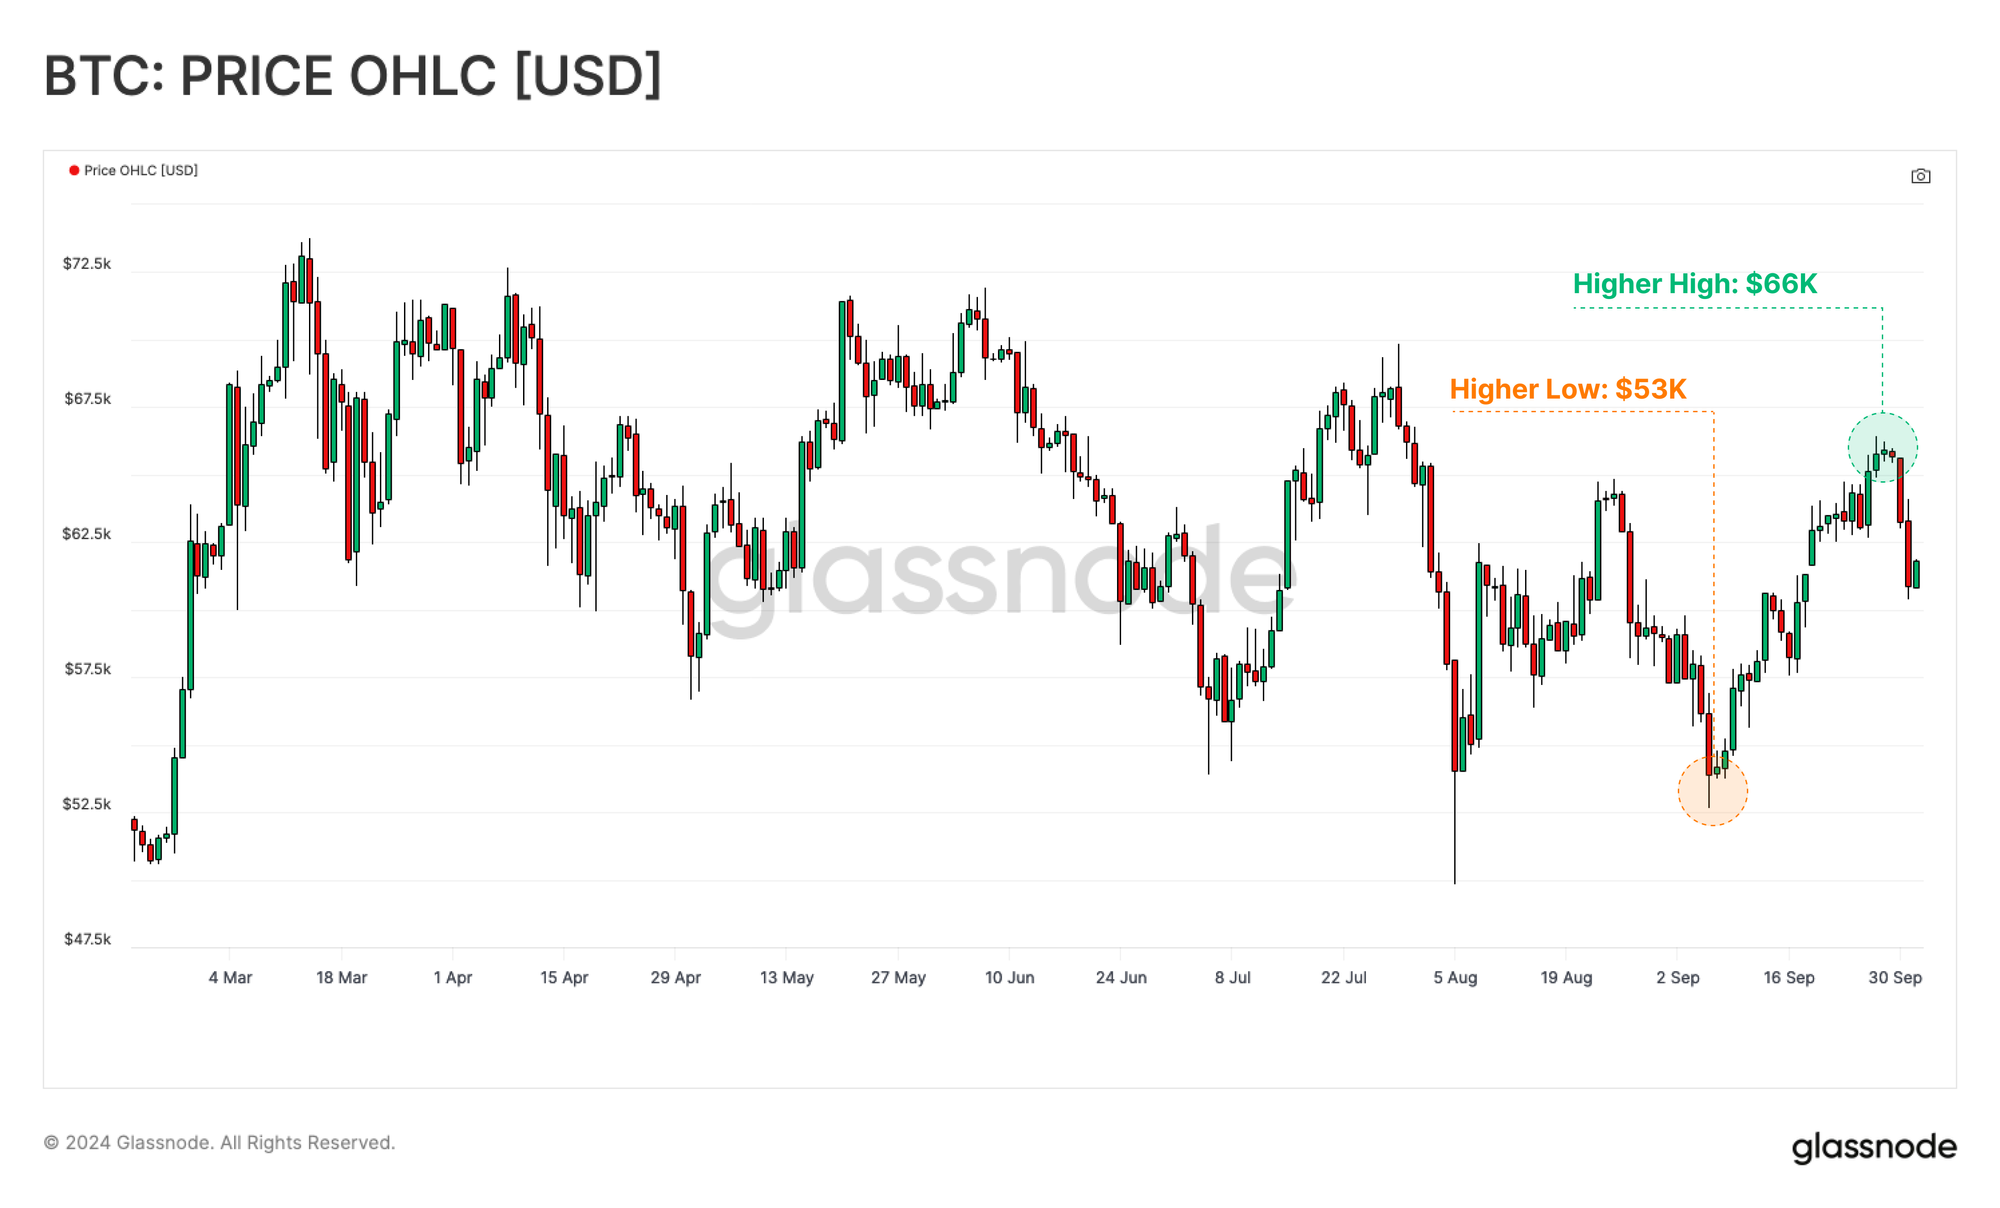
The Bitcoin market saw a relief rally back towards the $66k region last week, setting the first technical higher high since June. This price action provides the first inclinations that the structured downtrend may be approaching a phase shift.
The market pulled back to $60k early this week and is trading at $61.7k at the time of writing.
When we assess the price performance of Bitcoin from the cycle low, a remarkable similarity in performance emerges despite wildly differing market conditions. The reason for Bitcoin following such a similar path is a regular topic of debate, but it continues to provide an interesting framework for analysts to think about cycle structure and duration.
Both the 2015-16 🔵, and 2019-20 🟢 periods have traded in an oddly similar manner to the recovery seen in 2023-24 ⚫.
Deceptive Long-Term Holder Losses
One of the most powerful tools in on-chain analysis is our ability to gauge how many coins are held in profit or loss and the magnitude of unrealized paper gains/losses for investors. We can bolster this using cohorts, with the Long and Short-Term Holder cohorts particularly instructive.
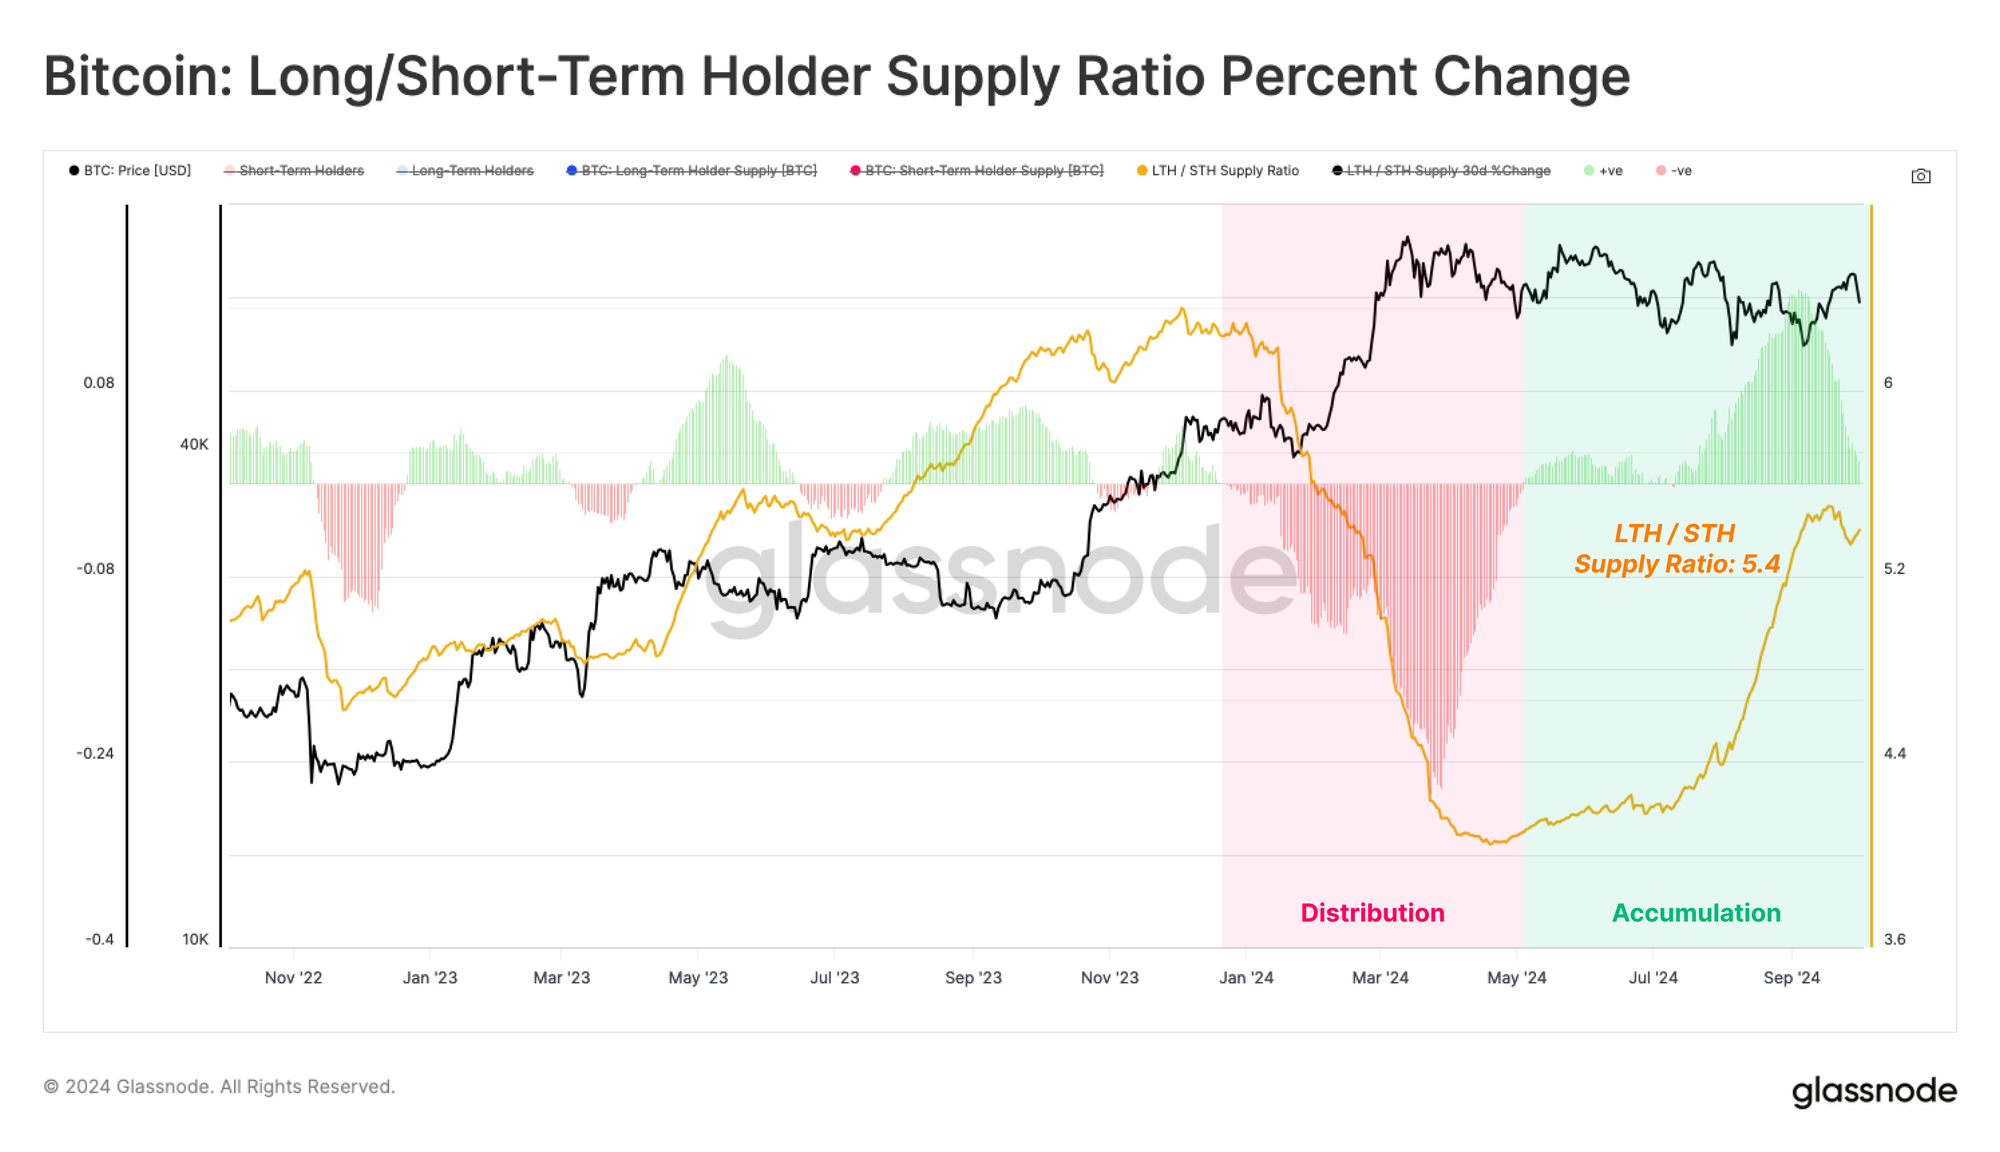
We can compare the Long/Short-Term Holder Supply Ratio to assess the balance between these cohorts. This lens shows a large volume of coins maturing into Long-Term Holder status, pushing this ratio to the highest level since mid-2021.
This suggests that HODLing persists as the dominant behaviour of Bitcoin investors.
However, we are also seeing a notable uptick in Long-Term Holder supply, held at an unrealized loss. This can be attributed to coins acquired in close proximity to the $73k ATH, which are now beginning to mature across the 155-day threshold.
Whilst unrealized losses can be interpreted as a form of financial pressure felt by investors, Long-Term Holder supply tends to remain held throughout periods of volatility.
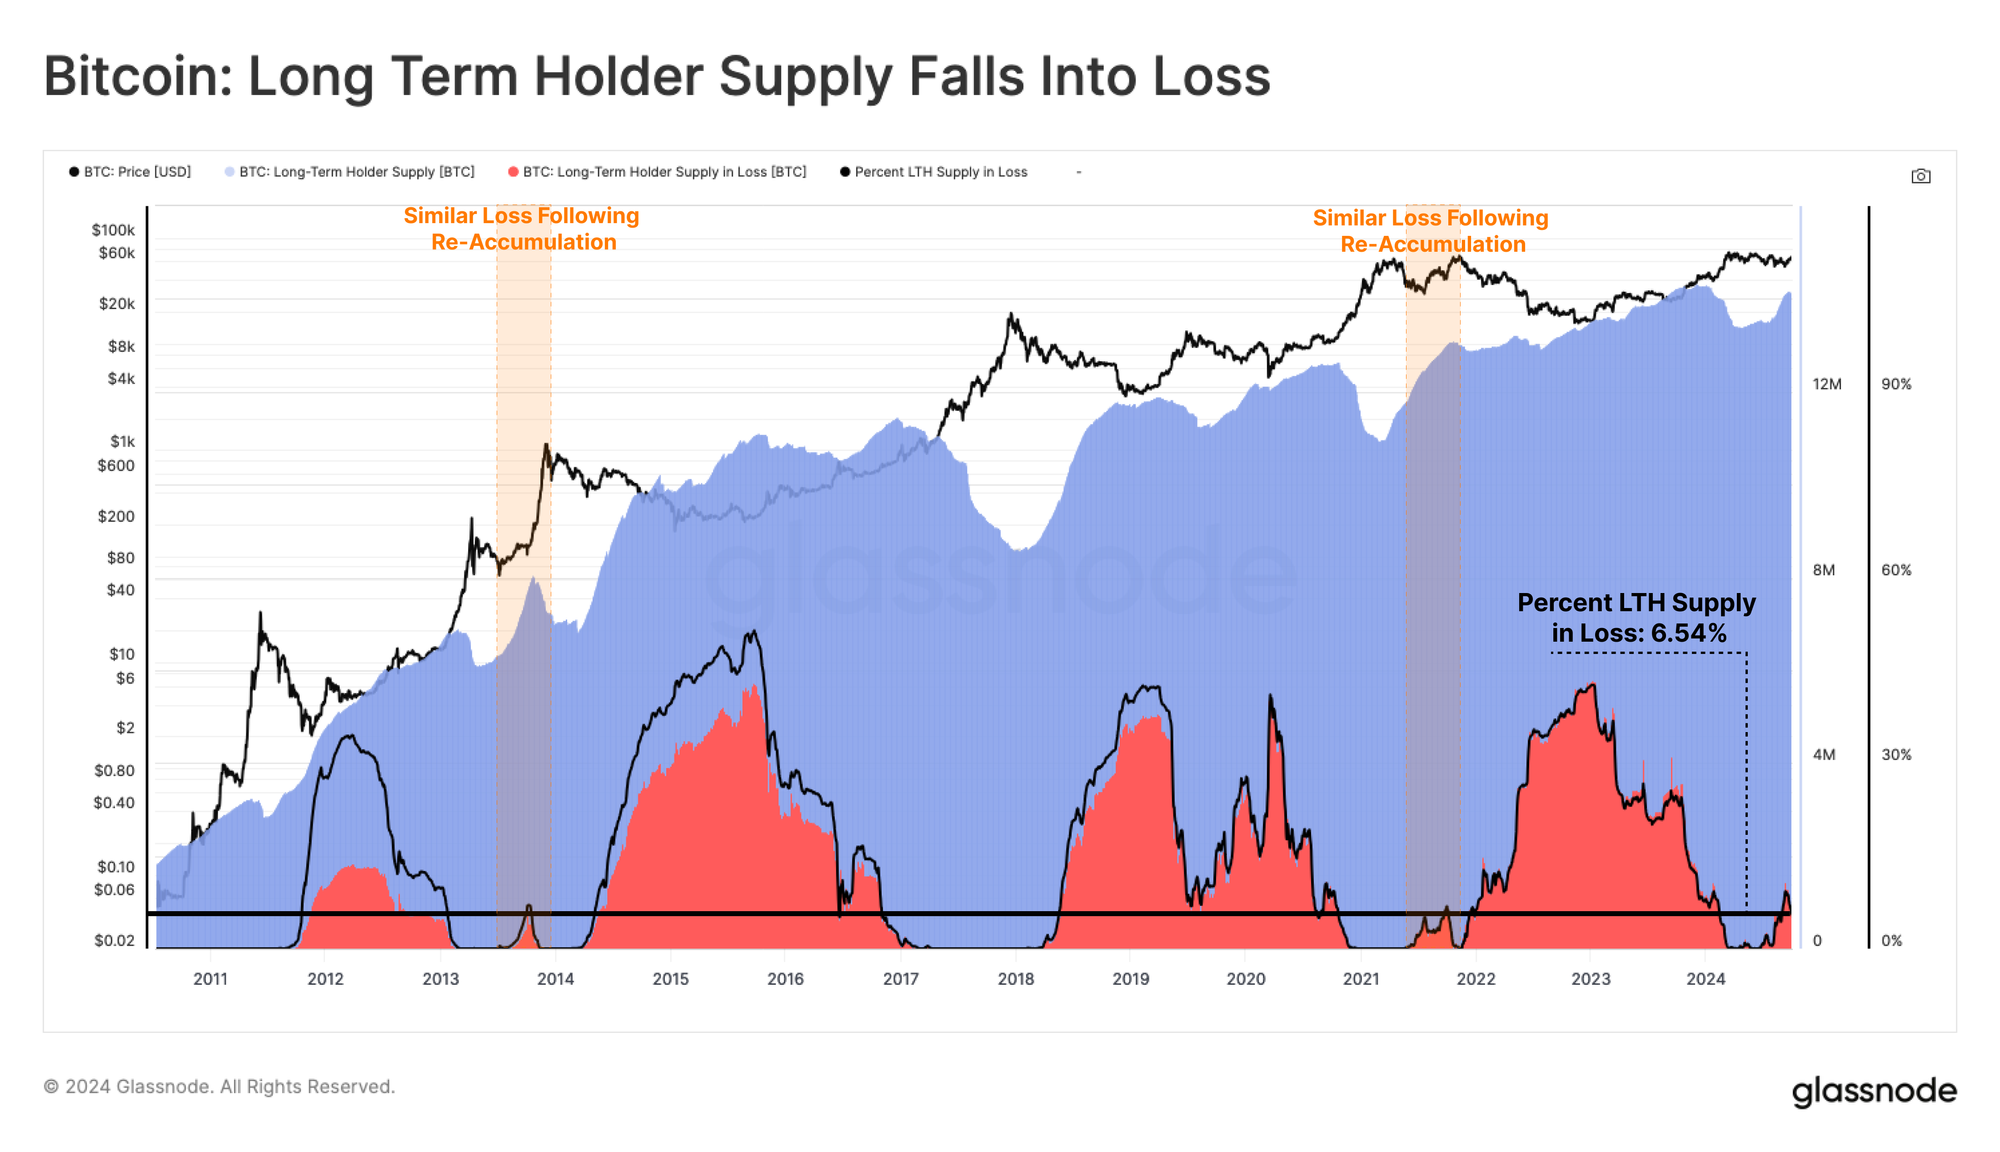
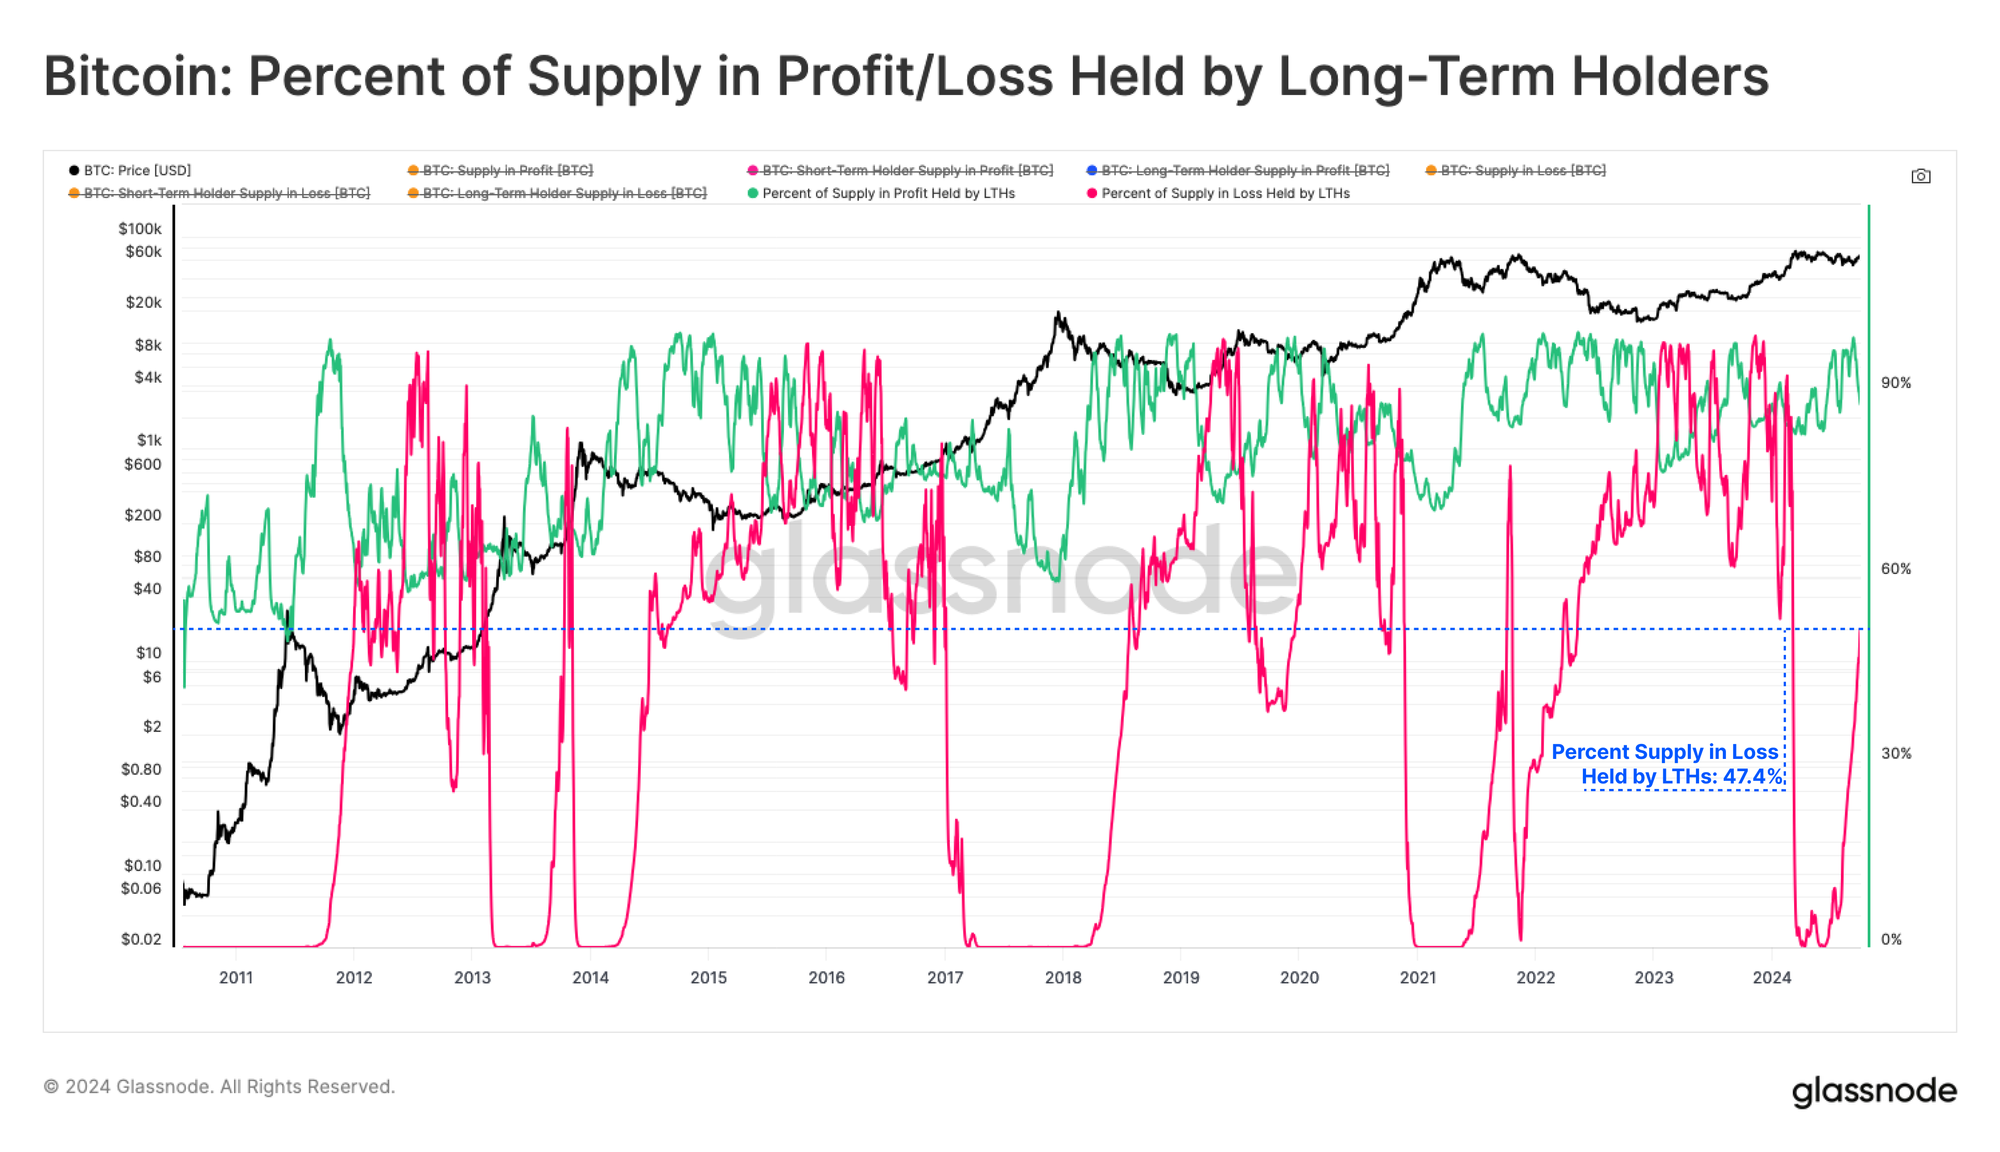
If we break down the proportion of total supply held in the loss by long-term holders, we see a surge in their dominance, with this cohort now accounting for 47.4% of all coins in the loss.
Again, similarities to the 2013, 2019 and 2021 periods emerge when investors entered a re-accumulation phase.
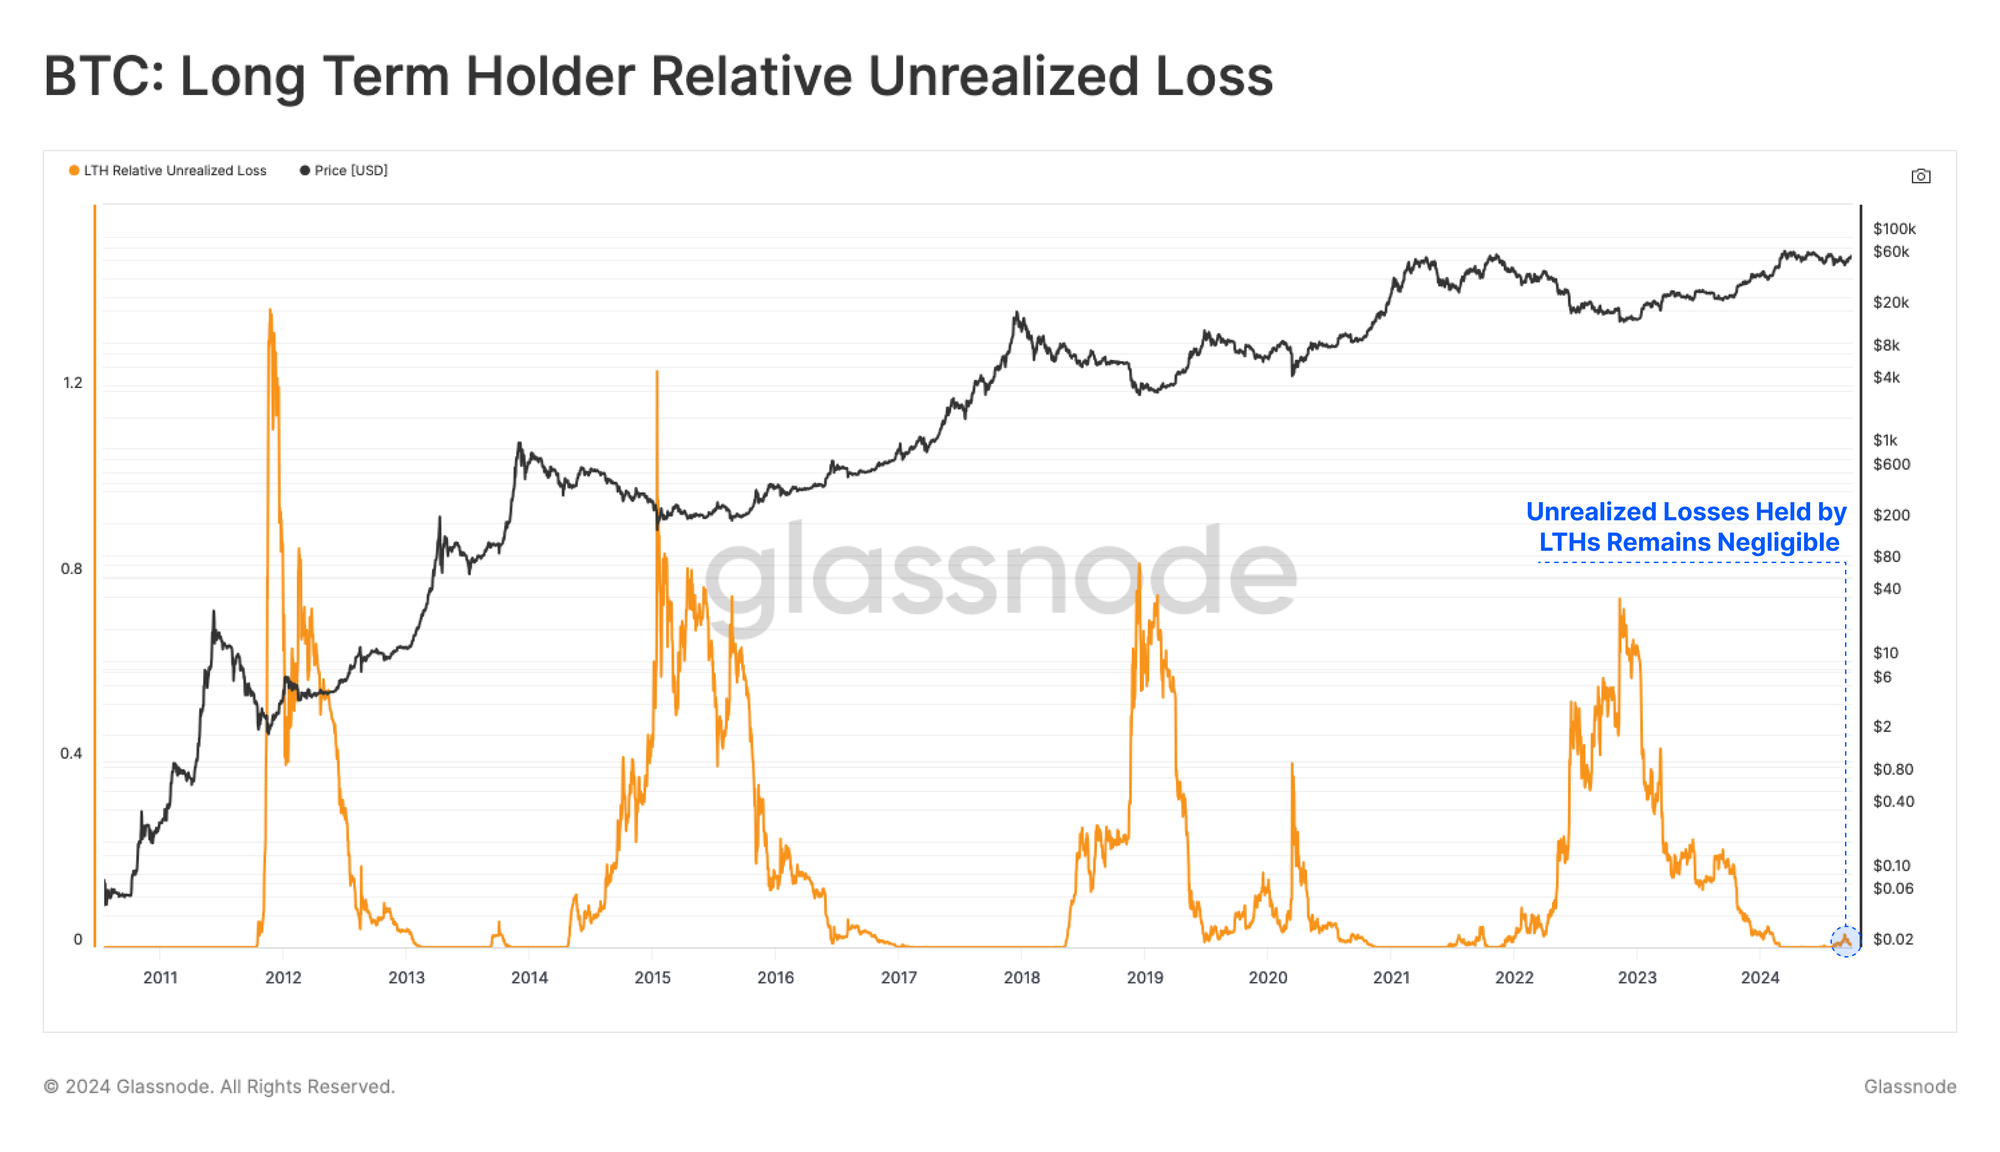
Despite LTHs accounting for 47.4% of the supply held in loss, the magnitude of the unrealized ‘paper’ losses held within these coins remains relatively small.
This is a constructive observation as it suggests that while many ‘top buyers’ are technically underwater on their holdings, the scale of their portfolio drawdown is relatively small, and the financial pressure may be interpreted as minimal.
Short-Term Holder Profitability Improves
To balance the equation, we can also look toward the Short-Term Holder cohort, which represents a pool of new demand in the market and tends to be more responsive to market volatility.
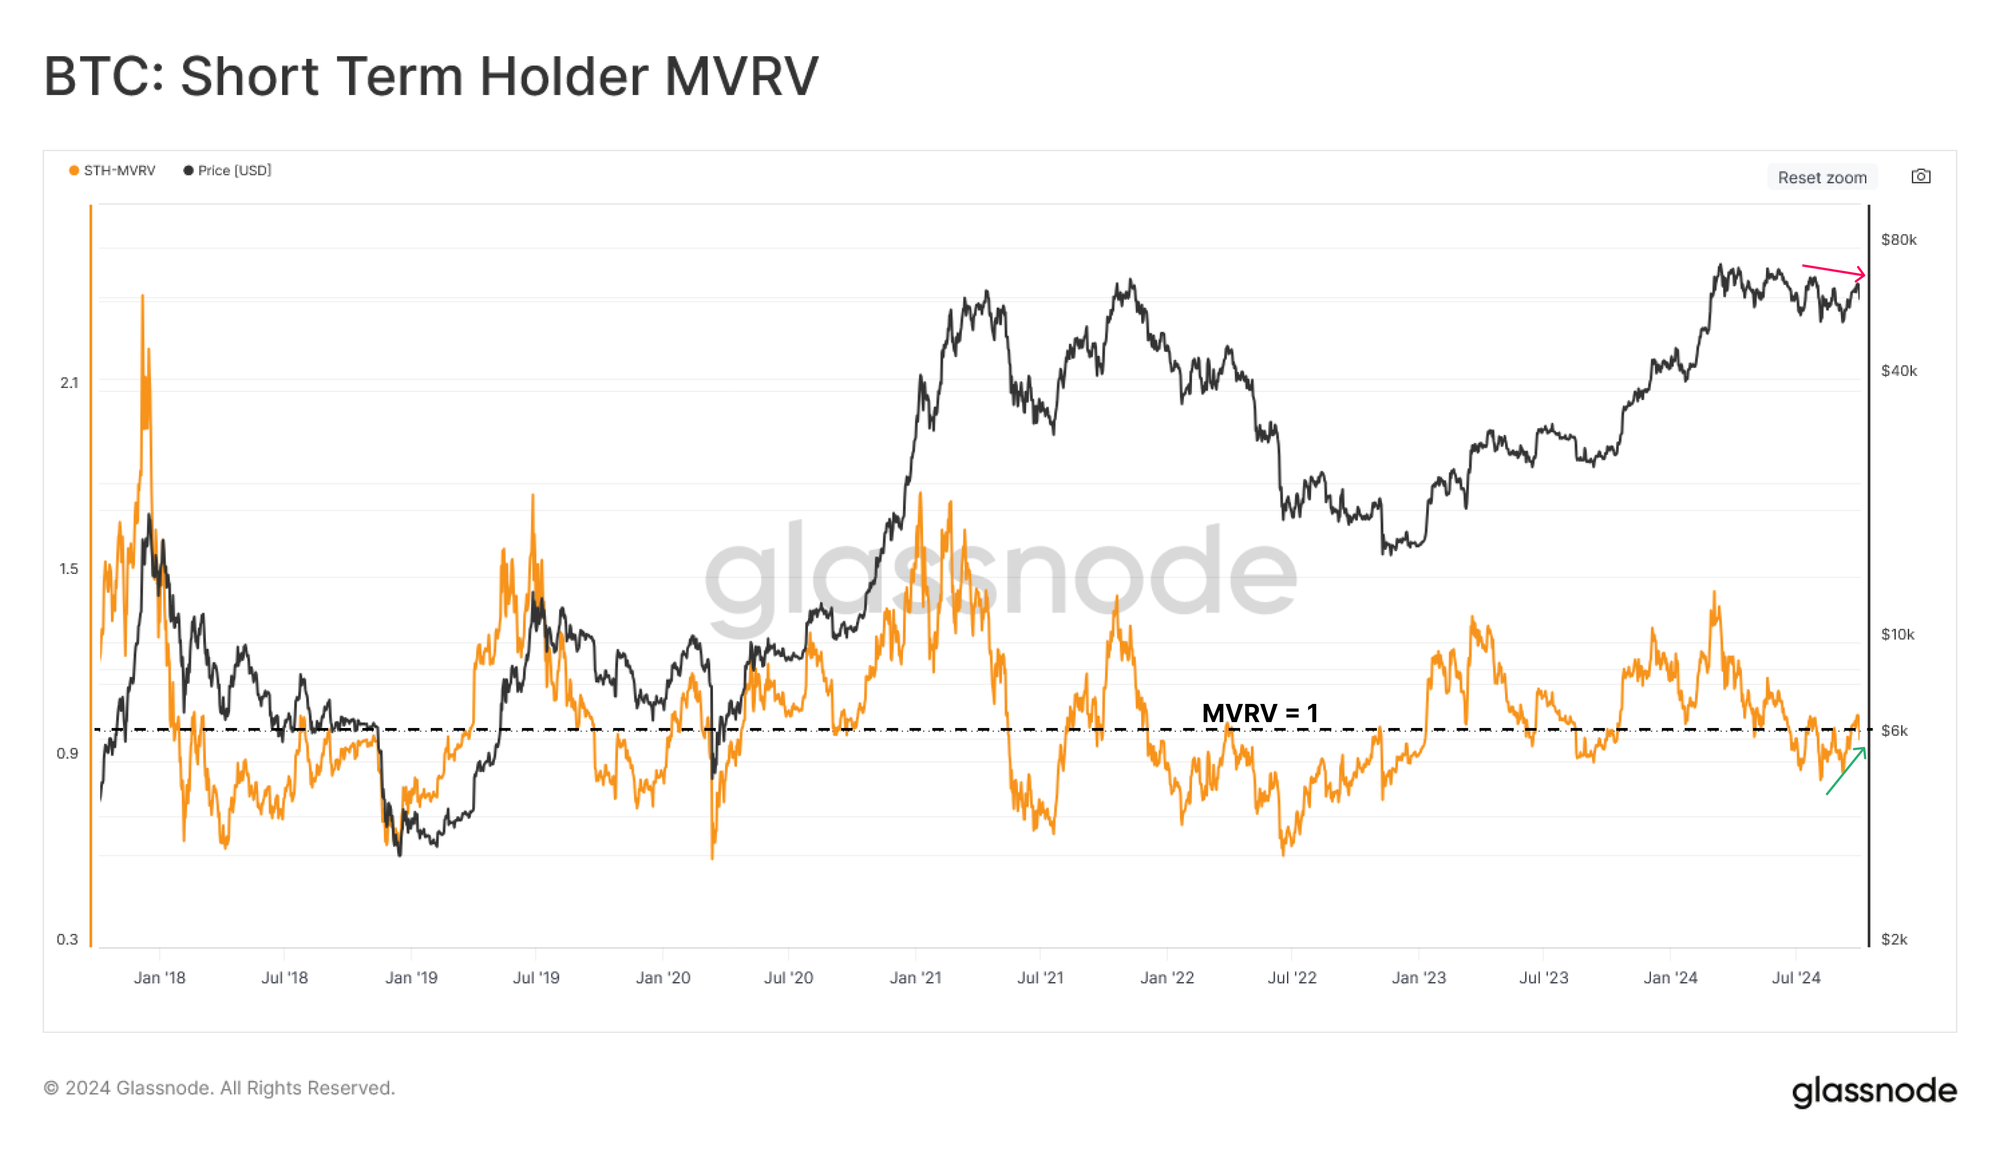
The Short-Term Holder MVRV metric describes the average unrealized profit/loss held by short-term holders. Over recent weeks, this metric has experienced several successive undercuts below the equilibrium value of 1, describing an STH cohort that is, on average, holding an unrealized loss.
However, the depth and the duration below 1.0 is unlike that seen during previous bear market structures, such as in 2022. A slight positive divergence is also developing, where the price is generally flat over the last month, but STH-MVRV is increasing.
Both of these observations suggest that the positioning and profitability of new investors are improving and, similar to the LTH cohort, may not be as financially stressful as in typical bear market conditions.
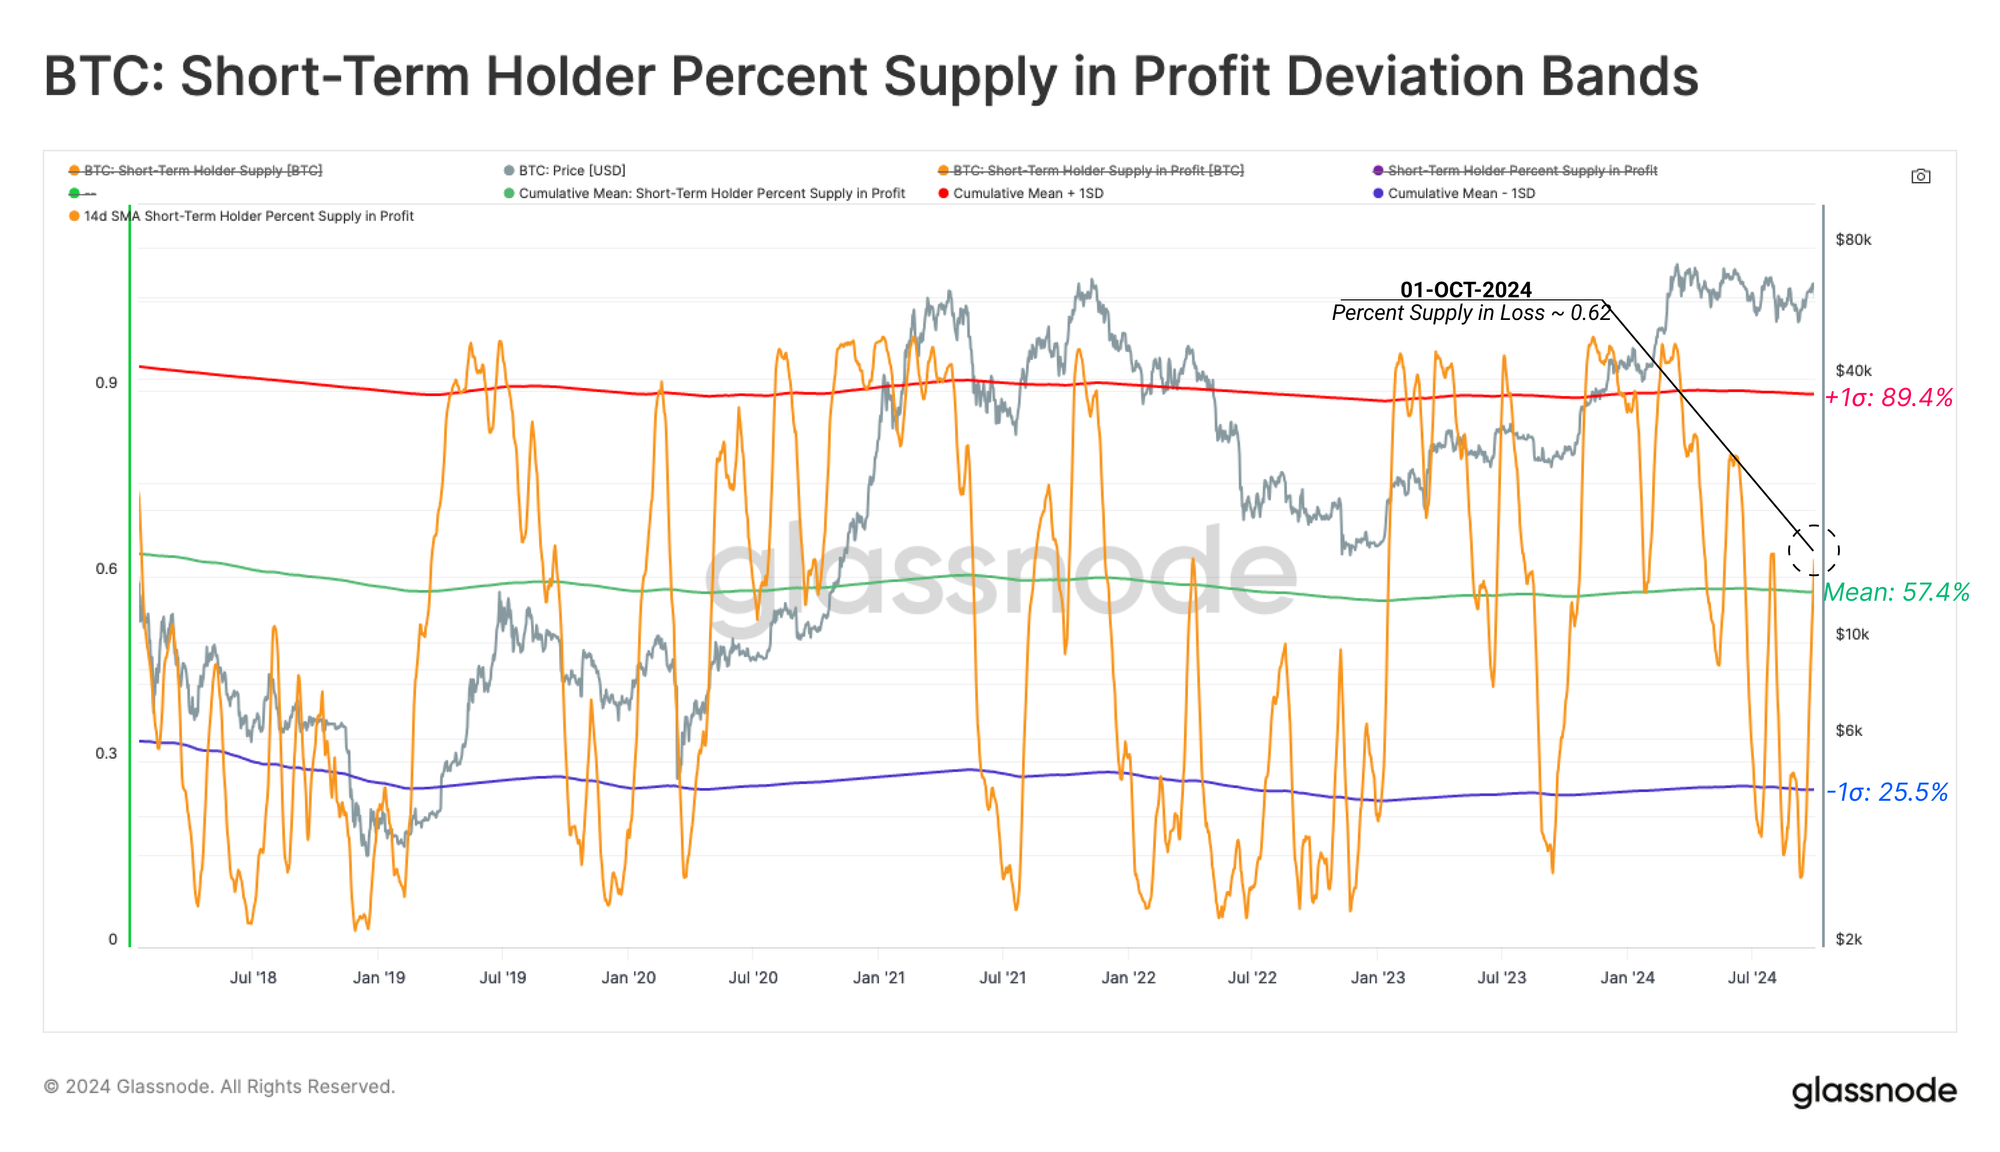
The percentage of Short-Term Holder Supply held in profit tells a similar story, with over 62% of their supply now held in a profitable position. From this, two key insights can be drawn:
- A significant volume of STH coins have a cost basis located between $53k and $66k
- A higher high in the percent of STH supply in profit has been established, again suggesting their profitability is improving and easing financial pressure on this cohort.
The recovery also places the Percent Supply in Profit near the long-term average for this metric, which is a noteworthy rebound.
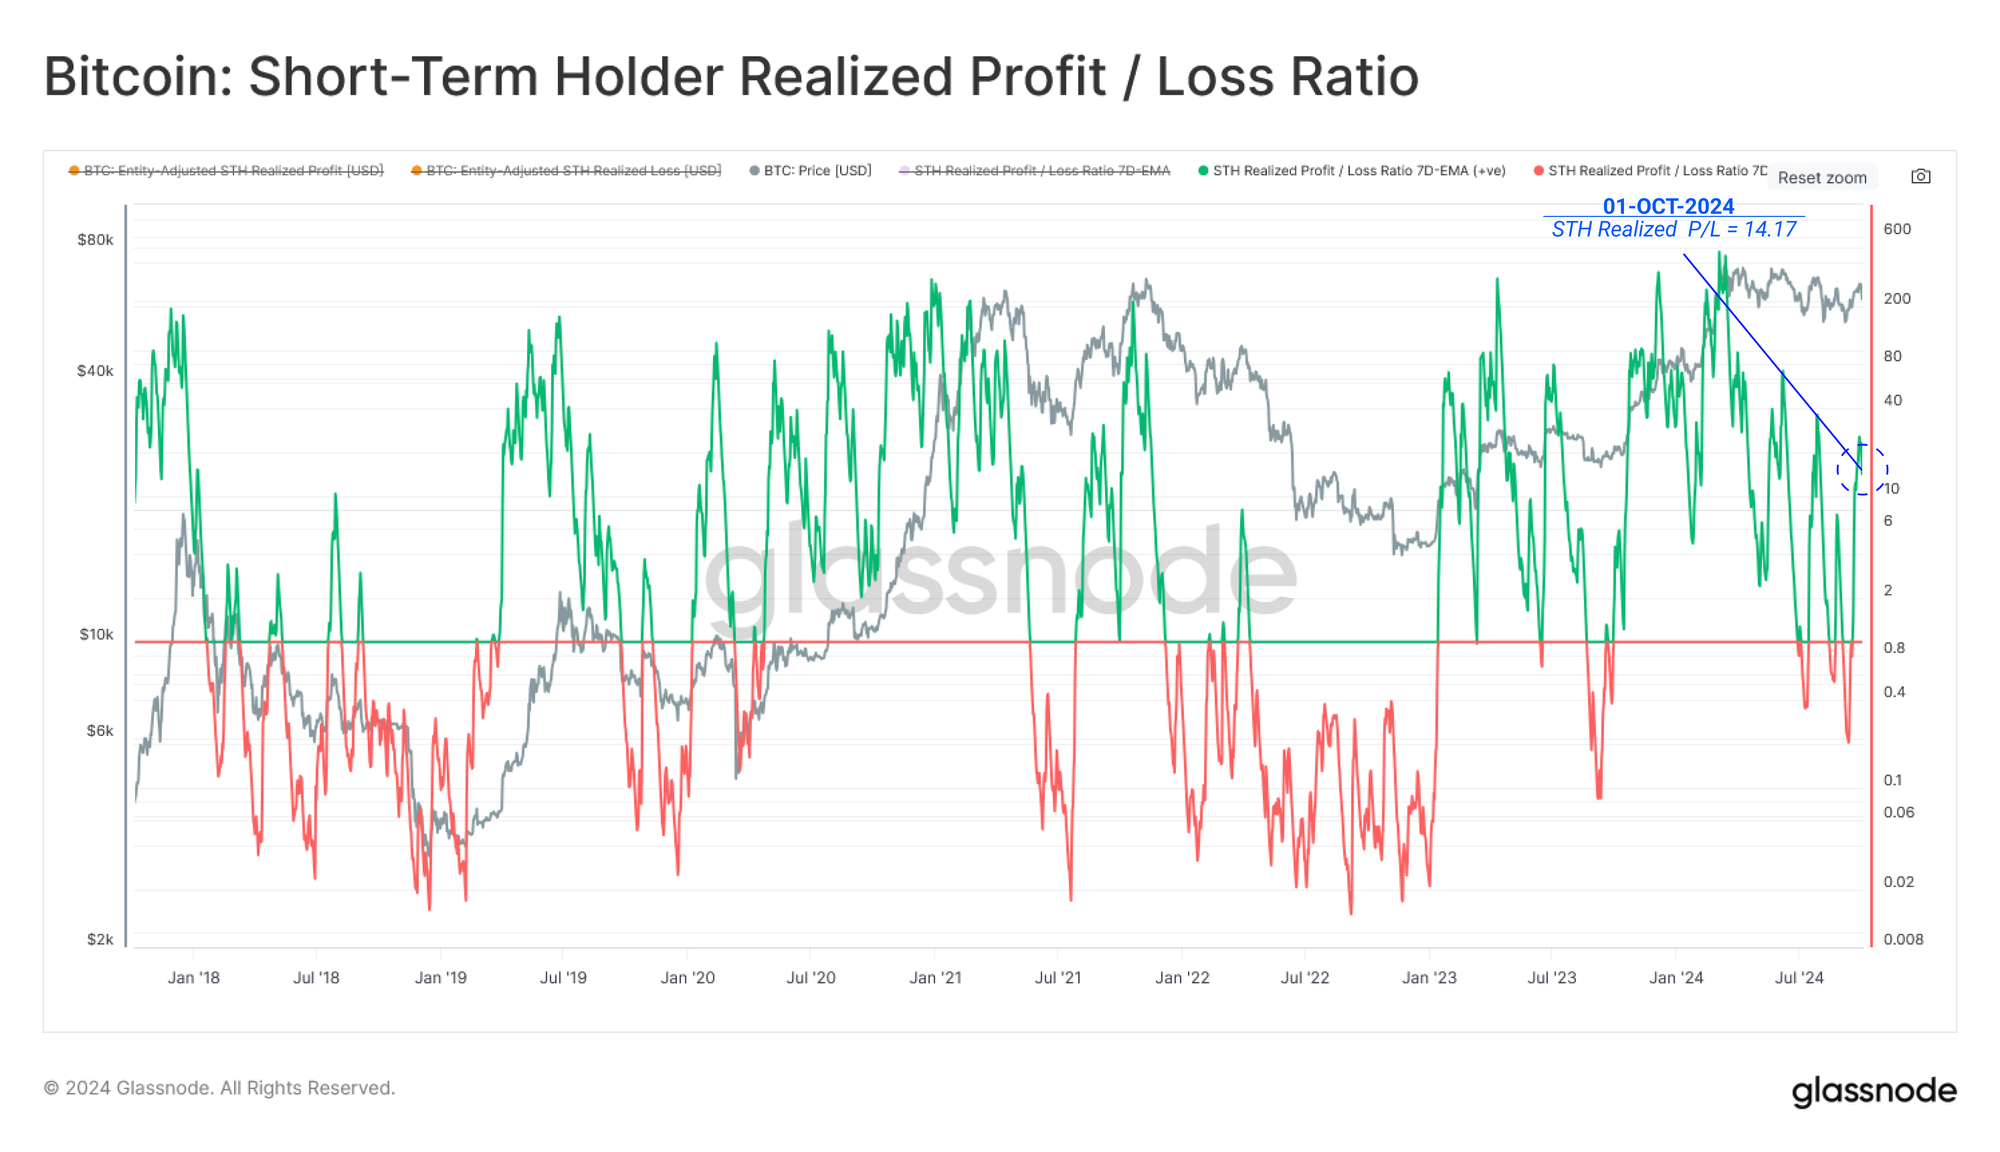
The STH Realized Profit / Loss Ratio has also rebounded strongly, returning into positive territory and seeing profit-taking volumes 14.17 times larger than for loss-taking. From a structural perspective, this provides an extra layer of confluence that the market is in a superior position relative to just a few weeks ago.
Institutional Demand
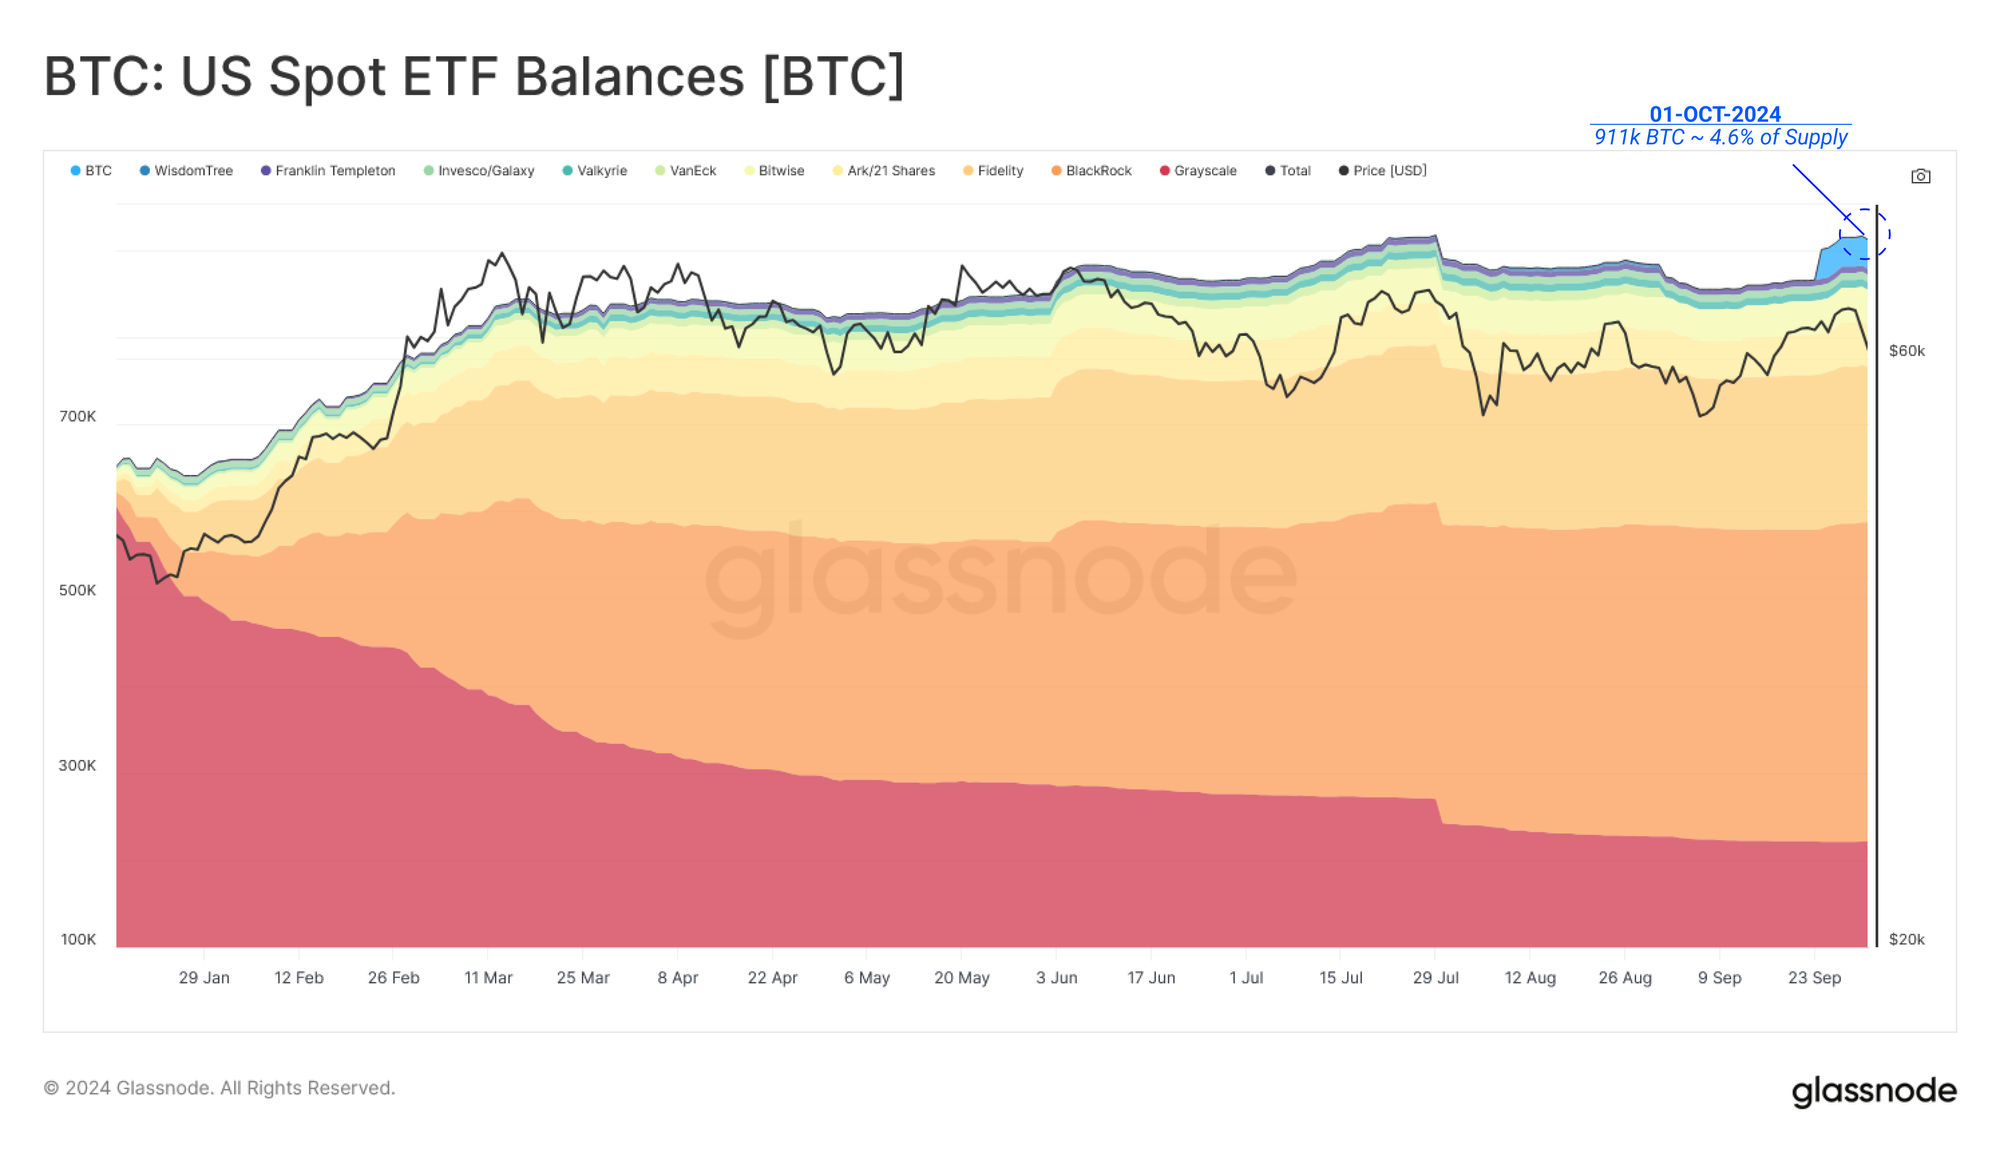
The institutional appetite for regulated Bitcoin exposure has been nothing short of phenomenal. The total assets under management within the US Spot ETFs now have a market value of $58B and hold around 4.6% of the circulating Bitcoin supply.
We can also see a recent uplift in the ETF balances on Glassnode due to the inclusion of holdings within the ‘BTC’ instrument associated with the Grayscale Bitcoin Mini Trust.
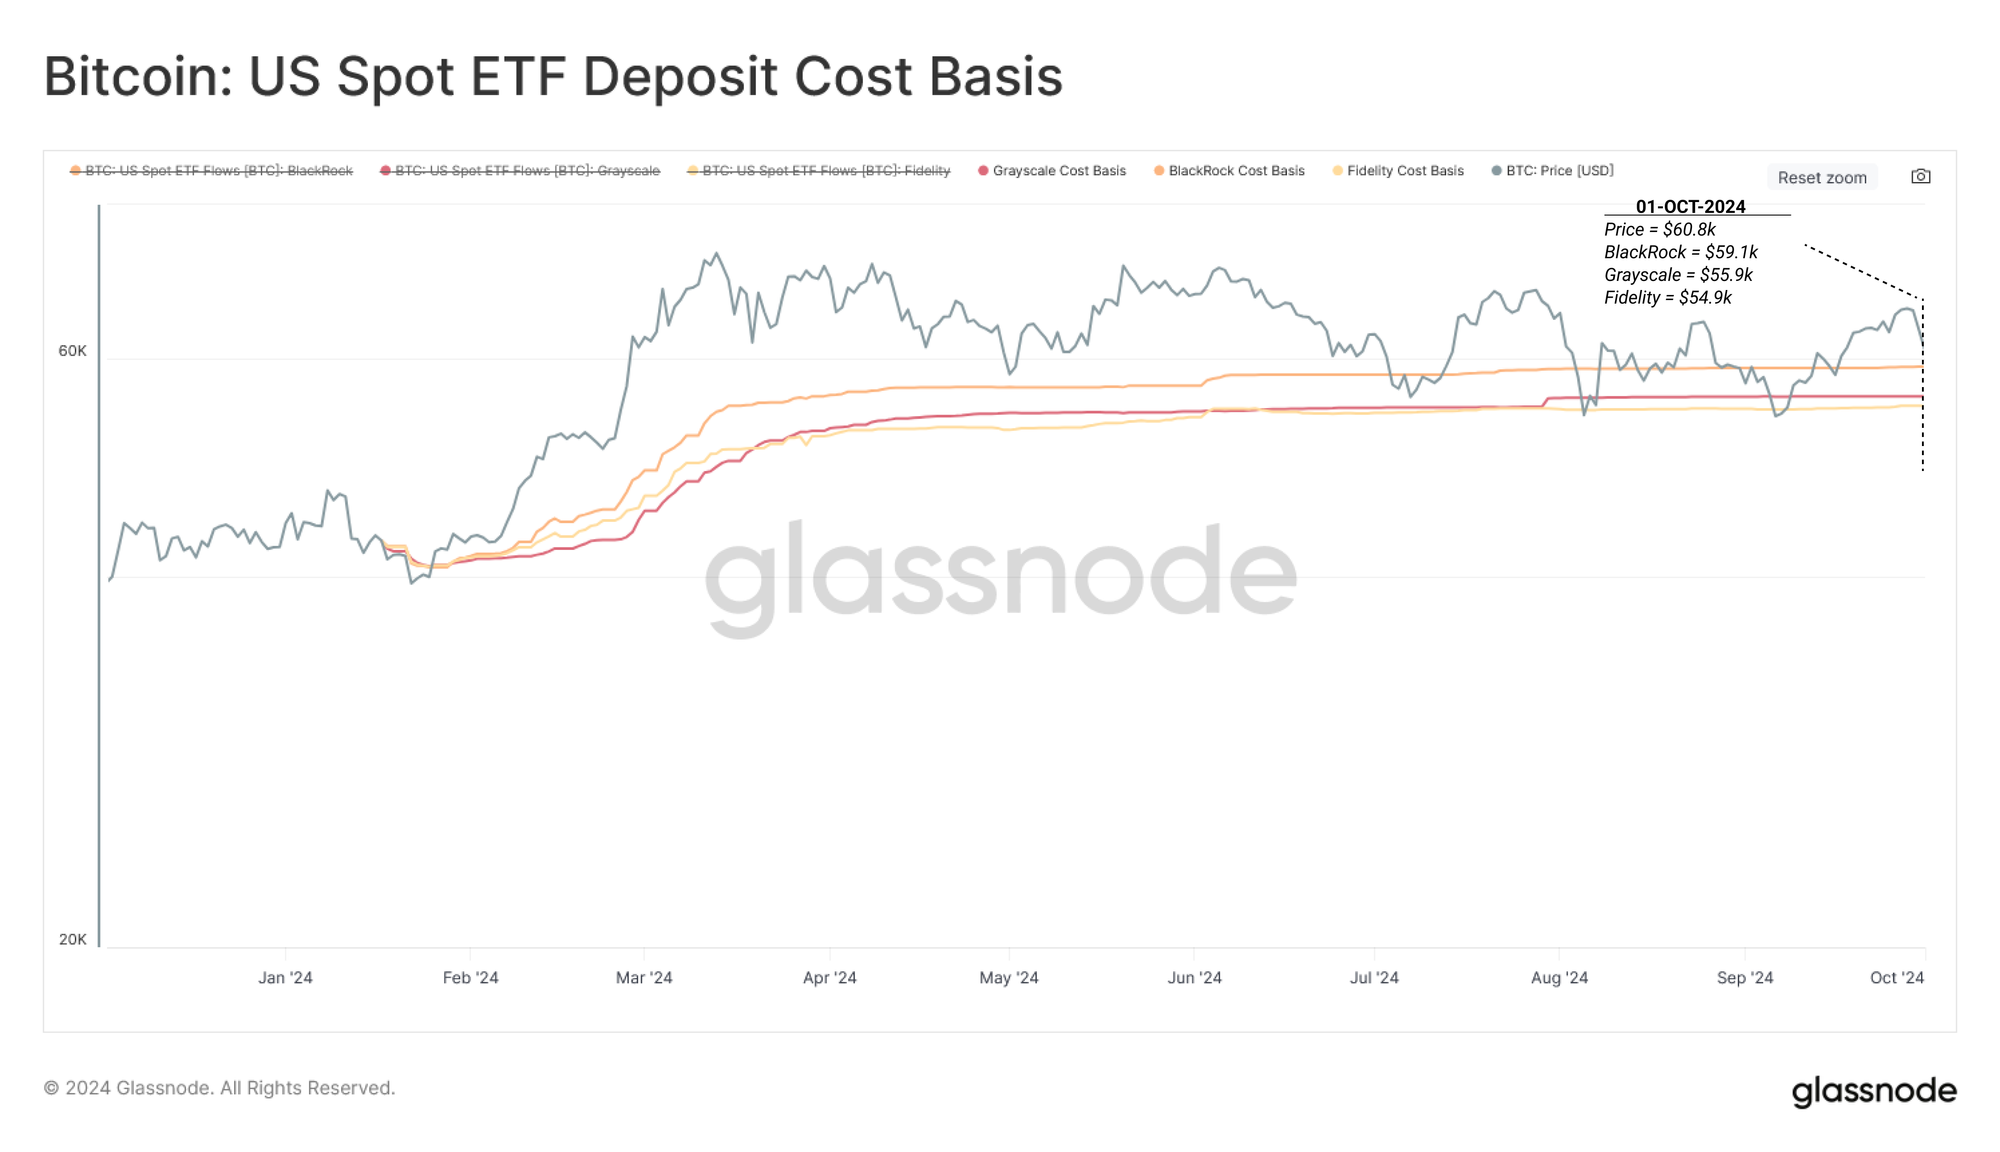
With BlackRock, Fidelity and Grayscale ranking as the largest US Spot ETFs, we can consider the price-stamping of Bitcoin deposits to their ETFs as a method to estimate the average acquisition cost basis. The cost basis of these instruments ranges from $54.9k to $59.1k.
This cost-basis model can then approximate a break-even point for ETF investors as a gauge for psychological stress points based on their unrealized profit/loss. As we can see, the price has tested these ETF break-even levels in three key instances since July.
With the ETFs being a relatively new piece of the Bitcoin market structure, it is helpful to put their influence on the market into perspective and size them up against the traditional spot markets.
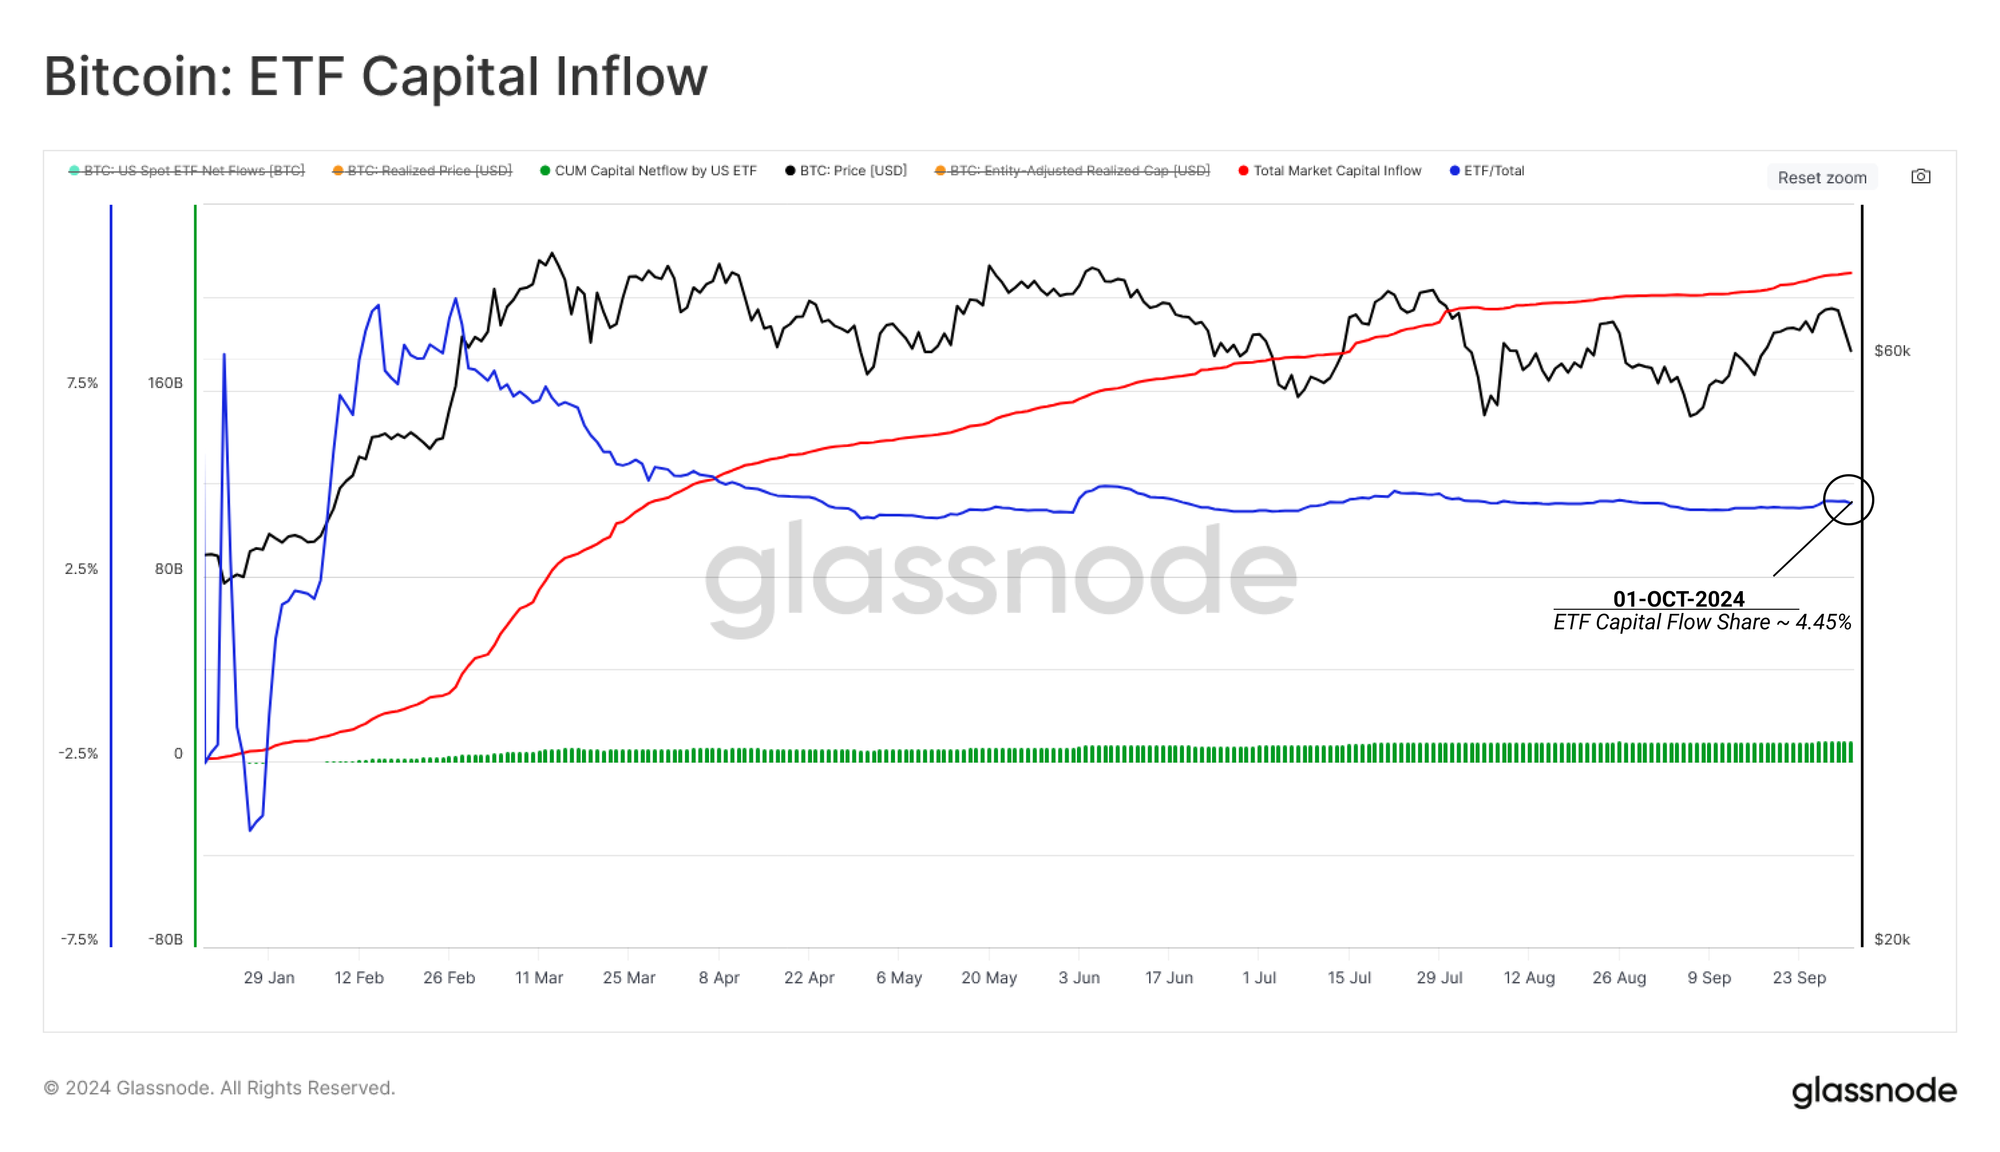
In this final chart, we evaluate the proportion of positive net capital flows associated with introducing ETF instruments.
Next, we compare the value invested into the ETFs 🟩 to the net capital inflow into the Bitcoin asset overall 🔴, measured as the change in the Realized Cap over the same period.
Since early January, the result shows that a non-trivial 4% to 5% of the overall net capital inflow to the Bitcoin market can be associated with coins flowing into US Spot ETFs. Given that this is aligned with their share of the total supply held, we have a reasonable baseline for evaluating their market influence.
Summary and Conclusions
The recent market rally has several initial signs that a change in market structure may be beginning to emerge, with Bitcoin printing its first technical higher high since the $73k top.
The Long-Term Holder cohort is largely in a regime of dominant HODLing and accumulation, while Short-Term Holders have seen a notable resurgence in their profitability. Across several measures, the average Bitcoin investor is in a better and more profitable position compared to just a few weeks ago and is experiencing less financial stress across the board.
Disclaimer: This report does not provide any investment advice. All data is provided for information and educational purposes only. No investment decision shall be based on the information provided here and you are solely responsible for your own investment decisions.
Exchange balances presented are derived from Glassnode’s comprehensive database of address labels, which are amassed through both officially published exchange information and proprietary clustering algorithms. While we strive to ensure the utmost accuracy in representing exchange balances, it is important to note that these figures might not always encapsulate the entirety of an exchange’s reserves, particularly when exchanges refrain from disclosing their official addresses. We urge users to exercise caution and discretion when utilizing these metrics. Glassnode shall not be held responsible for any discrepancies or potential inaccuracies. Please read our Transparency Notice when using exchange data.
- Join our Telegram channel
- For on-chain metrics, dashboards, and alerts, visit Glassnode Studio
- For automated alerts on core on-chain metrics and activity on exchanges, visit our Glassnode Alerts Twitter