Executive Summary
- Net capital flows into the Bitcoin assets have markedly cooled, with only marginal profit and loss-taking events by investors.
- Loss-taking events are almost exclusively associated with the Short-Term Holder cohort.
- However, a significant proportion of supply held by this cohort is transitioning into Long-Term Holder status, having been held for at least 155 days.
- Speculation in the perpetual swap market has experienced a full reset, suggesting a cooling off of speculative interest and long-biased leverage.
Liquidity
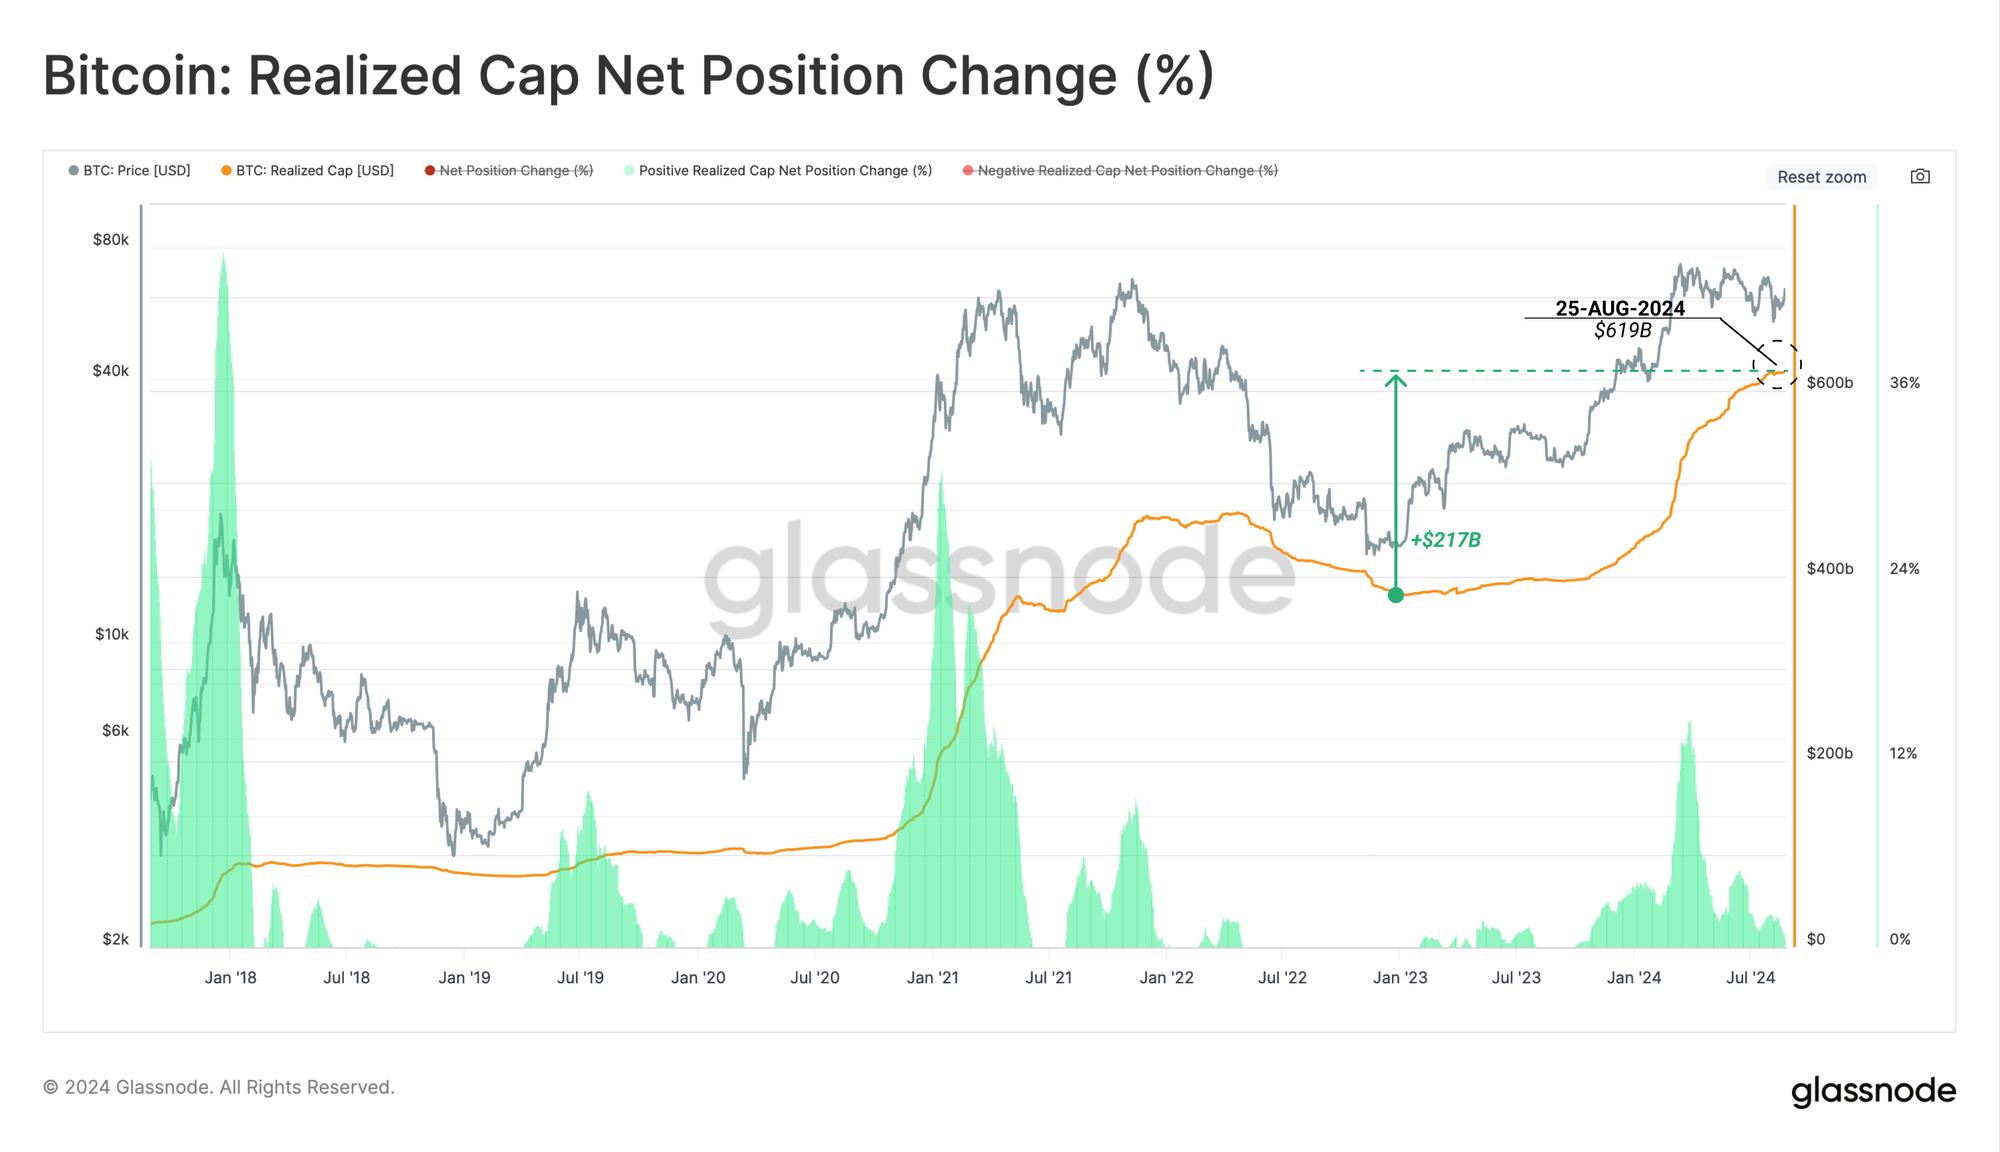
Over the last few months, net capital inflows into the Bitcoin asset have begun to slow down. This suggests a degree of equilibrium is reached between investors taking profit and loss.
Notably, capital inflows into the Bitcoin market are infrequently this quiet, with 89% of days experiencing a capital inflow larger than today (excluding during loss dominant bear markets). Also of note is that similar periods of inactivity tend to precede a significant uptick in volatility on the road ahead.
The Realized Cap remains at an ATH value of $619B, supported by a remarkable net inflow of $217B since the $15k low established in Dec 2022.
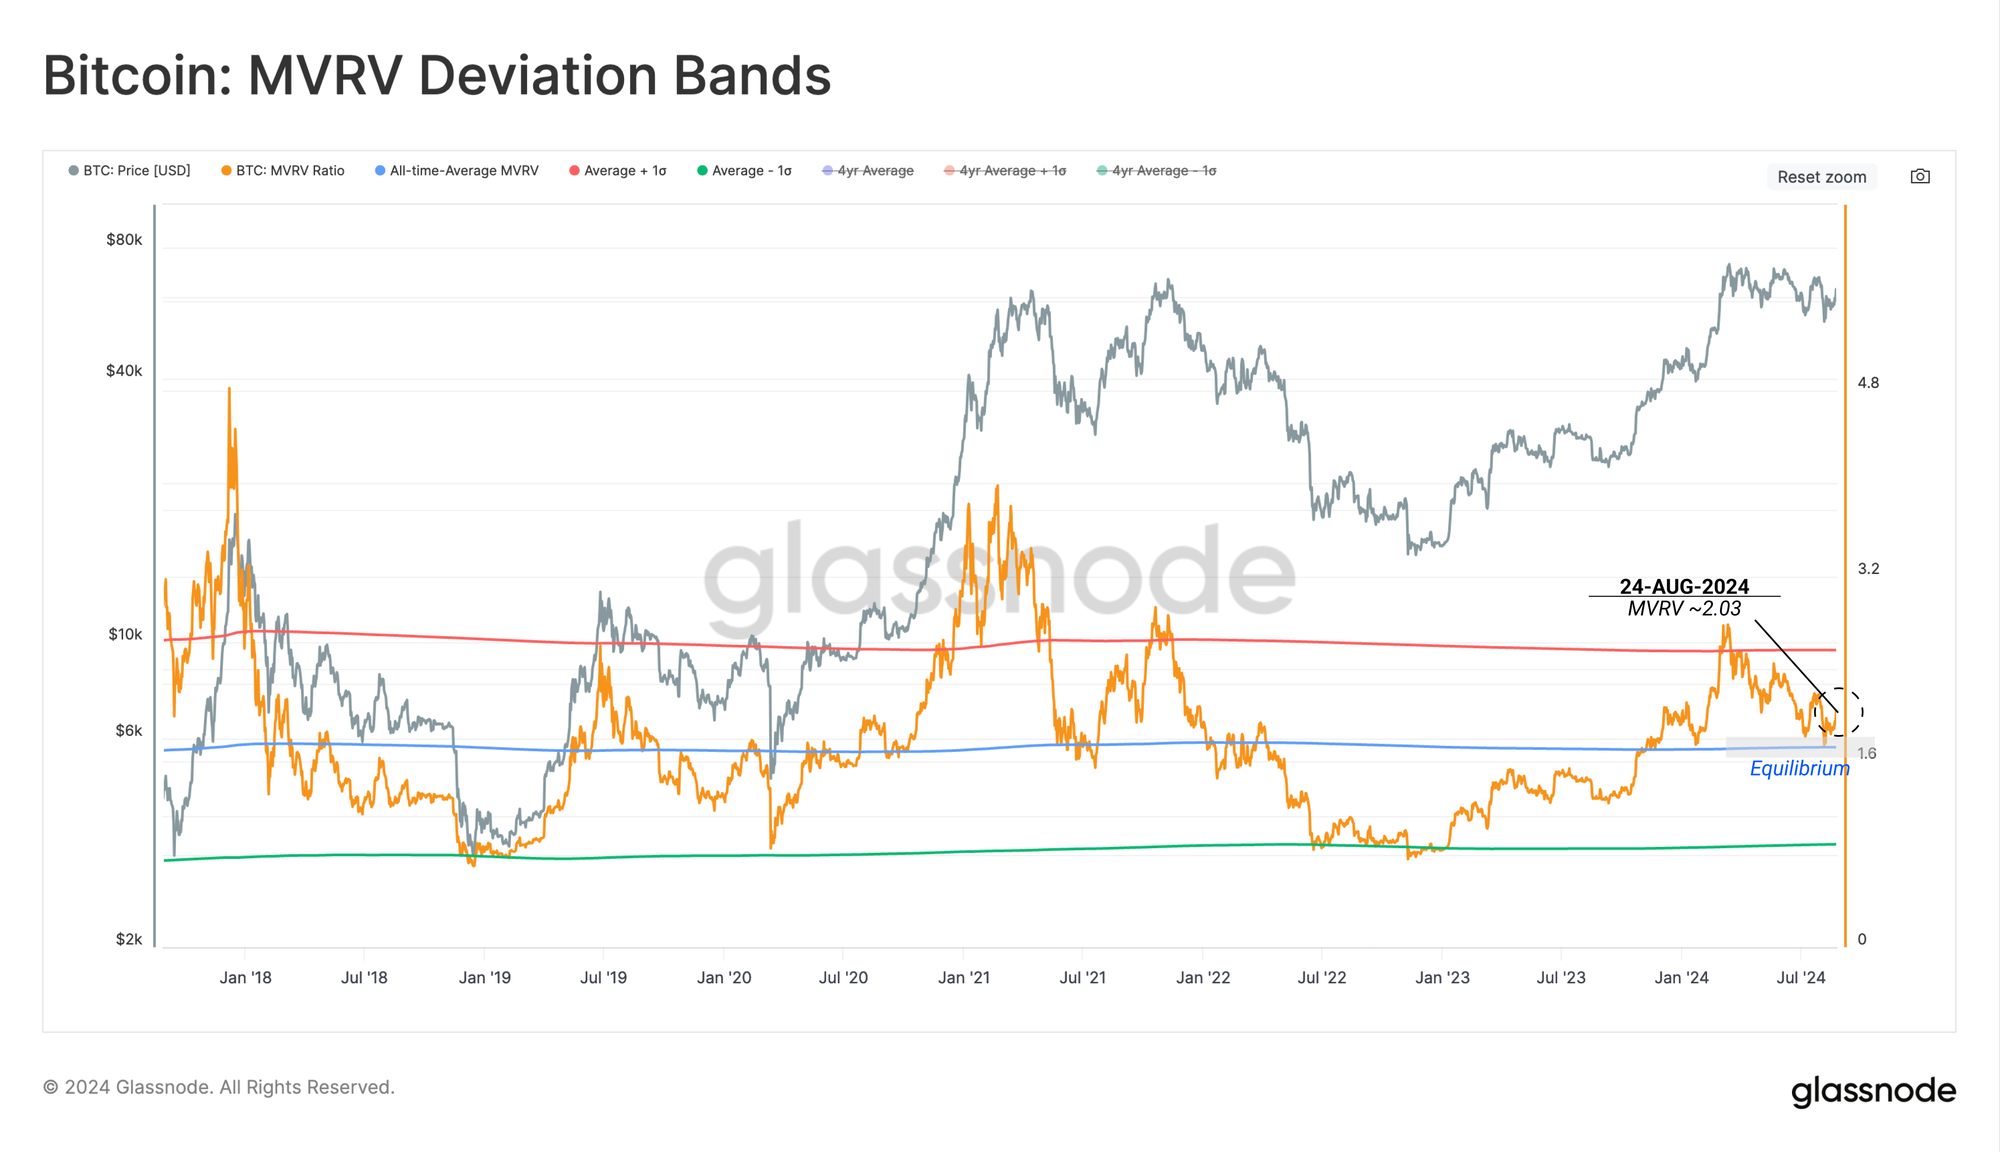
The MVRV Ratio is a powerful tool that enables us to gauge investors' average unrealized profit.
Over the last two weeks, the MVRV Ratio has tested its all-time average value of 1.72. This critical level has historically marked a transition point between a macro bull vs bear market trend. Approximately 51% of trading days have a MVRV value closing above the mean value.
This suggests that investor profitability has essentially reset to an equilibrium position and that the excitement and exuberance after the ETF launch have cooled off completely.
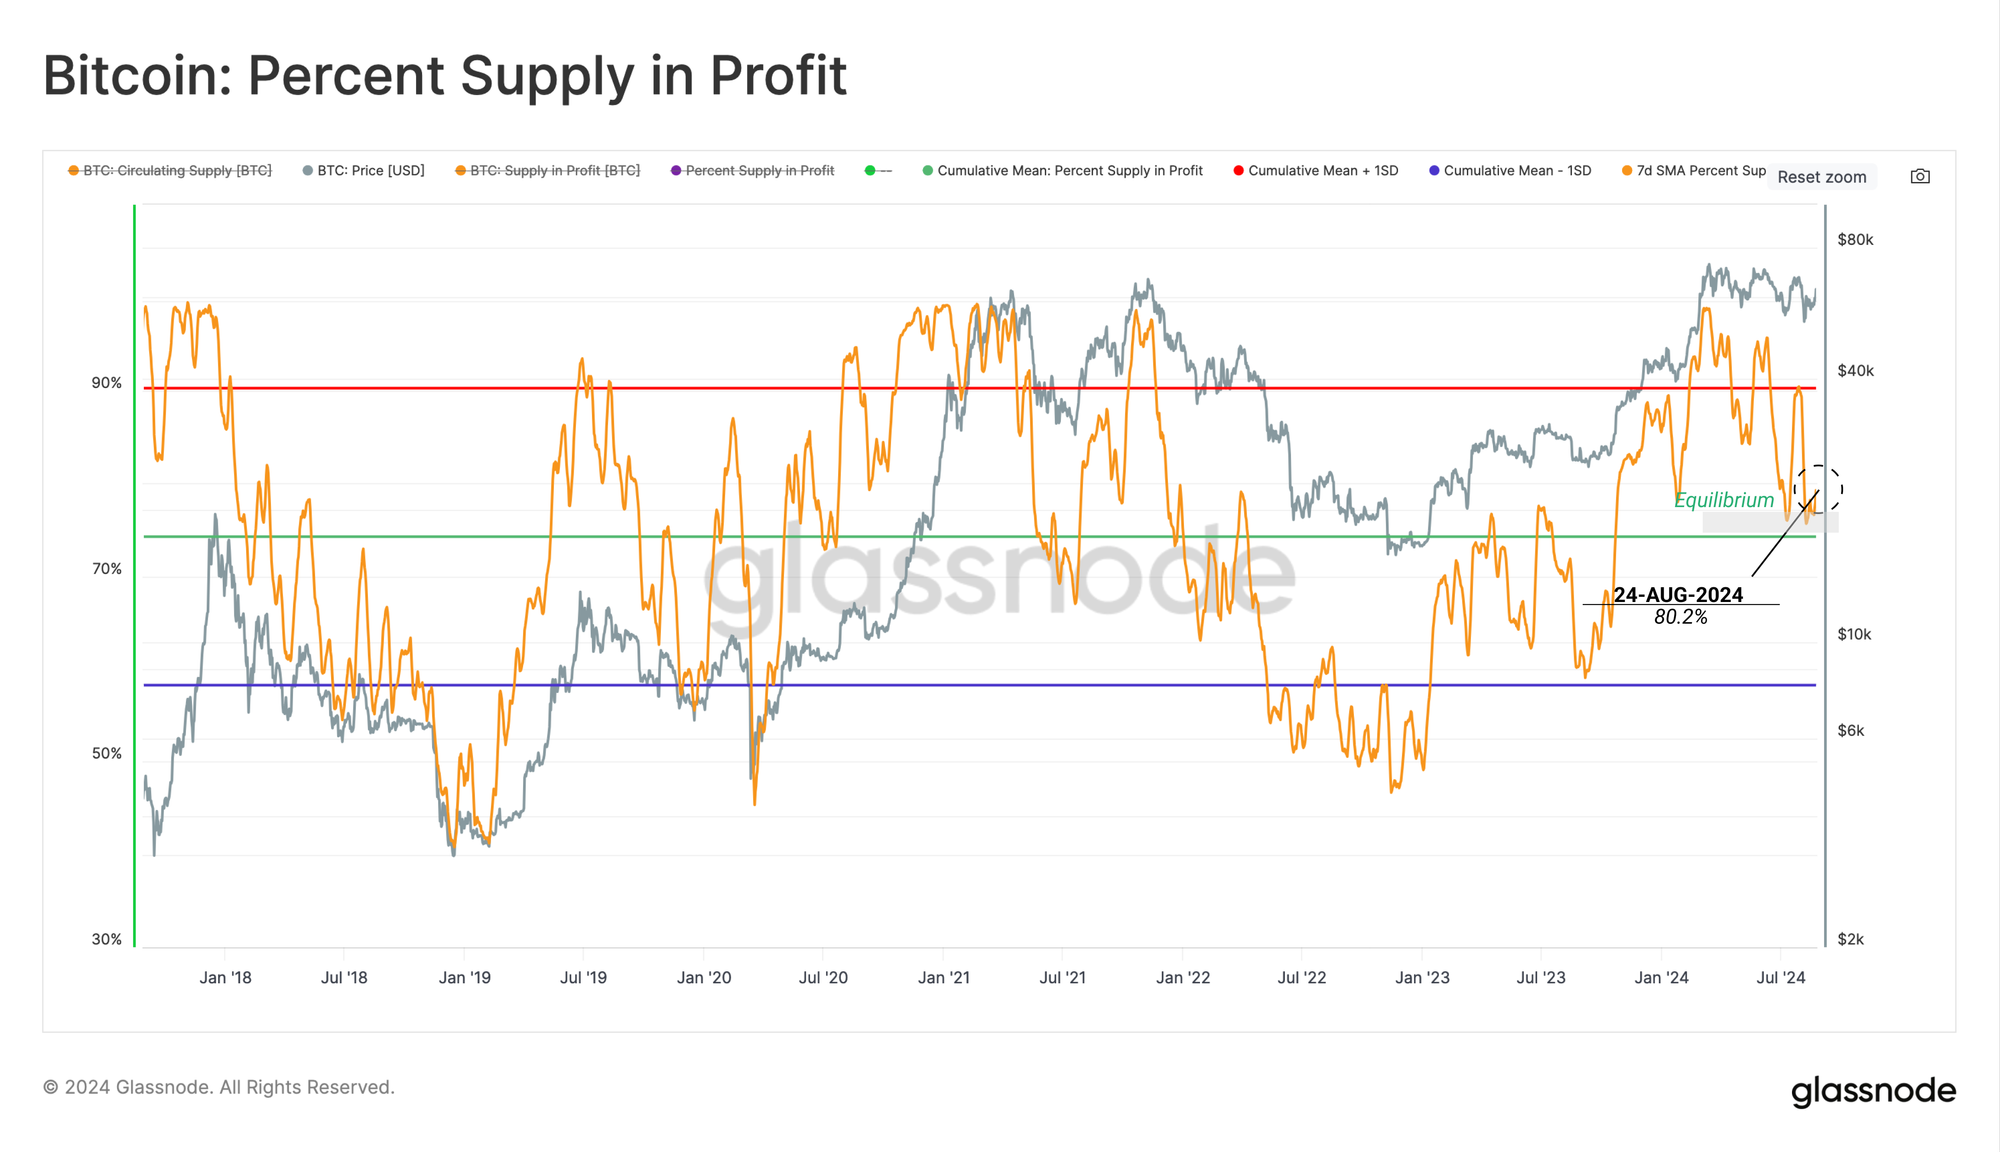
A similar story is echoed in the percentage of supply in profit metric, which provides a read on the global profitability of the supply.
Like the MVRV Ratio, this oscillator has returned to its long-standing mean value. Previous instances where a similar retest of this level occurred are visible in late 2016, throughout the choppy 2019 period and during the mid-2021 sell-off.
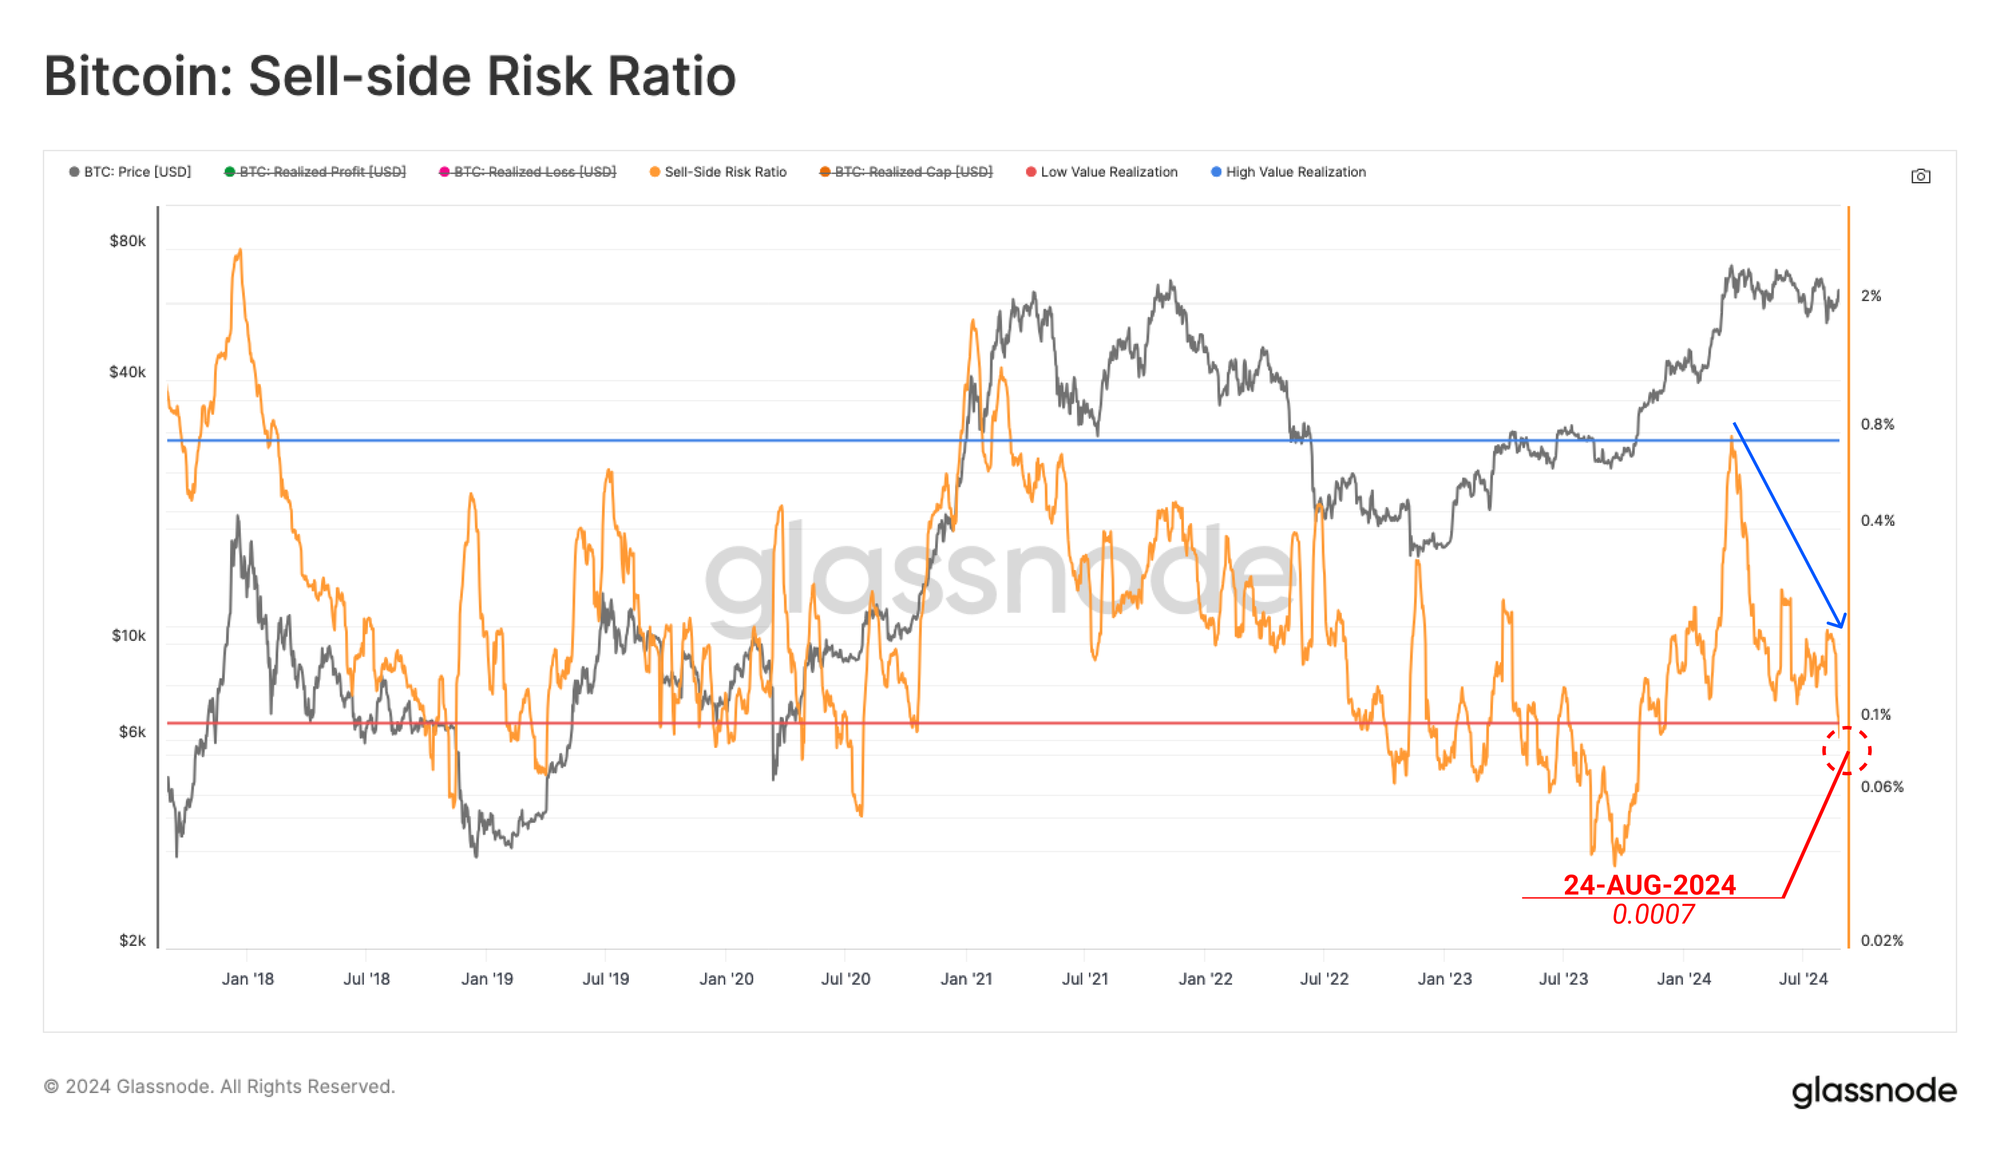
The Sell-Side Risk Ratio is another powerful tool which can assess the degree of equilibrium the market has reached. We can consider this metric under the following framework:
- High values indicate that investors spend coins at a large profit or loss relative to their cost basis. This condition indicates that the market likely needs to re-find equilibrium and usually follows a high volatility price move.
- Low values indicate that most coins are being spent relatively close to their break-even cost basis, suggesting a degree of equilibrium has been reached. This condition often signifies an exhaustion of ‘profit and loss’ within the current price range and usually describes a low volatility environment.
Presently, the Sell-Side Risk Ratio has fallen into the lower band, suggesting that most coins moved on-chain are transacting near their original acquisition price. Similar to the metrics covered earlier, this precedes a new regime of heightened volatility.
Short-Term Stress
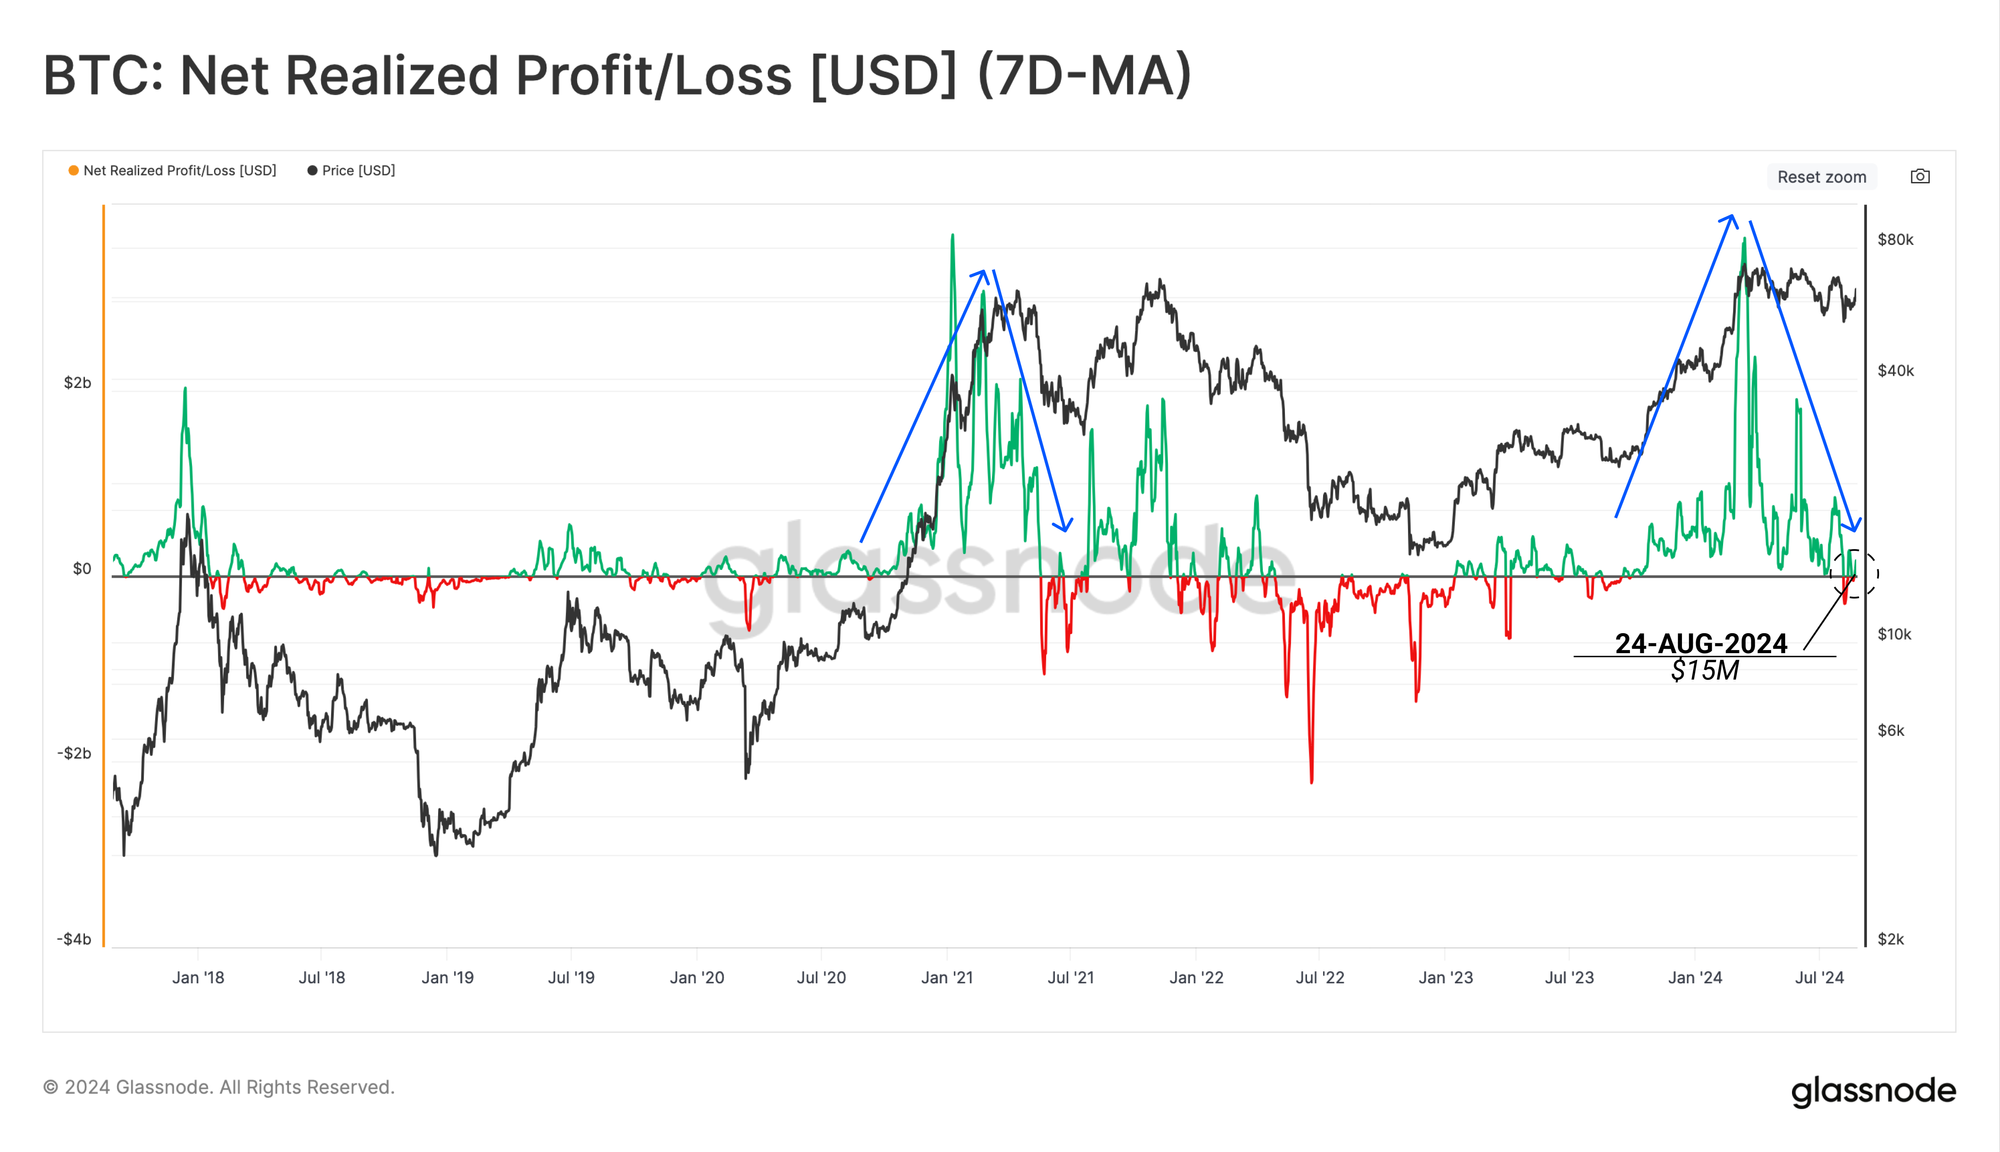
Diving deeper into these profit and loss-taking activities, we can see that the magnitude of net realized profit/loss is declining.
Net realized profit/loss is currently at a value of +$15M/day, a far cry from the $3.6B/day of capital inflow experienced as the market set the $73k ATH in March. Typically, this metric returns to a neutral level near inflection points such as a continuation of the trend or a reversal back into a macro scale bearish trend.
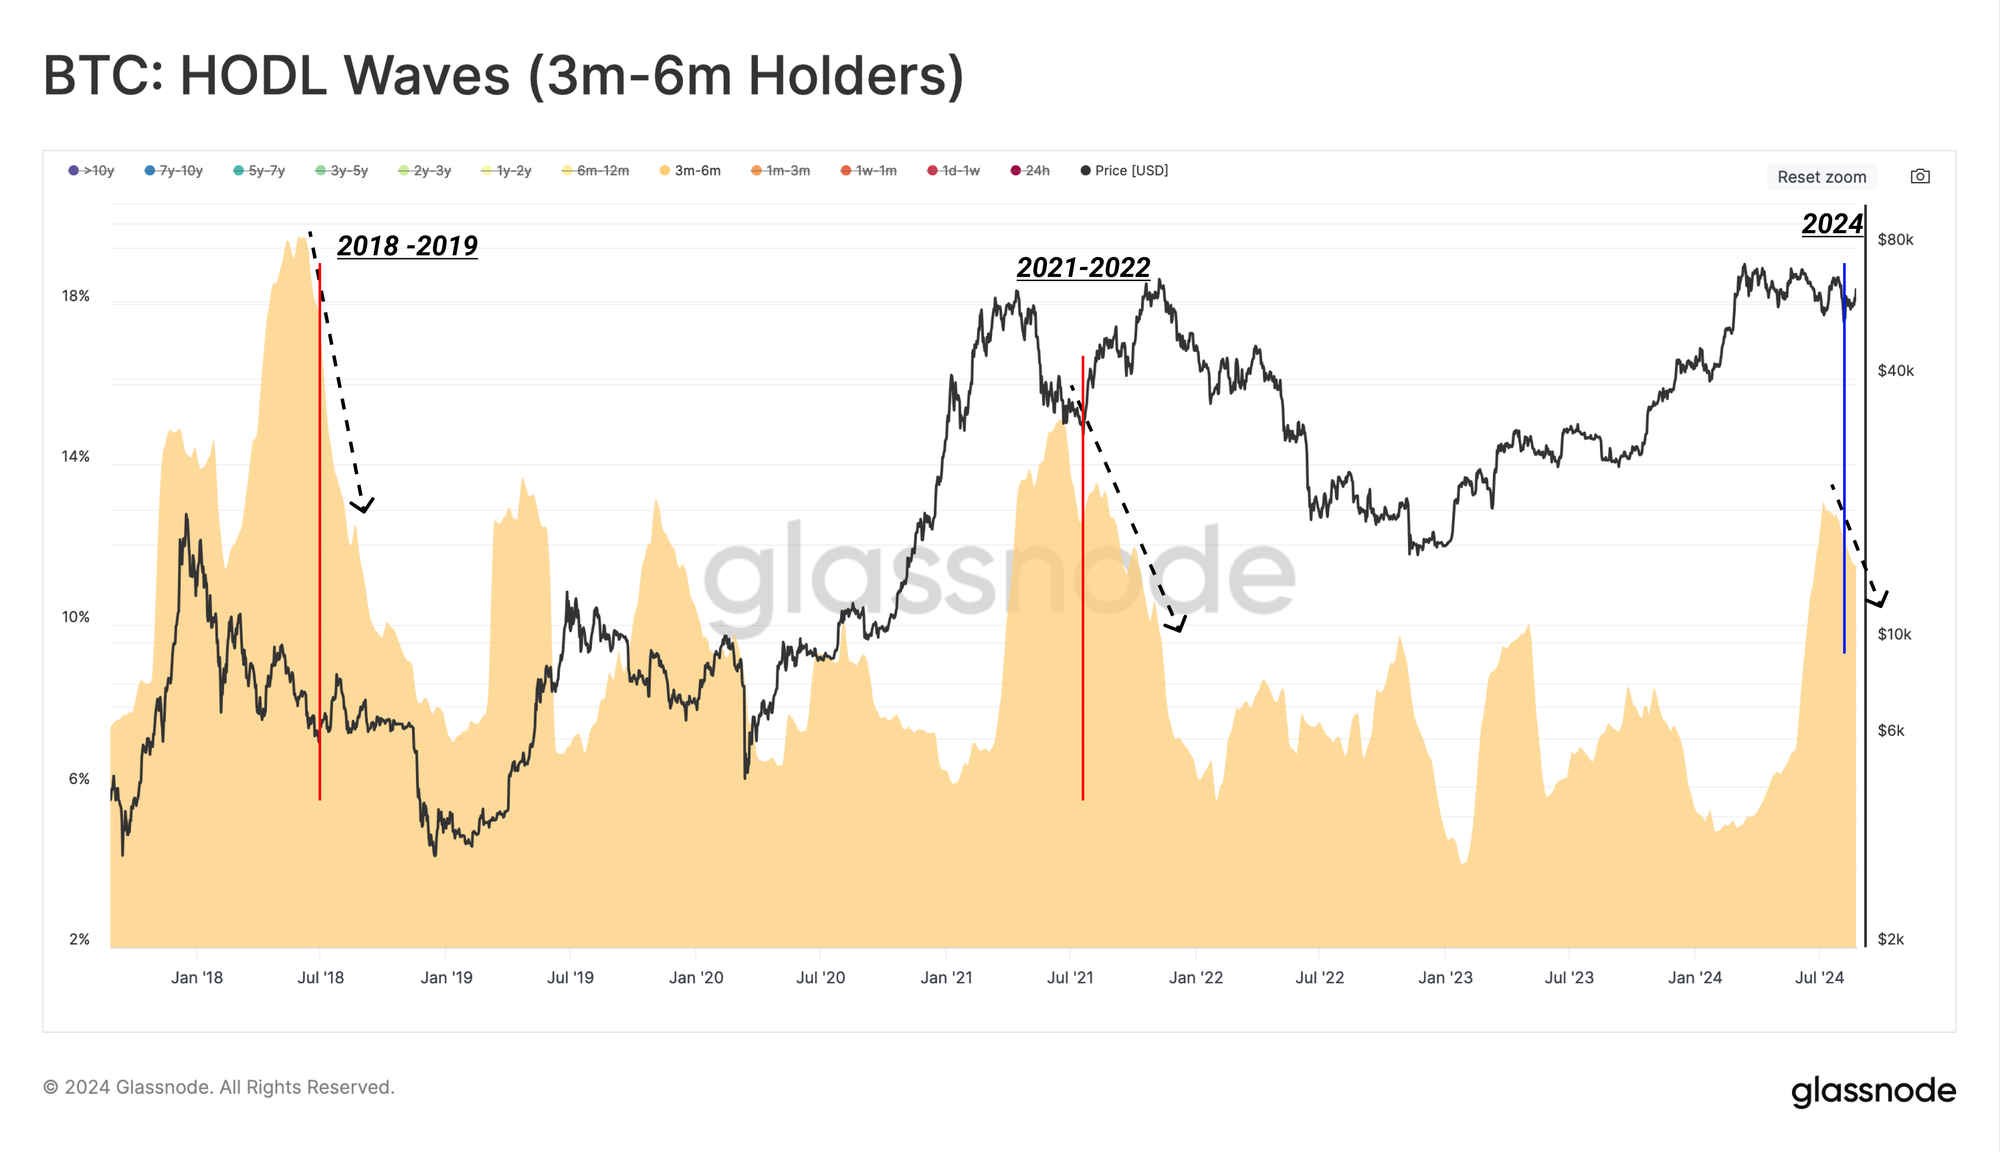
After setting the ATH in March, the confidence of new investors was tested by choppy sideways price action for several months. During this process, a significant volume of the Bitcoin supply has remained tightly held and is within the 3-month to 6-month age band.
Historically, the supply held within this 3-6m age band tends to peak soon after a major market peak is established, often during the correction which follows. A portion of these new investors then decide to HODL through the choppy conditions, eventually becoming long-term investors. Many others exit their position and realize the loss.
Currently, coins aged 3m-6m account for over 12.5% of the circulating supply, with a structure similar to the mid-2021 sell-off, but also during the height of the 2018 bear market.
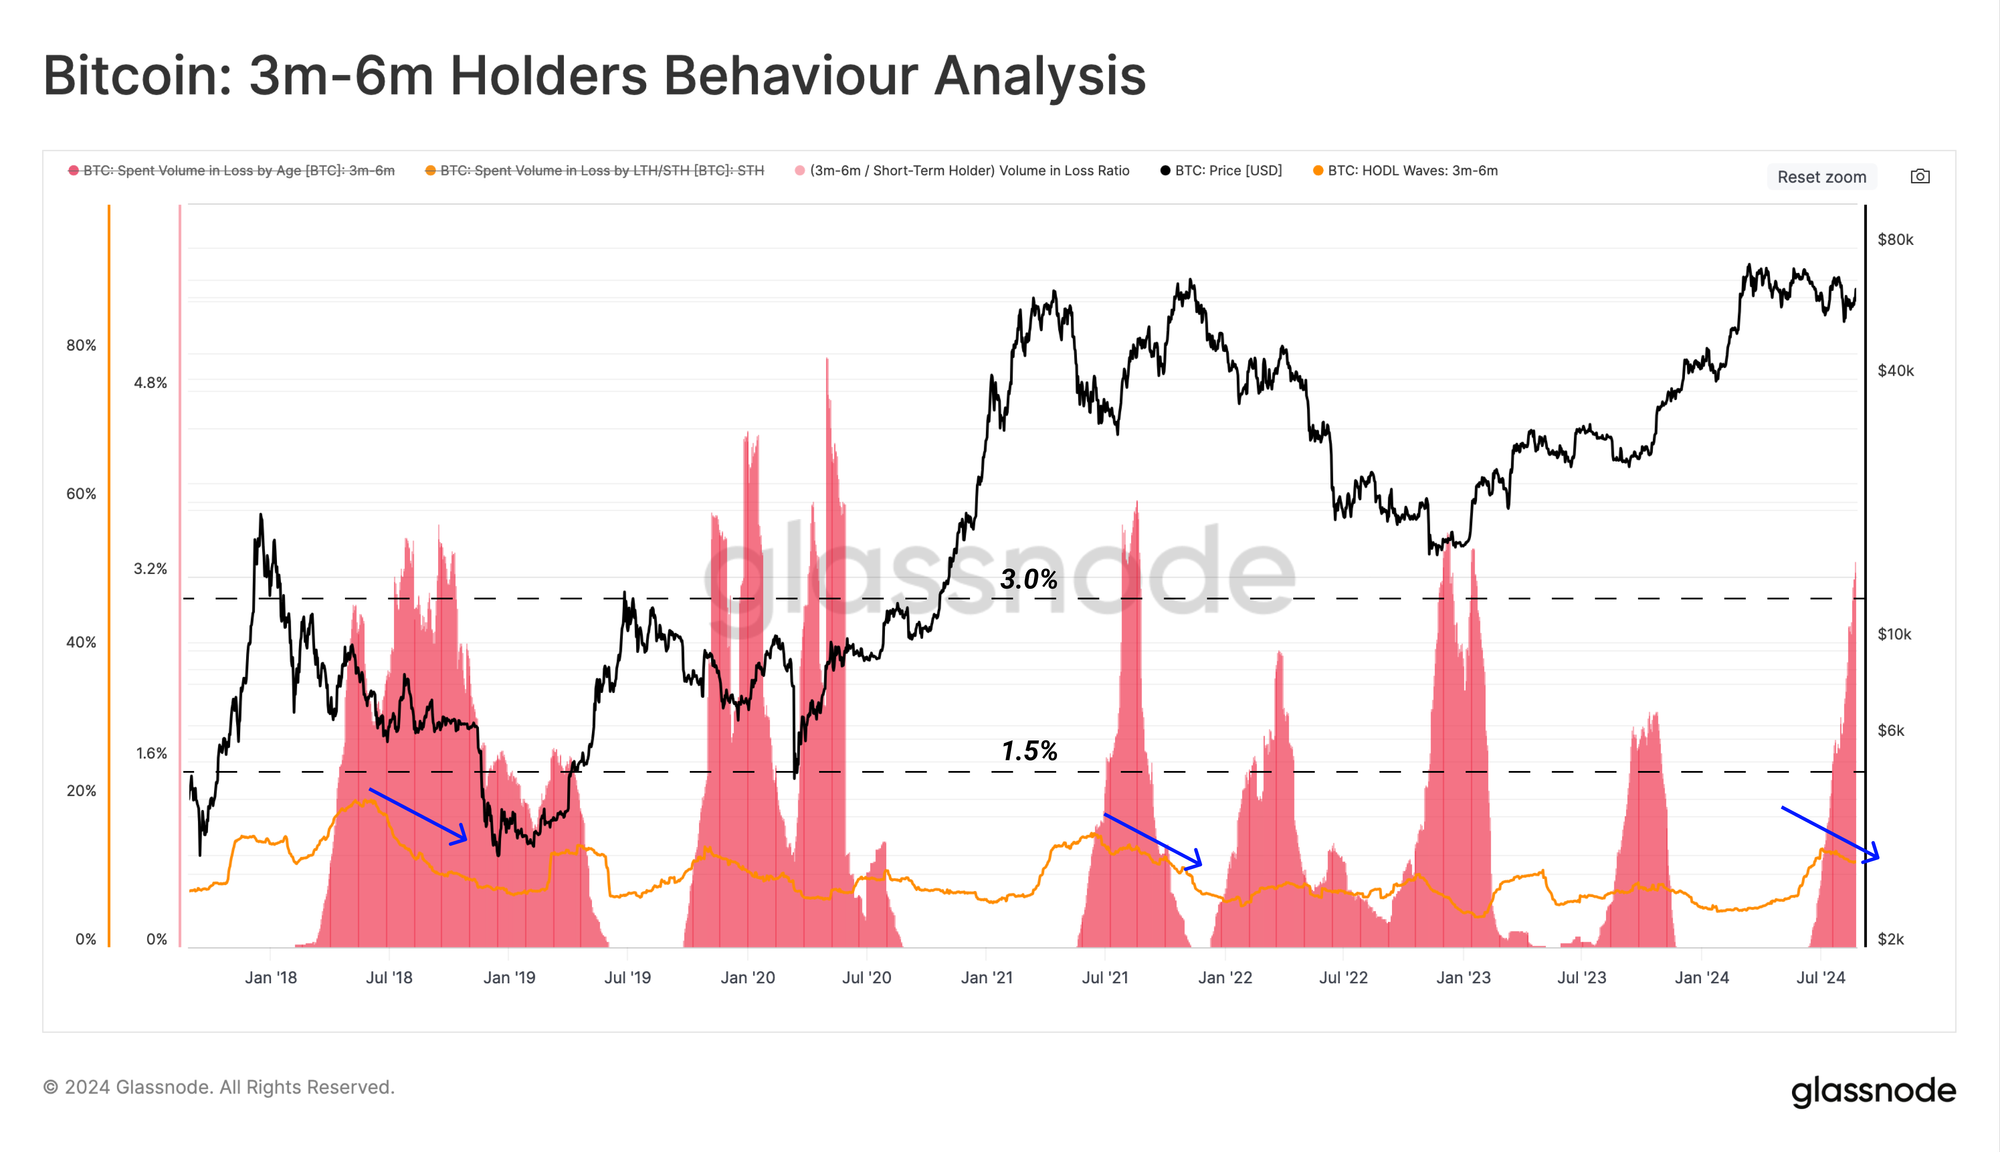
The chart below aims to break this cohort down further and compare the supply held within the 3-6m age band vs the supply which has capitulated out at a loss. We start with the held supply aged 3-6m shown in 🟠, then overlay the volume transferred in a loss by this cohort 🟥.
From this, we can observe a significant surge in loss-taking events since the start of July, whilst the aggregate supply held started to decline. In terms of magnitude, the capitulation was of a scale similar to major market inflection points in the past.
The supply which remains in this age band is increasingly close to migrating into Long-Term Holder status, representing coins that are statistically less likely to be spent on a given day.
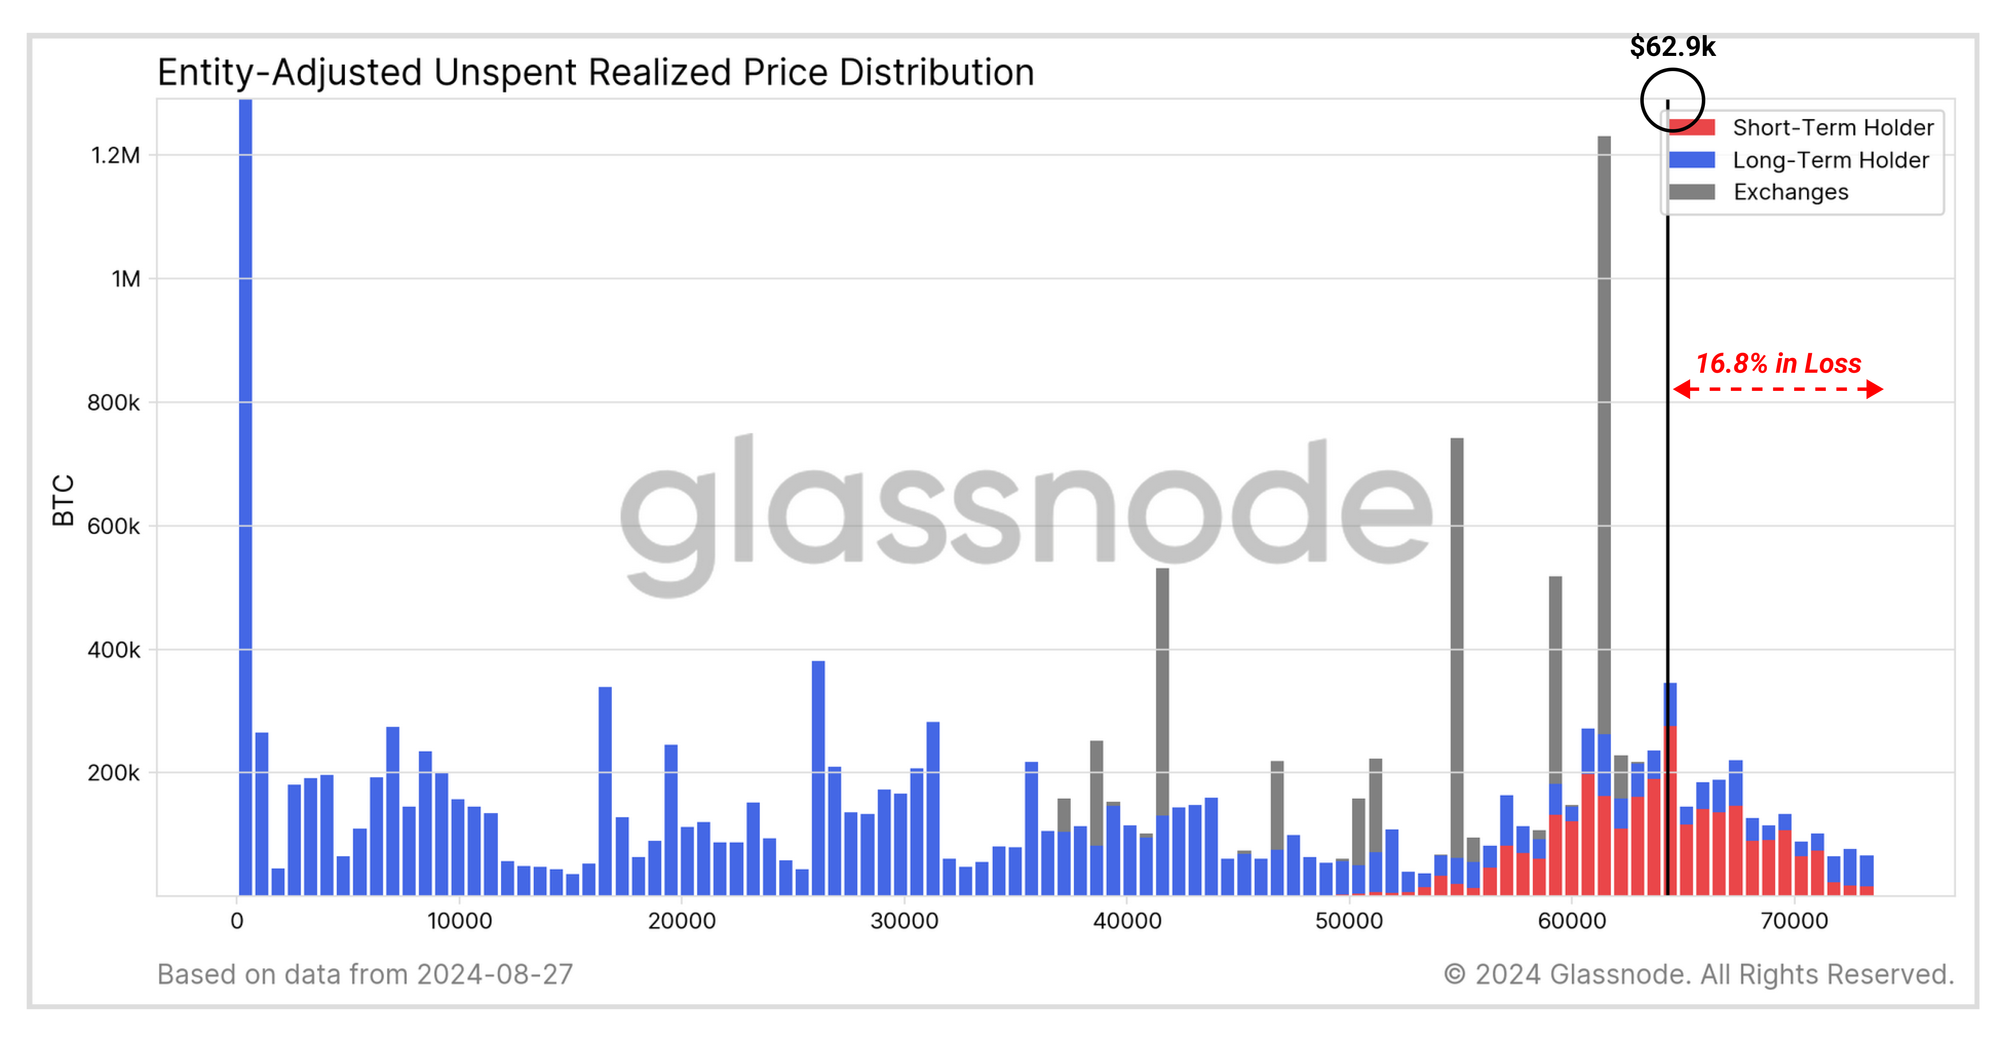
Another method for visualizing this migration of coins into LTH status is via the URPD metric, segregated for Long and Short-Term Holders. Here, we can see that over +480k BTC was acquired above the current spot price and is now classified as LTH supply 🟦.
This also means these LTH coins are now held at an unrealized loss.
Volatility
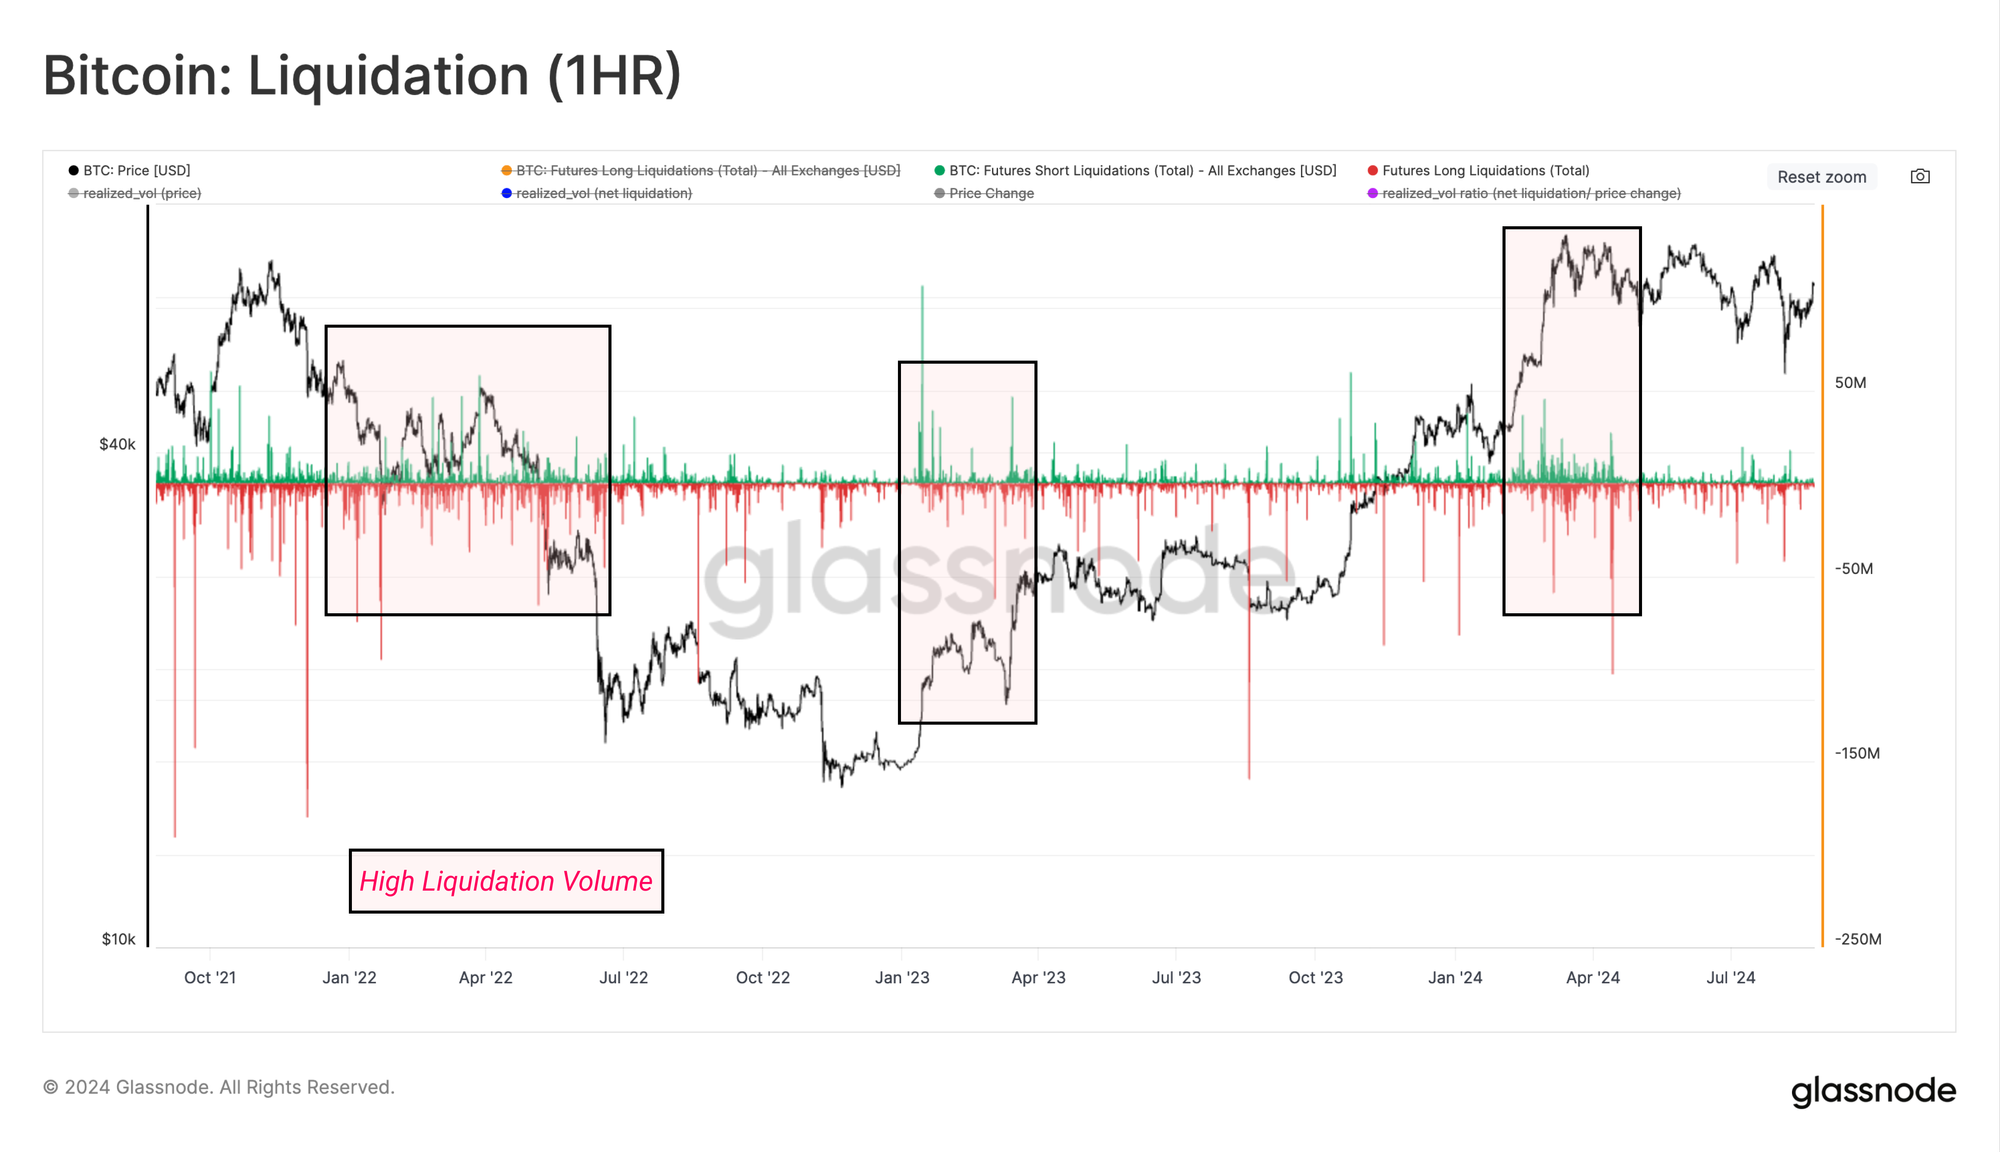
In this final section, we will add our analysis of perpetual swap markets, which provide a read on the appetite for speculation and leverage across Bitcoin markets.
In general, there has been a marked decline in liquidation volumes in recent months, especially relative to the excitement around the March ATH. This suggests that the appetite for speculation has declined and suggests a more spot-dominated market regime for the time being.
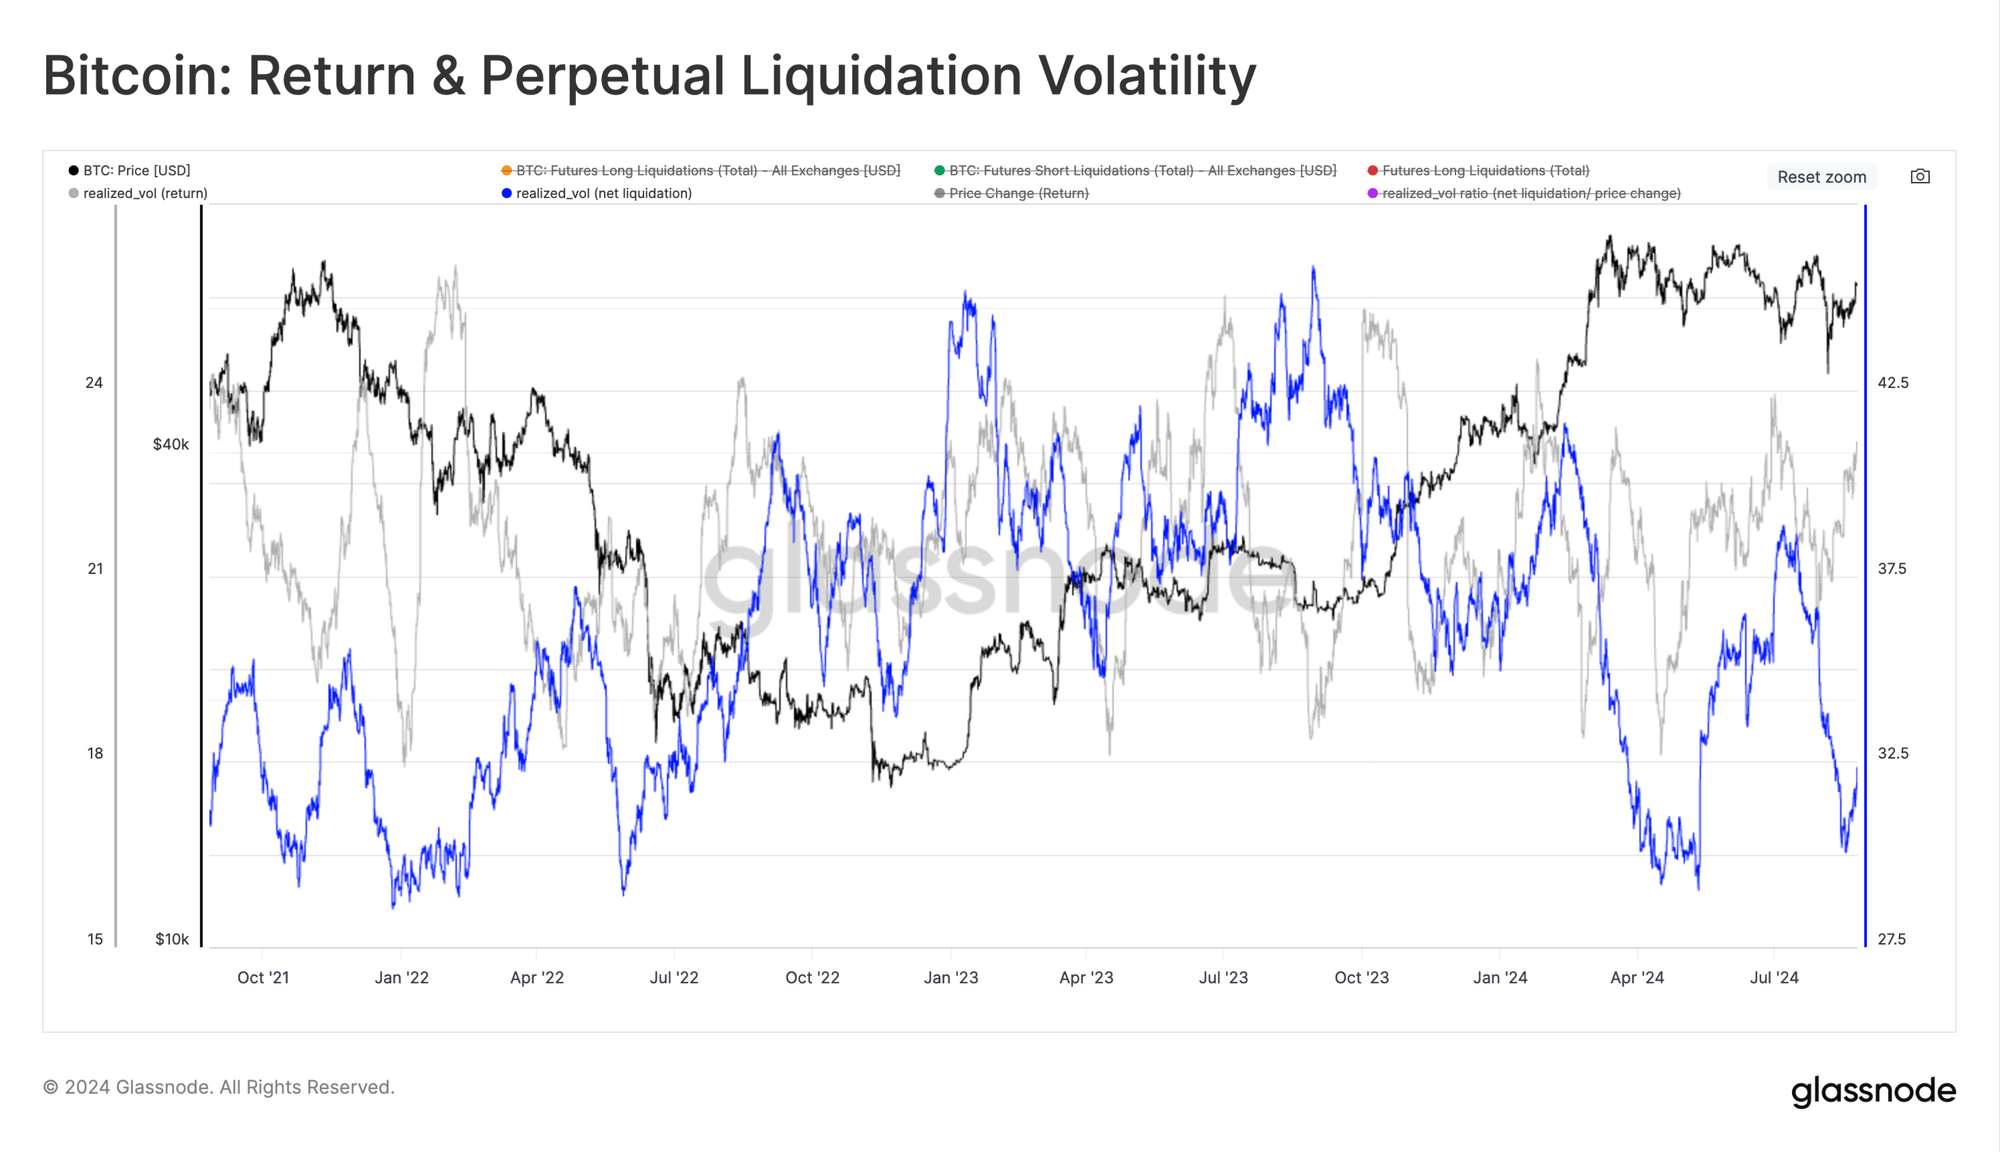
If we compare the monthly price volatility against the net liquidation volumes, we can see a strong correlation between the two factors. This underscores how market volatility is often amplified by a squeezing of leveraged positions, as traders find themselves offside when the market moves.
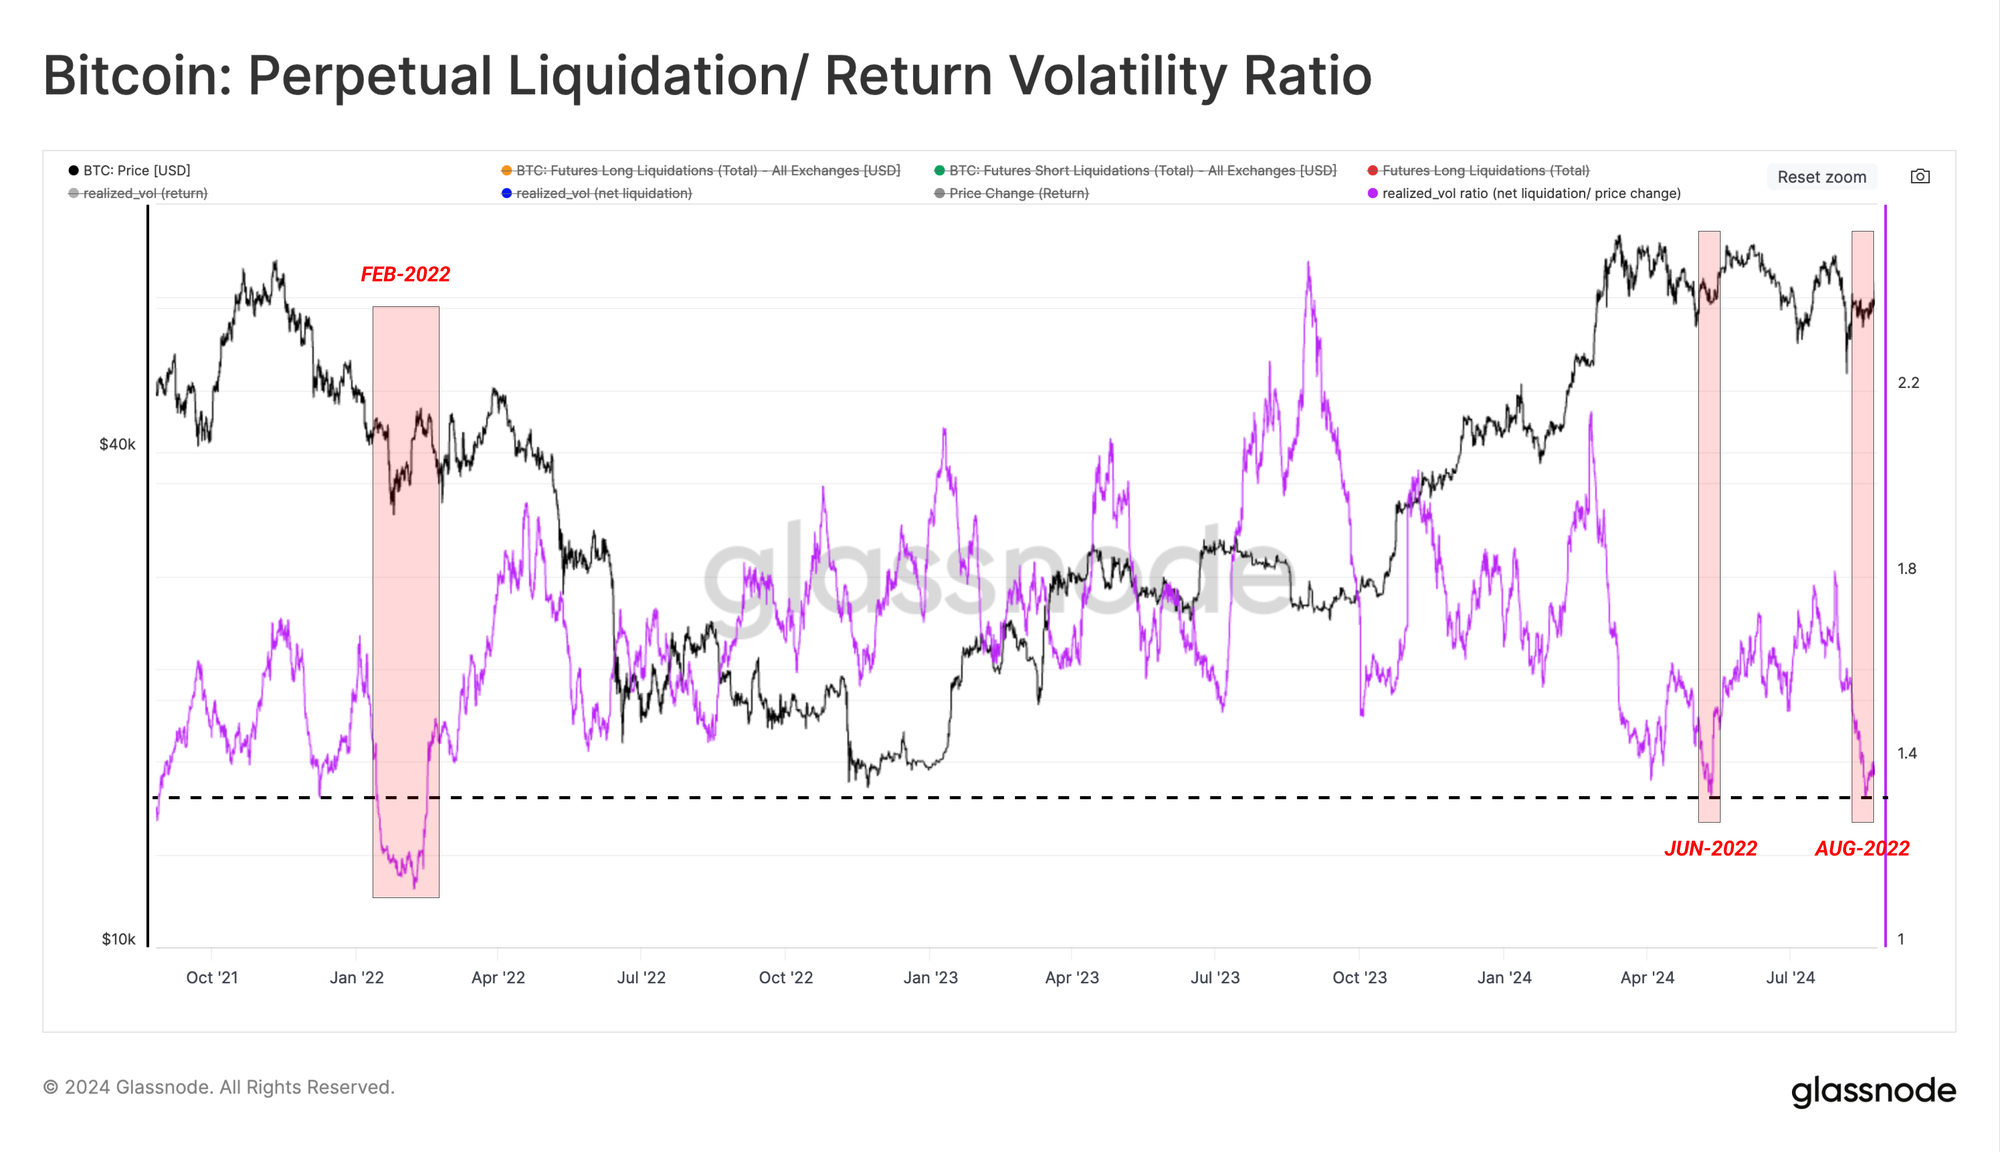
We can also look into the ratio between price and net liquidation volume volatility for another relative read on the market's appetite for leverage.
What we find is that this ratio is declining towards levels not seen since Feb 2022. This reinforces the notion that traders are less willing to take on higher-risk positions, suggesting there has been a significant reset in speculative interest.
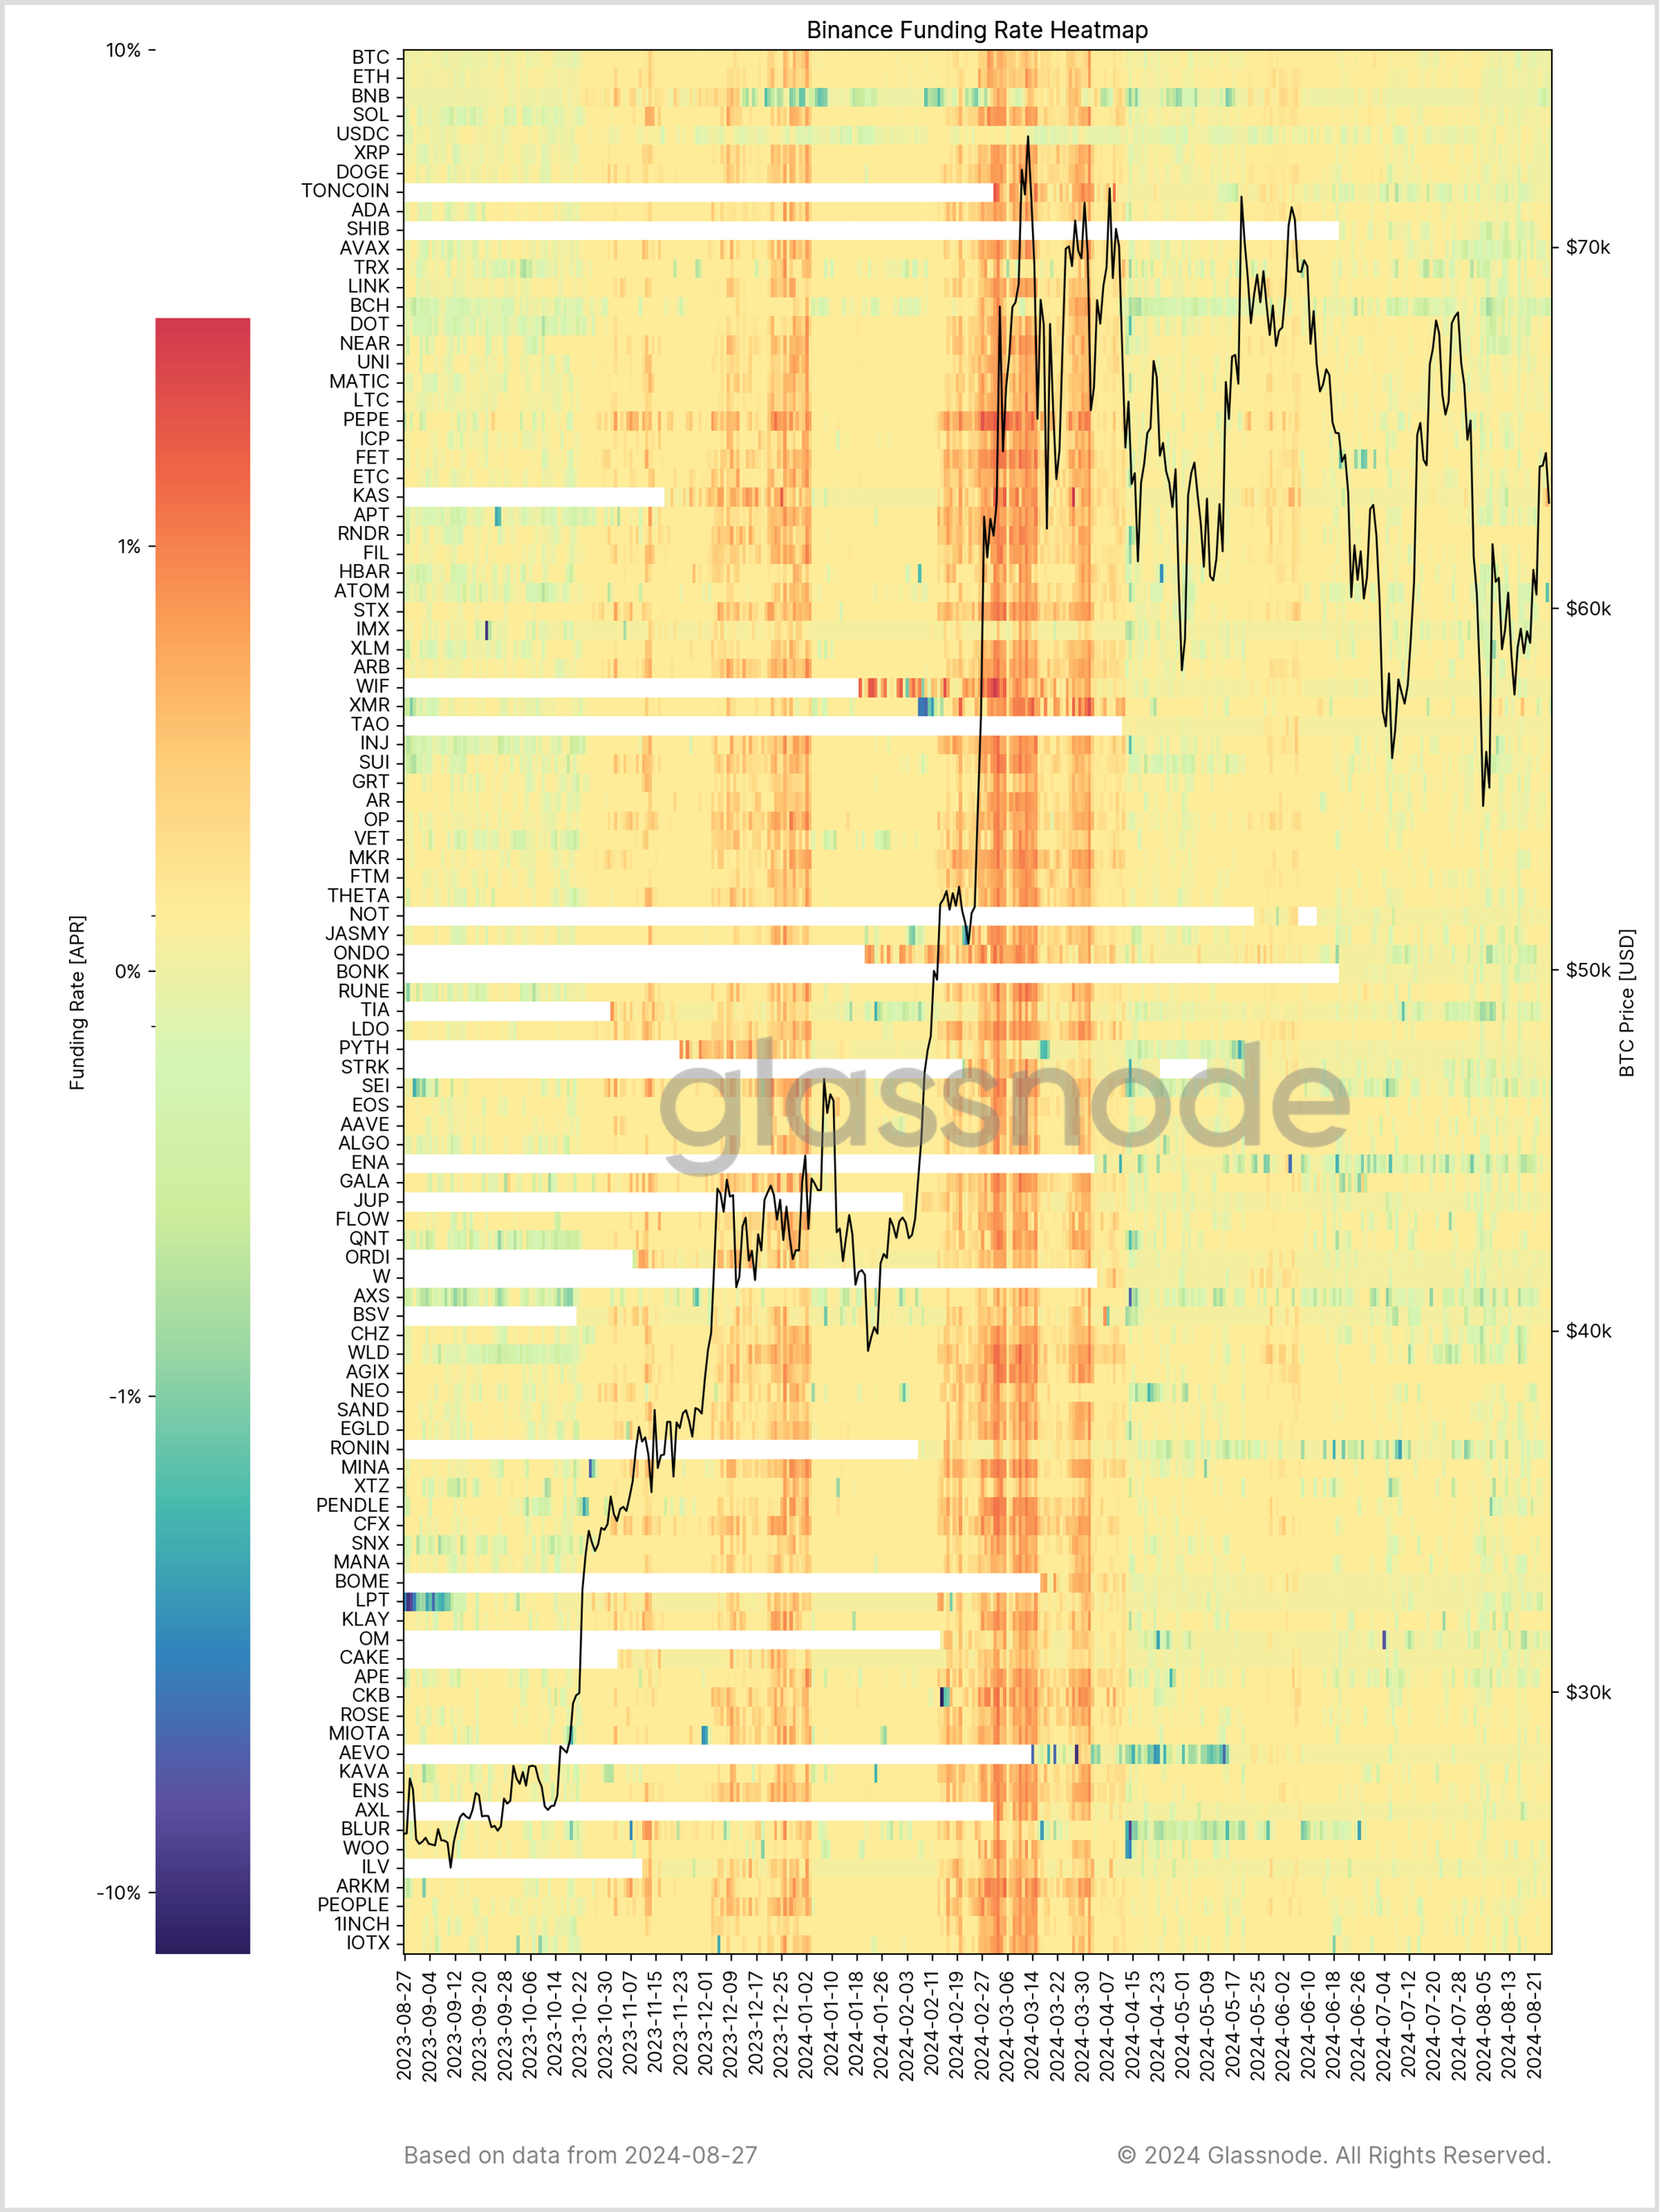
This phenomenon can also be observed across the broader digital asset ecosystem, with a vast swathe of tokens now displaying a neutral funding rate. This underscores the idea that a major reset in speculative interest has occurred across the entire market, and therefore, spot markets are likely to be in the driver's seat for the near term.
Summary and Conclusions
A degree of equilibrium is appearing across both the On-Chain domain and the Perpetual Futures Market. This is observable through the languishment of profit and loss-taking activities, as well as the return to neutrality in funding rates materializing across the vast Digital Asset universe. This suggests a significant decline in speculation across market investors, regardless of instrument or asset class.
Alongside this, the market has remained within a structurally ordered downtrend for over 5 months as a period of consolidation and accumulation ensues. However, with respect to historical preference, periods of quiet and calm market structure are short-lived and often precede an expectation for heightened volatility.
Disclaimer: This report does not provide any investment advice. All data is provided for information and educational purposes only. No investment decision shall be based on the information provided here and you are solely responsible for your own investment decisions.
Exchange balances presented are derived from Glassnode’s comprehensive database of address labels, which are amassed through both officially published exchange information and proprietary clustering algorithms. While we strive to ensure the utmost accuracy in representing exchange balances, it is important to note that these figures might not always encapsulate the entirety of an exchange’s reserves, particularly when exchanges refrain from disclosing their official addresses. We urge users to exercise caution and discretion when utilizing these metrics. Glassnode shall not be held responsible for any discrepancies or potential inaccuracies. Please read our Transparency Notice when using exchange data.
- Join our Telegram channel
- For on-chain metrics, dashboards, and alerts, visit Glassnode Studio
- For automated alerts on core on-chain metrics and activity on exchanges, visit our Glassnode Alerts Twitter