SOL 为何暴跌 ?行情能稳住吗?

金色财经Published on 2024-08-05Last updated on 2024-08-05

Solana 价格已突破关键支撑位。相对强弱指数和 Chaikin 资金流等技术指标表明看跌势头持续。

v2-766efd9abaab24f284bfea740ecd8b85_720w.webp

在持续的市场冲击中,Solana 的价格并未落后,在过去 24 小时内遭受了两位数的百分比损失。市场中明显的恐惧让多头重新撤退,投资者纷纷离场观望,正如 Solana 网络上链上交易量的下降所表明的那样。Solana 图表表明,随着资产跌破关键支撑位,将出现更多损失。

市场崩盘带来冲击

市场领头羊 比特币(BTC),已暴跌超过13%,目前交易价格为岌岌可危的 52208 美元。第五大数字货币 Solana 的跌幅更大,价值缩水近 23.98%。整体加密货币市值遭受重创,缩水 13% 至 1.87 万亿美元。讽刺的是,价格的大幅下跌恰逢交易量惊人的 179.57% 激增,表明市场被恐惧和不确定性所笼罩。

Solana 价格处于边缘

Solana 的价格在伦敦交易时段过去 24 小时内下跌了 12.6%,至 122.82 美元,反映了整个加密货币市场的恐慌。

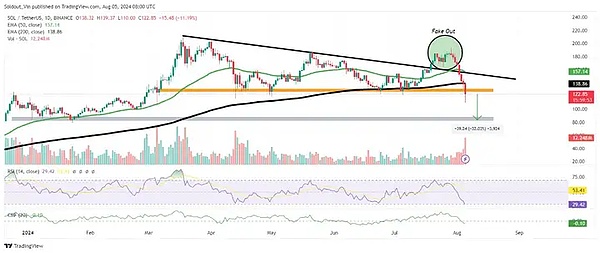
SOL 价格目前处于下降趋势。图表显示下降三角形,在阻力位上方出现假突破(假突破),随后出现强劲下跌。最近的蜡烛图显示强劲的看跌走势,并出现大红蜡烛,表明下跌势头持续。

50 日 EMA 为 157.14 美元,200 日 EMA 为 138.86 美元。两者均高于当前价格,证实了看跌趋势。

灰色带突出显示了 SOL 价格在 100 美元的临时支撑位和 60 美元至 80 美元之间的更强支撑区域。如果价格走势突破这两个障碍,Solana 可能会回落 52 美元。Solana 价格图表还显示阻力位在 138.86 美元(200 日 EMA),其次是 157.14 美元(50 日 EMA)。

相对强弱指数 ( RSI ) 为 29.43,表明价格处于超卖区域。这可能会导致短期反弹,但总体趋势仍然看跌。Chaikin 资金流 (CMF) 为 -0.10 且呈下降趋势,表明资产资本外流,抛售压力增加。这进一步支持了看跌前景。

成交量明显较高,达到 12082 万,表明抛售压力强劲,并确认了下跌趋势。

v2-a1d7c5cbfd085d6c7801e22ac3e7a5cd_720w.webp

Solana价格分析图

突破 50 和 200 EMA 可能会使看跌论点失效,并将价格推回 188 美元和 210 美元。不过,目前不太可能出现这种情况。

SOL 链上指标预示未来将进一步下跌

链上指标进一步证实了 Solana 价格的下跌,该指标实时跟踪网络上发生的情况。Solscan 的数据显示,链上交易量(即网络上传输的 SOL 总量)正在下降。
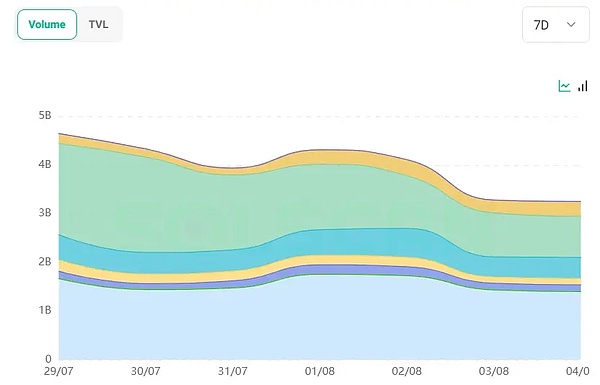
v2-7095de48f7d87246c401c597cc4e96d9_720w.webp

Solana 链上交易量

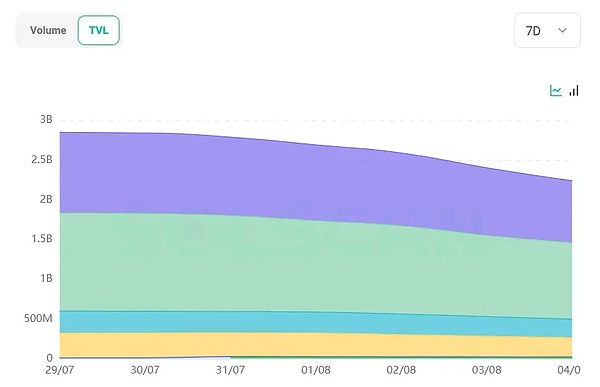
这一下降意味着 SOL 的需求和使用量下降,这是一个看跌信号。此外,交易量的下降影响了网络中锁定的总价值,导致其下降。

v2-c5f90d7bcaba3cf61a7e91c41a466261_720w.webp

同样,在过去七天里,网络上的活跃地址从 1,350,045 个下降到 1,264,296 个。在同一时期,比特币价格从 70,000 美元暴跌 27% 至目前的 50,122 美元。

v2-a353d8cd296ec82e619474a90e572c14_720w.webp

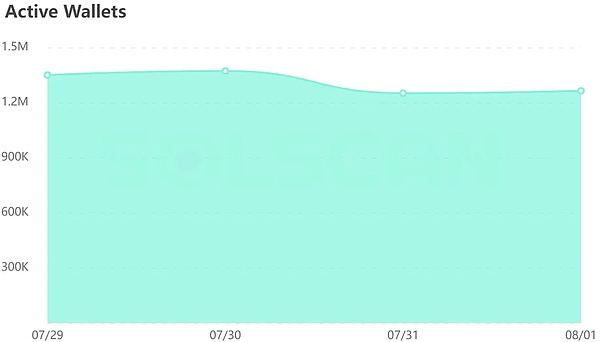
活跃地址数量的下降,加上网络使用量和兴趣的减少,预示着Solana 价格预测呈现看跌趋势。

Solana 的 DEX 表现强劲

尽管市场普遍低迷,但 Solana 的去中心化交易所 (DEX)表现强劲。7月份,30% 的加密 DEX 交易量来自基于 Solana 网络构建的协议,超过了以太坊的 28.12%。

截至月底,Solana 的 DeFi 生态系统已处理了 568.49 亿美元的交易,而以太坊处理了 538.67 亿美元的交易。

Solana价格分析

目前,Solana (SOL) 的交易价格为119.26 美元,过去 24 小时内下跌 16.67%。如果价格跌破 115 美元,可能会进一步下跌至支撑位 107 美元。相反,如果价格升至 135 美元以上,则可能达到阻力位 164 美元。

简单来说

尽管 SOL 凭借强劲的 DEX 表现逆市而上,并且交易量显著上升,但Solana 暴跌 17%,这使投资者担忧加剧这也预示看跌情绪上涨,价格持续下跌。技术指标与看跌市场结构也暗示该资产的价格将低于 100 美元。

我认为目前加密货币市场疲软,看跌情绪盛行接下来SOL价格会持续下跌,短期内会持续呈现看跌趋势。长期来讲市场稳定复苏时有机会突破 50 和 200 EMA 使看跌论点失效,并将价格推回 188 美元和 210 美元。由于季节规律 8、9月份市场可能会持续呈现低迷态势。

我觉得要尽量选择长择视角,长期持有并专注于基本面良好的项目通常是一种更为稳妥的投资策略。

Trending Cryptos

Related Reads

Report Interpretation: J.P. Morgan Details Micron's Pre-Earnings Sentiment, Current Hardware Sector Dynamics

Morgan Stanley analyst Joshua Meyers' report (June 21, 2026) highlights key trends in the hardware and semiconductor sector ahead of Micron's earnings. The core takeaways are: 1. **Micron & Memory:** Memory remains a high-conviction long theme, driven by strong AI demand and rising ASPs. However, investor focus is shifting to the sustainability of Micron's >80% gross margins and the specifics of potential new long-term supply agreements (SCAs). 2. **Hardware Supply Chain:** AI-related demand for servers, networking, and storage remains robust, but company performance is diverging. Celestica (CLS) shows improved margin confidence, Western Digital and Seagate benefit from pricing, Fabrinet (FN) sees predictable AI optics growth, and Teradyne (TER) anticipates a new Google customer. 3. **AI Capex & WFE Forecasts:** JPMorgan increased its Wafer Fab Equipment (WFE) market growth forecasts to 28% in 2026 and 29% in 2027. AI infrastructure financing is evolving, with higher project-level debt reducing constraints on capex expansion. The report signals that while the AI-driven hardware cycle is strong, the market is entering a phase focused on execution verification (e.g., Micron's SCA details, Fabrinet's ramp with Amazon) and valuation sustainability. Key near-term signals include Micron's guidance, Arista Networks' outlook, and the pace of demand normalization post potential tariff-related pull-ins.

marsbit8h ago

Report Interpretation: J.P. Morgan Details Micron's Pre-Earnings Sentiment, Current Hardware Sector Dynamics

marsbit8h ago

Research Report Analysis: The Fed's New Chair's Debut – New Leader, But Same Script?

Report Analysis: Federal Reserve's New Chair Debut – A New Captain, But the Same Script? Morgan Stanley's chief global economist Seth B. Carpenter analyzes the first FOMC meeting under new Fed Chair Kevin Warsh in a June 21 report. Warsh deliberately avoided providing forward guidance on interest rates, aligning with his philosophy. However, market expectations for a rate hike this year were reinforced. Key signals lie elsewhere: inflation may fall more than expected, and quantitative tightening (QT) could be more aggressive than anticipated. The FOMC's "dot plot" suggests only one rate hike in 2026. Carpenter argues that if inflation undershoots forecasts, the logic for even a single hike weakens, especially as projections indicate potential rate cuts in 2027. On QT, Warsh's stance is clear. Carpenter notes that measures like halving the Treasury's account balance could shrink the Fed's balance sheet by around $500 billion with minimal market impact. Combined with adjustments to reserve interest and liquidity rules, the ultimate QT scale may exceed expectations, though its market effect might be less disruptive unless the Fed actively sells Mortgage-Backed Securities (MBS). While Warsh initiated a review of the Fed's policy framework, the 2% inflation target remains intact for now. The report concludes that the market may be overestimating the significance of reduced forward guidance and the near-term rate hike risk, while potentially underestimating the scope and manageable nature of the coming balance sheet reduction. The key debates will hinge on upcoming core PCE data, the specifics of the QT path, and the framework review's findings.

marsbit8h ago

Research Report Analysis: The Fed's New Chair's Debut – New Leader, But Same Script?

marsbit8h ago

Critical Game Week: BTC Retracement Confirmation vs. HYPE Support Battle | Guest Analysis

This weekly analysis outlines a critical juncture for BTC and HYPE markets, focusing on key price level confirmations. **BTC Analysis:** BTC is at a pivotal point after a five-wave rally from the June 5th low of $59,100. The price has broken below a short-term rising channel's lower boundary, with the current move seen as a pullback to test this breakdown. Failure to reclaim this level could lead to a retest of the $59,000-$60,000 support zone. The core scenario hinges on this channel retest outcome. * **Key Levels:** Resistance at $64,500-$65,000 (channel boundary) and $69,500-$70,500. Support at $59,000-$60,000 and $55,000. * **Strategy:** A core bearish stance is maintained (20% short from last week), with short-term plans for tactical trades. Three detailed contingency plans (A/B/C) are provided for short positions on resistance tests or breakdowns, emphasizing strict stop-loss discipline. **HYPE Analysis:** HYPE shows strong momentum but is currently in a corrective phase after hitting a new high of $76.94. The price is retesting the crucial $64-$66 support area. * **Key Levels:** Resistance near $77 and $80-$82. Support at $64-$66 and $52-$54. * **Strategy:** The short-term approach is "buy on dips, avoid chasing rallies." A long position is considered only if clear stabilization signals appear at the $64-$66 or deeper $52-$54 support zones, with tight risk controls. **General Risk Management:** A standardized trailing stop-loss protocol is emphasized: set initial stop, breakeven at +1% profit, then trail stops upward to lock in gains. *Disclaimer: All analysis is presented as a personal trading framework, not investment advice. Market conditions are complex and require dynamic adjustment.*

marsbit8h ago

Critical Game Week: BTC Retracement Confirmation vs. HYPE Support Battle | Guest Analysis

marsbit8h ago

Trading

Spot
Futures

Hot Articles

Discussions

Welcome to the HTX Community. Here, you can stay informed about the latest platform developments and gain access to professional market insights. Users' opinions on the price of SOL (SOL) are presented below.

活动图片