Jump一周抛售上亿美元ETH,解析数额细节与潜在抛压

深潮Published on 2024-08-05Last updated on 2024-08-05

Jump Trading仍有少则1亿、多则数十亿美元的ETH。

作者:南枳,Odaily星球日报

今日,加密市场伴随全球经济衰退预期陷入恐慌式螺旋下跌,BTC 从 60000 万美元上方两天跌破 50000 万美元,ETH 自 3000 美元上方跌至最低 2100 美元附近。尽管宏观消息面上存在诸多利空,今日暴跌的主要场内诱因则被认为是知名加密机构 Jump Trading 的大举抛售。

一周之内,Jump Trading 迅猛地抛售了上亿美元的 ETH,结合此前其被美国商品期货交易委员会(CFTC)调查之事,本就恐慌的加密市场正在传言其加密相关业务或将被关停。

那么 Jump Trading 抛售了多少代币,还有多少持仓?Odaily 将于本文进行解析。

Jump 抛售细节

Jump Trading 相关地址的第一笔异动发生于 7 月 26 日,彼时某地址向 Jump Trading转入 7000 枚 ETH,价值约 2260 万美元。此时 ETH 刚刚经历了从 3500 USDT 到 3100 USDT 的暴跌。

两日后,Jump Trading开始了首次抛售,相关地址 将 4737 枚 ETH 存入币安,价值约 1540 万美元。

此后数日,Jump Trading 进行了一系列的资金归集操作,包括从 Lido 中解除质押 ETH、多次从其他钱包中转移 ETH,然后陆续将这些 ETH 存入了交易所。

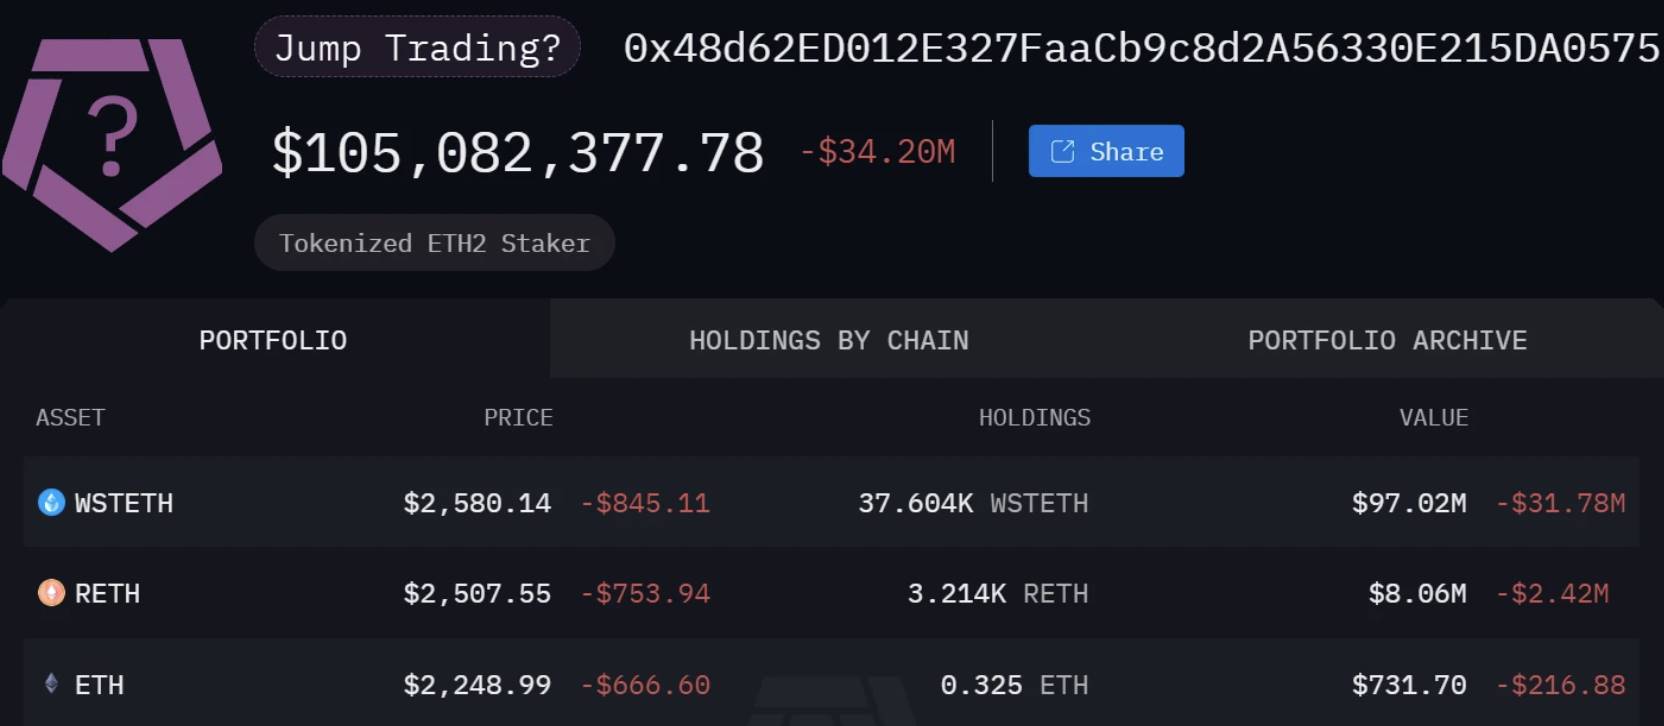
Jump Trading 所持有的 ETH 代币中占比最高的形式是 12 万枚 wstETH,这些代币 Jump Trading 自 7 月 25 日以来就开始持续赎回。

截止发文时,Jump Trading 仍有约 3.7 万枚 wstETH,价值 1 亿美元,此外还有 800 万美元的 RETH,而赎回部分均已转移或销售完毕。

(Odaily 注:wstETH 持仓地址为0x48d62ED012E327FaaCb9c8d2A56330E215DA0575)

剩余持仓情况

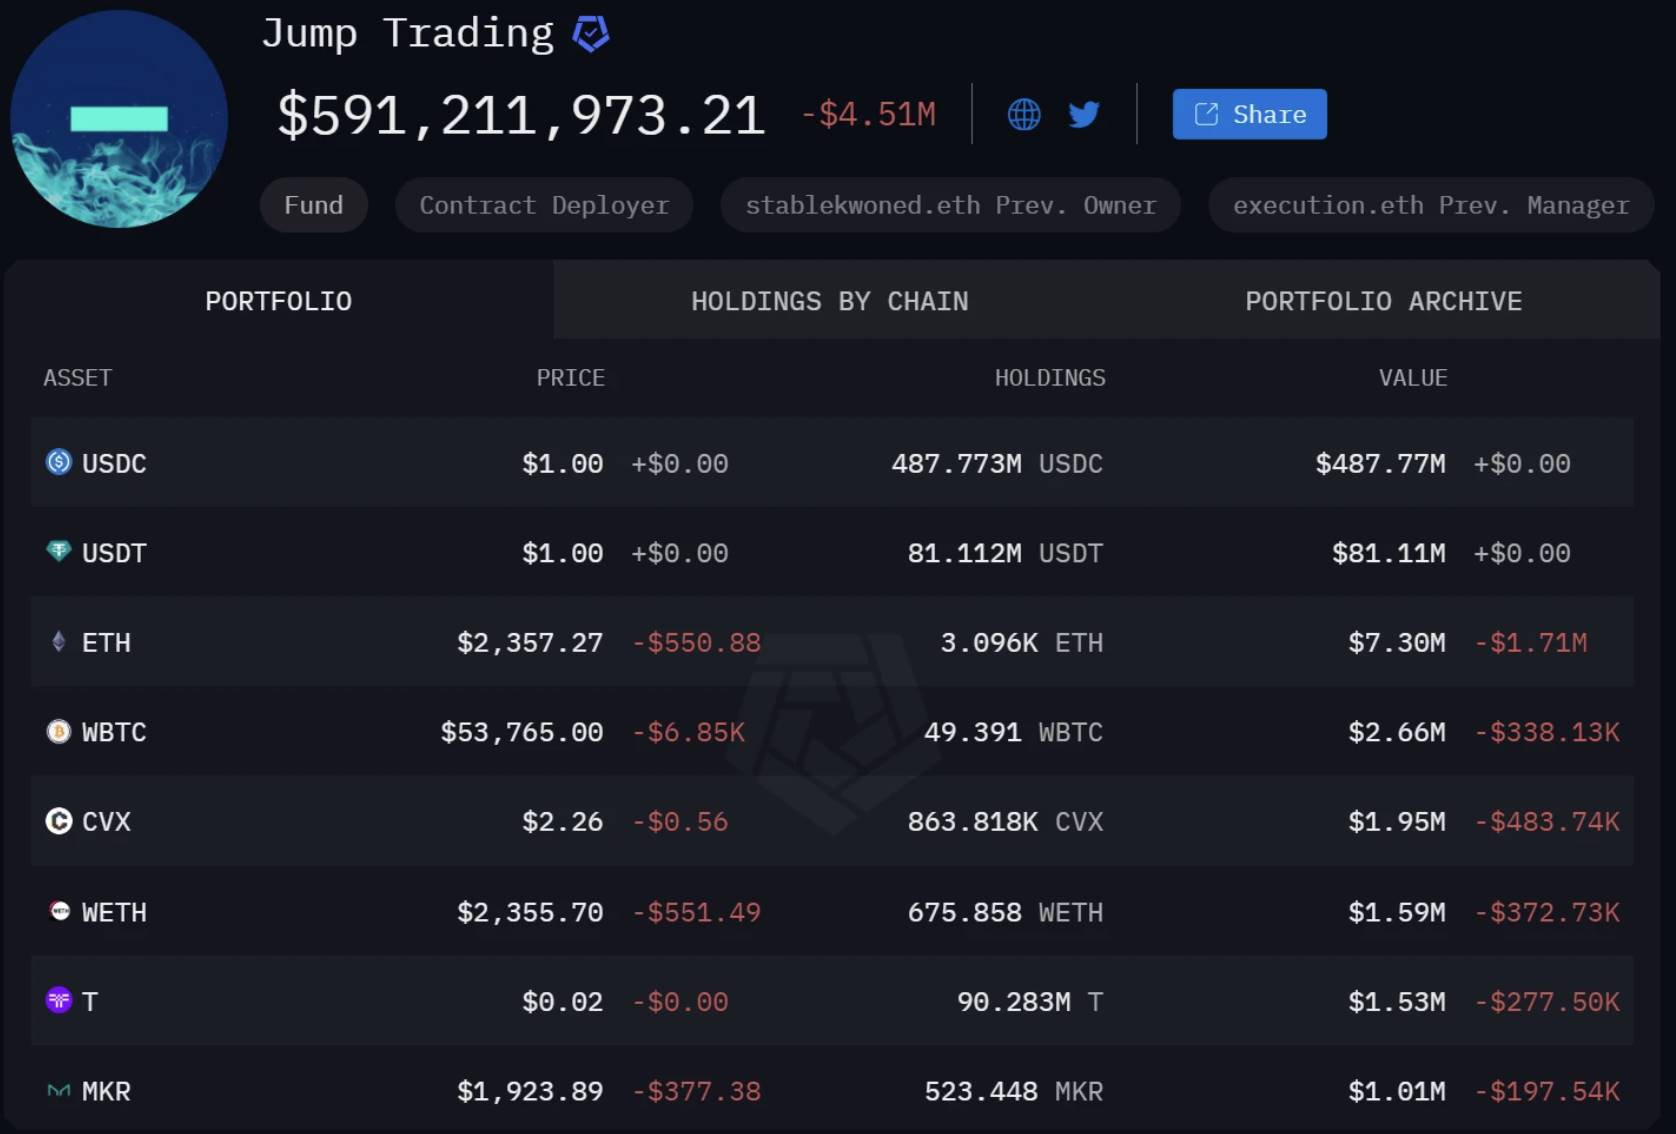
今日上午,多个链上分析团队报道 Jump Trading 持仓中 96% 的代币为稳定币,实际上未纳入以上持有 1 亿美元 wstETH 的地址。

目前 Arkham 标记的 Jump Trading 地址持仓价值为 5.9 亿美元,其中 5.69 亿美元为稳定币,因此明面上的抛压为以上的 1 亿美元 ETH。

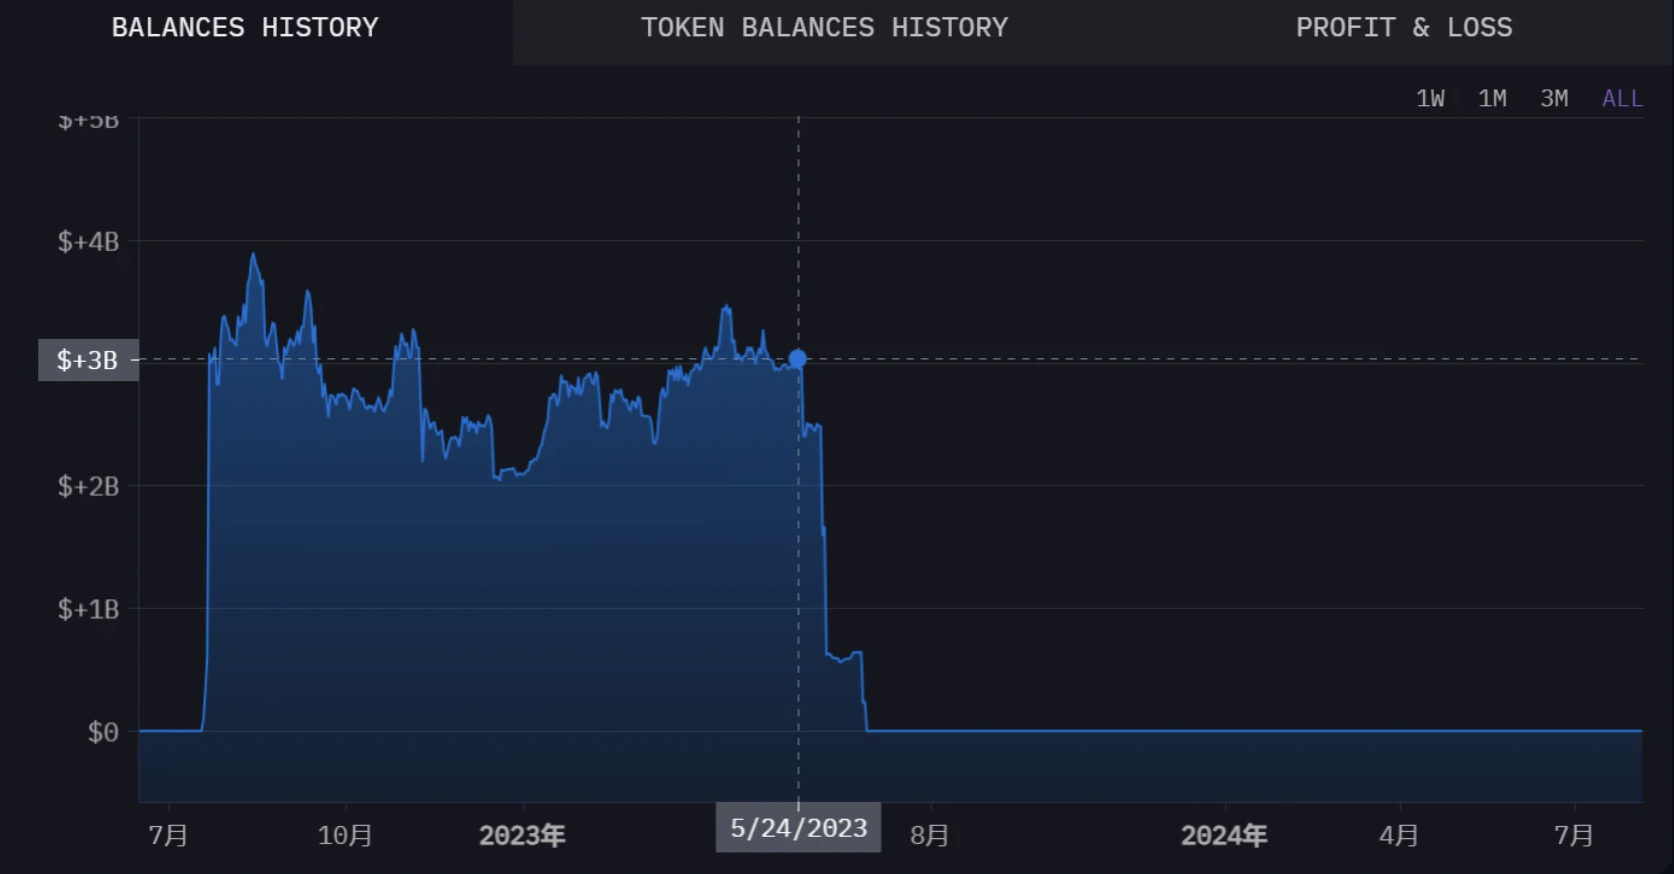
然而 Jump Trading 作为行业龙头,理论上的持仓量应远不止于这 6 亿美元。经 Odaily 调查发现,Jump Trading 的一个老地址在巅峰时期持有 164 万枚 ETH,按照 2300 USDT 的价格价值高达 37.7 亿美元。

不过由于 Jump Trading 在 2023 年 5 月和 6 月将以上百万枚 ETH 转入了 Robinhood,是否出售、转移暂时无法追踪,潜在的抛压量级无法估算,但值得关注。

(Odaily 注:Jump 的老地址为0x0716a17FBAeE714f1E6aB0f9d59edbC5f09815C0)

Jump 将退出加密领域?

为何 Jump 开始快速地抛售 ETH?现还没有公开的定论,但市场猜测此举与此前的 CFTC 调查有关。6 月 20 日,据一则市场消息,美国商品期货交易委员会(CFTC)正在调查 Jump Crypto,但尚不清楚 CFTC 是否考虑对该公司提出任何指控。4 天后,Jump Crypto 总裁 Kanav Kariya 在 X 平台宣布辞职

(Odaily 注:Jump Crypto 是 Jump Trading 的加密部门,于 2021 年 9 月成立。)

在 Jump 抛售 ETH 的过程中,加密货币做市商 Keyrock 亚太区业务发展主管 Justin d'Anethan 表示:“有传言称,由于 CFTC 的调查,他们(Jump Trading)可能被迫退出加密业务。”

今晨暴跌后,BitMEX 联创 Arthur Hayes 于 X 发文表示,其通过传统金融领域的消息渠道得知,某个“大人物”被处置并出售所有加密资产,其补充称不确定消息是否属实,但不会披露具体名称。根据种种迹象,社区猜测其所指为 Jump Crypto。

Jump 领投项目

倘若 Jump Trading 真的因为某些原因,被迫退出加密领域,Jump Crypto 领投的项目可能也将受到影响,我们将近两年 Jump Crypto 领投+已发币的项目整理如下,分别列出了项目名称、代币名称、投资轮次、代币当前的流通市值,轮次越早或持有的代币份额越多:

ZTX-ZTX-种子轮-1850 万美元;

Port3-PORT3-种子轮-489 万美元;

Sui-SUI-B 轮-12.9 亿美元;

Injective-INJ-上市后融资-14 亿美元;

Aptos-APT-A 轮-2.14 亿美元;

AltLayer-ALT-种子轮-1.64 亿美元;

Push Protocol-PUSH-A 轮-372 万美元;

Thetanuts Finance-NUTS-种子轮-500 万美元。

Trending Cryptos

Related Reads

Rented Faith: How Much of the Bitcoin ETF Inflows Is Real Money?

"Rented Conviction: How Much of Bitcoin ETF Flows Is Real Money" The weekly inflows into Bitcoin ETFs are often interpreted as a gauge of institutional belief. However, a significant portion of this activity is driven by a hidden arbitrage trade, not directional conviction. The core mechanism is a cash-and-carry arbitrage: traders buy spot Bitcoin (often via ETFs) while simultaneously shorting CME futures to lock in the price difference, or "basis." This delta-neutral trade is essentially an interest rate play. In weekly data, about half the fluctuation in ETF flows can be explained by new short positions added by leveraged funds (hedge funds), with a correlation of 0.70. Bitcoin's price movement in a given week shows no statistical power in predicting these flows. While this arbitrage trade drives weekly *volatility*, it is not the main component of the cumulative *stock*. Of the total ~$55 billion in net ETF inflows, the current net arbitrage position is only about $1 billion. The remainder is steady, directional buying averaging ~$400 million per week, which constitutes the vast majority of the accumulated "mountain" over two years. Thus, ETF flow data overstates the *volatility* of conviction, not its *level*. This arbitrage trade has been unwinding for nearly two years. Leveraged fund short positions peaked at ~$14 billion in late 2024 and have since declined to ~$4.5 billion. When the basis compresses to unprofitable levels, ETF inflows and short positions retreat together. Recent outflows should not be mistaken for a loss of faith but rather the routine unwinding of this rate trade. For Ethereum ETFs, the pattern is weaker. Accounting for staking yield makes the basis often negative, so neither strong conviction buying nor robust arbitrage supports its flows. To interpret ETF flows correctly, monitor the CME basis versus T-bill rates and leveraged fund net shorts. They reveal how much of the next "demand" headline is real. The real, patient buy-and-hold demand is what constitutes the enduring bulk of ETF assets.

marsbit37m ago

Rented Faith: How Much of the Bitcoin ETF Inflows Is Real Money?

marsbit37m ago

Soaring Over Tenfold Within the Year: The Frenzy Over SK Hynix Leveraged Products

South China Morning Post The leveraged ETF tracking SK Hynix has surged over tenfold year-to-date, fueled by intense market speculation on the memory chip sector. By June 22, the value of the 'South Korea 2x Long SK Hynix ETF' listed in Hong Kong had skyrocketed by more than 1,061% since the start of the year, while its asset size exploded over twenty times from the end of last year. The rally is driven by AI-driven demand for high-bandwidth memory (HBM), with SK Hynix recently sampling its next-generation HBM4E product. However, industry professionals warn of significant risks. Leveraged ETFs magnify both gains and losses. During a recent market correction, while the underlying SK Hynix stock fell 19.1%, its double-leveraged ETF dropped nearly 38%. Korean regulators noted that such products could theoretically lose 60% in a single day. Additionally, these ETFs face risks like time decay in volatile markets, liquidity spirals during mass redemptions, and extreme price dislocations from market-making failures, as seen in early June when an ETF moved opposite to its underlying stock. The trading is predominantly driven by retail investors, with institutional capital largely absent due to the products' high volatility. Analysts caution that with the semiconductor sector at elevated valuations and facing geopolitical and supply chain uncertainties, leveraged ETFs pose a substantial threat of amplified losses for uninformed investors.

marsbit1h ago

Soaring Over Tenfold Within the Year: The Frenzy Over SK Hynix Leveraged Products

marsbit1h ago

18 Months, Over 50x Surge: KIOXIA's Epic Comeback

KIOXIA, a NAND flash memory giant, staged a dramatic comeback driven by AI demand. After a period of significant losses, a failed merger, and missed HBM opportunities, its 2024 IPO began modestly. However, fueled by explosive demand for AI data storage, its stock price skyrocketed over 50 times within 18 months, making it Japan's most valuable company, surpassing Toyota. Its Q1 FY2026 profit guidance soared 30-fold year-over-year, with 2026 NAND capacity already sold out. Key to its success is its 3D NAND technology, BiCS FLASH. As the inventor of NAND, KIOXIA advanced its technology through generations, reaching over 200 layers by 2023. Key innovations include CBA (CMOS directly Bonded to Array), which separately manufactures control circuits and memory arrays for better performance, and OPS (On Pitch Select Gate) to increase density. The company is now developing high-capacity packages like an 8TB solution stacking 32 dies. Looking beyond NAND, KIOXIA is exploring 3D DRAM with its OCTRAM technology, using oxide semiconductor transistors for ultra-low leakage to reduce power consumption. This fundamental research differs from HBM and represents a long-term bet to extend its 3D expertise from NAND into future DRAM architectures. KIOXIA's story highlights how technological assets and shifting market cycles can rapidly transform a company's fortunes. While questions remain about sustaining growth beyond the current AI boom, its resurgence demonstrates that in semiconductors, being down does not necessarily mean being out.

marsbit1h ago

18 Months, Over 50x Surge: KIOXIA's Epic Comeback

marsbit1h ago

Market Trends in U.S. Stocks (June 23): Peak at Listing? SpaceX Loses Over $800 Billion in Three Days, Tech Stocks Experience Severe Internal Divergence

Stock Market Trends (June 23): Did SpaceX Peak at IPO? The company loses over $800 billion in market value in three days as a sharp divergence unfolds within the tech sector. SpaceX's post-IPO decline of over 20%, falling below its first-day close, reflects a swift market repricing. The catalyst is a clear shift in narrative from "AI platform potential" to concerns over rising capital costs, as its $8.57 billion IPO and subsequent $20 billion debt offering are earmarked for acquisitions and refinancing existing bridge loans rather than de-leveraging. While high-valuation tech stocks like Google, Meta, Amazon, and Microsoft faced pressure, Micron surged nearly 7% to a record high following a strategic supply deal with Anthropic for HBM and memory, highlighting robust, tangible demand in AI infrastructure. The broader market saw funds rotate into more defensive industrial and financial names. Macro factors included a dip in oil prices to a three-month low on news of a US-Iran framework deal, though logistical hurdles for resuming full Strait of Hormuz shipments remain. Key events ahead include Nvidia's shareholder meeting, Micron's earnings, and the May PCE inflation data. The latter will be crucial in determining whether the sell-off in high-valuation growth stocks, which appears to have just begun, will persist.

marsbit1h ago

Market Trends in U.S. Stocks (June 23): Peak at Listing? SpaceX Loses Over $800 Billion in Three Days, Tech Stocks Experience Severe Internal Divergence

marsbit1h ago

Trading

Spot
Futures

Hot Articles

Discussions

Welcome to the HTX Community. Here, you can stay informed about the latest platform developments and gain access to professional market insights. Users' opinions on the price of ETH (ETH) are presented below.

活动图片