Bitcoin Consolidates for Next Move, HYPE Restarts Bearish Trend | Guest Analysis

Odaily星球日报Published on 2026-07-20Last updated on 2026-07-20

Abstract

Bitcoin fluctuates around the key resistance zone of $65,700-$67,300 after rebounding from the $57,820 low. A break above this area could shift the short-term structure to a stronger bullish logic; otherwise, a daily-level correction may resume. The medium-term outlook remains bearish, with a 20% short position held. Short-term trading involves 30% capital for price differential opportunities, with prepared plans (A: shorting near resistance; B: testing long near $57,820 support) based on model signals. A previous short-term long trade yielded a 3.45% profit. HYPE continues its correction from the $72.97 high, with focus on the $62-$63.5 resistance area. The 4-hour chart analysis suggests the downtrend is not over, and new lows below $58.16 are likely. The strategy is to consider light short positions (under 30% allocation) if price rallies to the $62-$63.5 zone and shows reversal signals, with strict stop-loss discipline. General reminder: Always set initial stop-losses, move them to breakeven at +1% profit, and trail them to lock in gains. Market conditions change rapidly; this analysis is for personal trading log purposes only and not investment advice.

This week, Bitcoin continued its rebound above the low of $57,820, with the price approaching the critical resistance zone of $65,700~$67,300. The battle between bulls and bears has entered a white-hot stage—if the rebound is rejected and falls back within this zone, a daily-level correction may resume; if it breaks through effectively, the short-term structure will shift to a stronger bullish logic. HYPE extended its correction from the high of $72.97, with this week's focus on the battle outcome in the $62~$63.5 zone. The medium-term view remains bearish-dominated, while short-term operations should strictly follow model signals, dynamically switching between Plan A and B.

Summary of This Week's Core Trading Views:

  • BTC Multi-Timeframe Structure Analysis (Detailed in Part 1)
  • BTC Weekly Market Forecast & Medium/Short-term Trading Strategies (Detailed in Part 2)
  • HYPE Hourly Chart Structure Analysis (Detailed in Part 3)
  • HYPE Weekly Market Forecast & Short-term Trading Strategies (Detailed in Part 4)

Market Verification of Last Week's Trading Strategies & Core Views:

  • BTC Market Forecast Verification: Last week's article clearly stated that Bitcoin's daily chart entered a short-term consolidation pattern. The subsequent market movement confirmed our prediction.
  • BTC Short-term Trading Performance: One short-term long trade (1x leverage) on Bitcoin was completed last week, achieving a profit of approximately 3.45%. (Detailed in Part 5)
  • HYPE Market Forecast Verification: Last week's article clearly stated: If prices rebound early in the week but fail to break the previous high of $72.97, it would signal a reversal of the prior uptrend, indicating a daily-level correction starting from the high of $72.97. The current market movement is highly consistent with our judgment.

一、Bitcoin Multi-Timeframe Structure Analysis

1、Bitcoin Daily Chart Structure Analysis: (Based on post-May 6th price action)
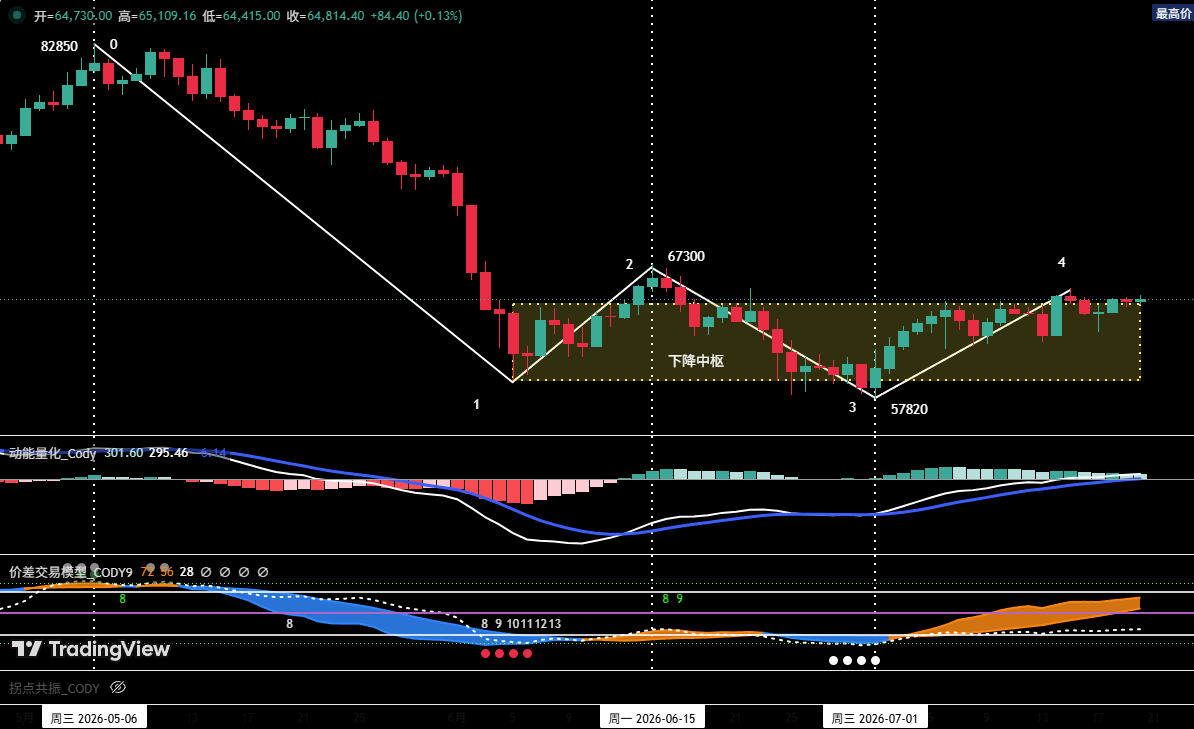
Figure 1 Bitcoin Daily Candlestick Chart

1 As shown in (Figure 1): The corrective move starting from the May 6th high of $82,850 has formed a four-segment corrective structure on the daily chart: (0-1), (1-2), (2-3), (3-4).

2 After touching the low of $57,820 on July 1st, the market is currently in the (3-4) rebound segment. The rebound high has reached $65,600, with the price approaching the key resistance around $65,700. Currently, this rebound segment may not be over, and the recent high of $65,600 is likely not the terminal point "Endpoint 4".

3 If the (3-4) rebound segment shows clear signs of exhaustion and adjustment upon encountering resistance in the $65,700~$67,300 zone, then the first daily-level segment (i.e., wave a) of the rebound starting from the July 1st low of $57,820 may have concluded.

2、In-Depth Analysis of Bitcoin Hourly Chart Structure: (Using 4-hour as analysis cycle)
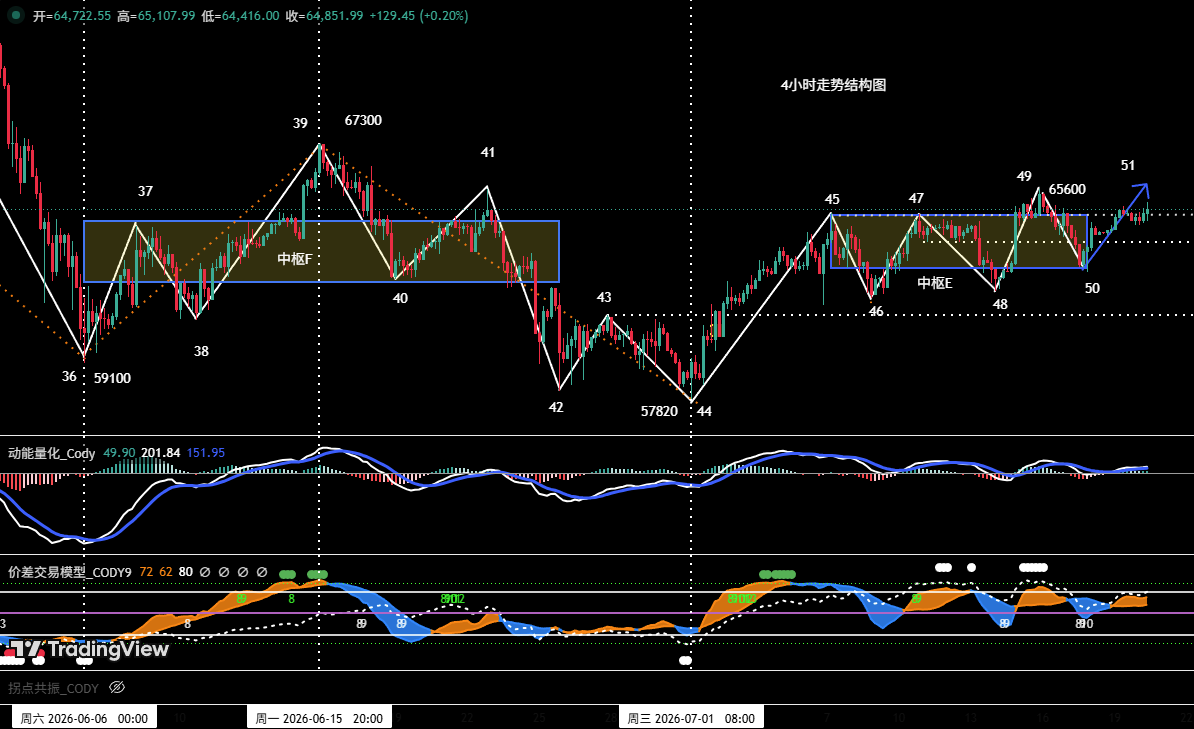
Figure 2 Bitcoin 4-Hour Candlestick Chart

1 In the 4-hour chart, the rebound from the July 1st low of $57,820 has clearly presented a seven-segment structure from (44-45) to (50-51). Among them: segments (45-46), (46-47), (47-48), (48-49), (49-50) overlap, forming a "five-segment" consolidation zone E.

2 Based on the current structure analysis, the price is currently in the (50-51) rebound segment.

  • If the price effectively breaks above the $65,700 resistance and the rebound continues, the probability of this segment upgrading into the breakout leg from the consolidation zone increases significantly. At that point, its momentum should be compared with the entry leg (44-45). If a momentum divergence forms between them when "Endpoint 51" terminates, the rebound starting from "Endpoint 44" (~$57,820) may end, with a high probability of a subsequent correction.
  • If the rebound fails to effectively break above the $65,700 resistance, the price is likely to remain in range-bound consolidation in the short term.

二、Bitcoin Weekly Market Forecast & Trading Strategies

1、BTC Weekly Market Forecast:

Core View for the Week: Focus on the test results when the price rebounds to the key resistance zone of $65,700~$67,300.

2、Core Resistance Levels:

  • First Resistance Zone: $65,700~$67,300 area (Previous significant resistance)
  • Second Resistance Zone: $69,500~$71,000 area (Previous significant resistance)

3、Core Support Levels:

  • First Support Level: Around $64,700 (Previous important support)
  • Second Support Zone: $60,950~$62,000 area (Previous important support)
  • Third Support Level: Around $57,820 (Previous important support)

4、Weekly Trading Strategies (Excluding sudden news impacts)

1 Medium-term Strategy:
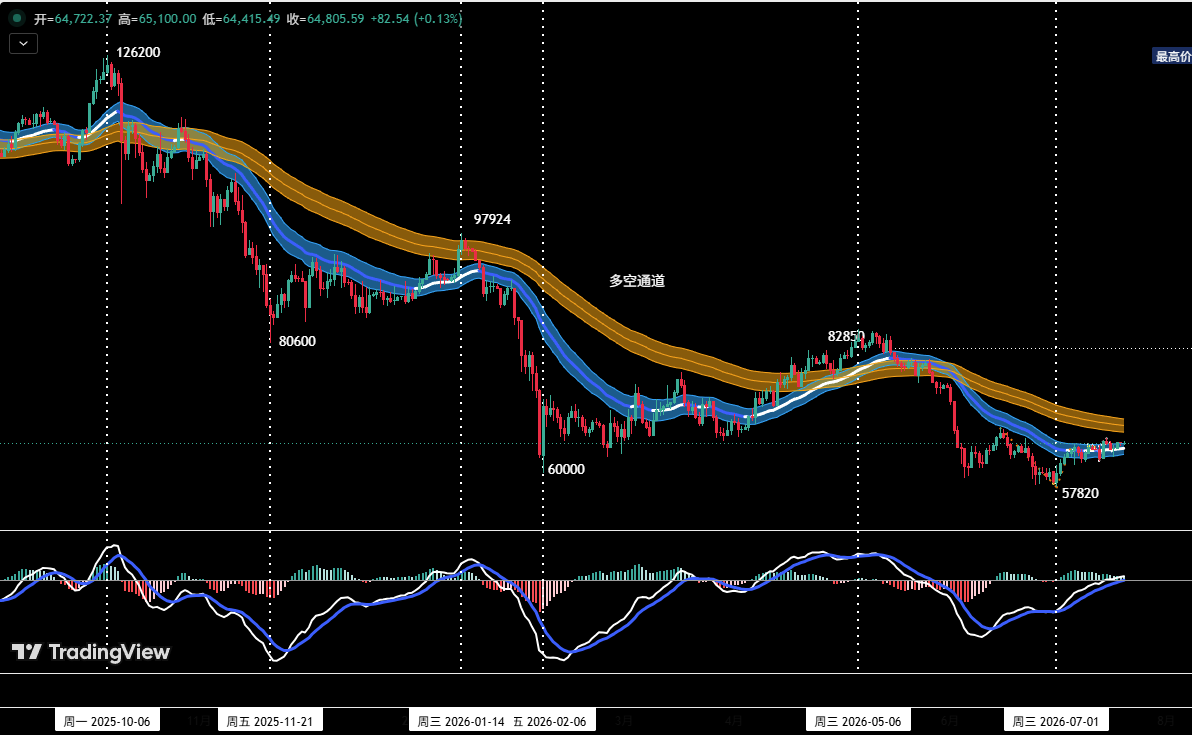
Figure 3 Bitcoin Daily Candlestick Chart: (Position Monitoring Model)

Position Monitoring Model: As shown in (Figure 3), the current price has effectively broken below the "Bull-Bear Channel," confirming a shift to a bearish-dominated market structure.

  • Current medium-term bearish positions are maintained at around 20%.
  • If the price shows signs of exhaustion upon rebounding to the $65,700~$67,300 zone, combined with top signals from the proprietary quantitative model, consider increasing medium-term bearish positions to within 50%.

2 Short-term Strategy:

Utilize 30% of capital, set stop-losses, and look for "spread" trading opportunities based on support and resistance levels. (Using 30-minute/60-minute as the operation cycle)

3 In short-term operations, to dynamically respond to complex market changes, we have prepared two specific contingency plans: A and B.

Plan A: Tentative Short at Strong Resistance Zone

  • Entry: If the price encounters resistance upon rebounding to the $65,700~$67,300 zone, combined with top signals from the quantitative model, consider establishing a short position of around 30%.
  • Risk Control: Set an initial stop-loss.
  • Exit: Gradually close the position to realize profits when the price adjusts near important support levels, combined with model signals.

Plan B: Light Long Test at Strong Support Zone

  • Entry: After the price is rejected from the $65,700~$67,300 zone and falls back, if signs of stabilization appear above the previous low of $57,820, combined with bottom signals from the quantitative model, consider establishing a long position of around 30%.
  • Risk Control: Set an initial stop-loss.
  • Exit: Gradually close the position to realize profits when the price rebounds near important resistance levels, combined with model signals.

三、HYPE Hourly Chart Structure Analysis
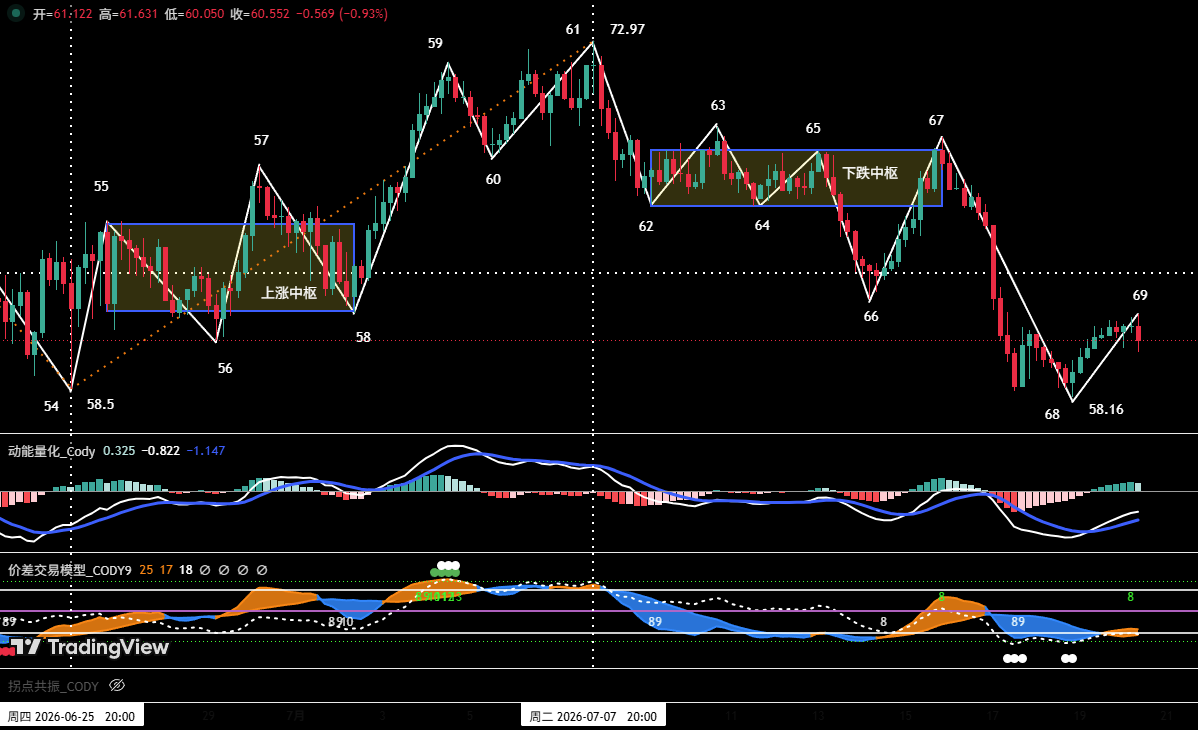
Figure 4 HYPE 4-Hour Candlestick Chart

1. As shown in (Figure 4), the correction in HYPE starting from the July 7th high of $72.97 (Endpoint 61) can be subdivided into an eight-segment corrective structure on the 4-hour chart. Segments 62-63, 63-64, 64-65, 65-66, 66-67 overlap, forming a "five-segment" bearish consolidation zone.

2. Last week's review pointed out: When the market subsequently ran the (62-63) rebound segment, if "Endpoint 63" failed to break the previous high "Endpoint 61" ($72.97), it would mean the end of the daily uptrend from "Endpoint 54 to Endpoint 61," and the market would start a daily-level correction from "Endpoint 61." The market corrected as expected last week, falling from "Endpoint 63 to Endpoint 68," with a maximum decline of approximately 16.17%.

3. Based on the 4-hour chart analysis:

Comparing the momentum of the breakout leg (67-68) with the entry leg (61-62), the downward momentum of the breakout leg is significantly stronger than the former. This suggests a lower probability that "Endpoint 68" ($58.16) is the low of this correction. The market is currently in the (68-69) rebound segment, after which prices may potentially test new lows.

四、HYPE Weekly Market Forecast & Short-term Trading Strategy: (07.20~07.26)

1、HYPE Weekly Market Forecast:

1 Core Resistance Levels:

  • First Resistance: $62~$63.5 area
  • Second Resistance: $68~$69.5 area
  • Third Resistance: Around $72.97

2 Core Support Levels:

  • First Support: Around $58.16
  • Second Support Zone: $52~$55 area

Core HYPE View for the Week: Monitor the test results when the price rebounds to the $62~$63.5 zone.

2、HYPE Weekly Short-term Trading Strategy:

If the price shows clear adjustment signals upon rebounding to near $62~$63.5 or higher resistance areas, investors may consider entering light short positions. Strict stop-loss discipline is required, with position size controlled within 30%.

五、Bitcoin Short-term Trade Review

We strictly followed the operation plan and the trading signals issued by our proprietary "Spread Trading Model" and "Momentum Quantitative Model," completing one short-term (long) trade last week, achieving a total trading profit of approximately 3.45%.

1、Short-term Trade Record: (See Table 1)

Bitcoin Short-term Trade Details Summary: (Leverage ×1)
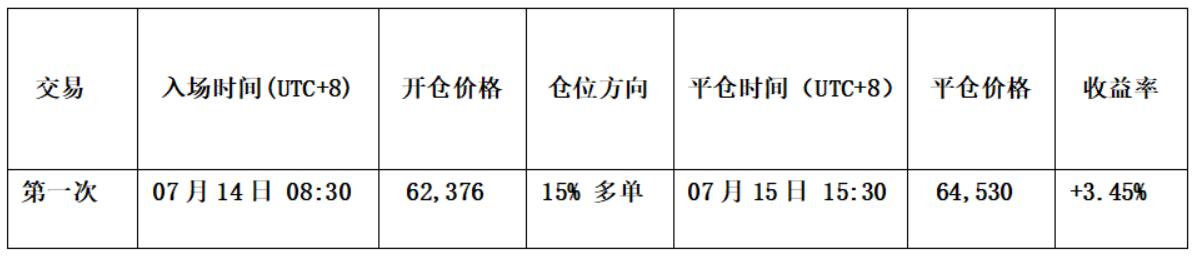
Table 1

2、Short-term Trade Review: (See Figure 5)

Entry Strategy:

a. When the price adjusted above $61,000, signs of stabilization appeared, and the candlesticks formed a "bottom reversal" pattern.

b. The "Momentum Quantitative Model" formed a bullish divergence signal.

c. After the "Spread Trading Model" triggered a strong bottom warning signal (white dot + red dot), the signal band (orange-yellow) in the chart broke above the horizon line (purple-red), issuing a bottoming rebound signal.

Therefore, we established a 15% long position at $62,376.

Exit Strategy:

a. When the price showed signs of exhaustion upon rebounding near $65,700, forming a "top reversal" candlestick pattern.

b. After the "Spread Trading Model" continuously triggered top warning signals (white dot + green dot), the signal band (blue) in the chart broke below the skyline (green), forming a top resonance signal with the "Momentum Quantitative Model."

Therefore, we closed the entire position around $64,530.

Summary: This trade successfully yielded a profit of approximately 3.45%.

3、Short-term Trade Schematic
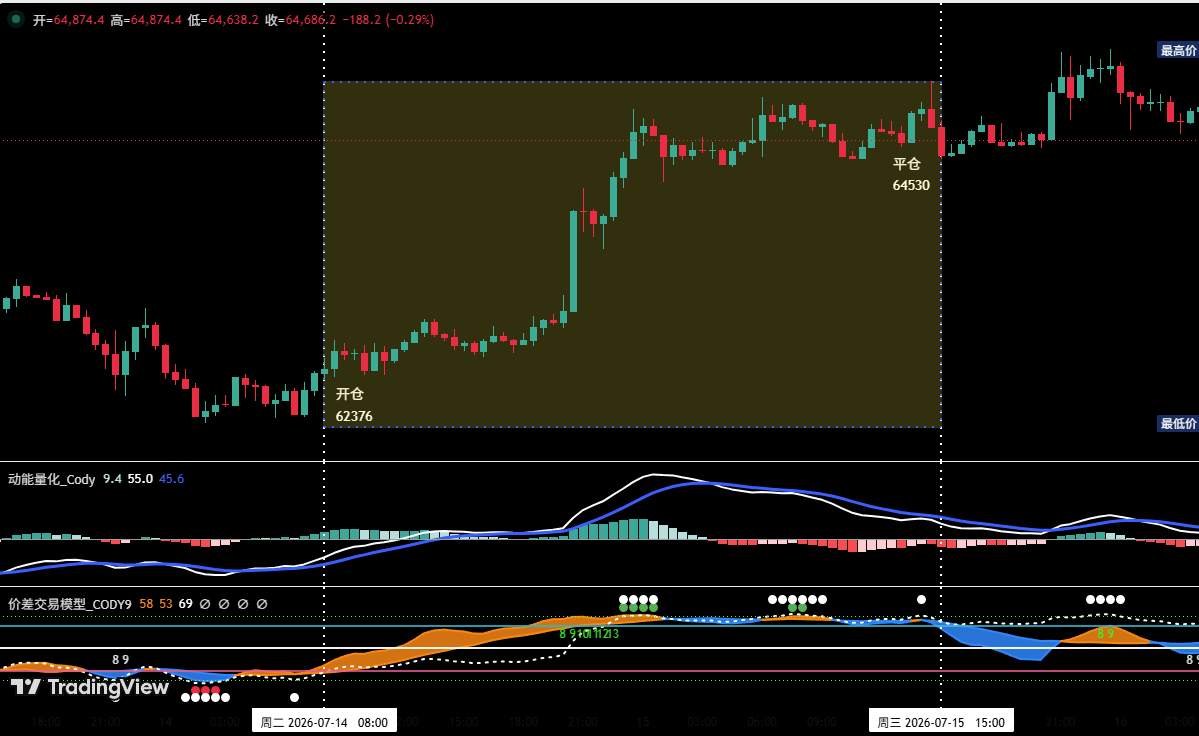
Figure 5 BTC 30-Minute Candlestick Chart: (Momentum Quantitative Model + Spread Trading Model)

六、Special Instructions:

  1. Upon Entry: Immediately set an initial stop-loss.
  2. When Profit Reaches 1%: Move the stop-loss to the entry price (breakeven point) to ensure capital safety.
  3. When Profit Reaches 2%: Move the stop-loss to the 1% profit level.
  4. Continuous Tracking: Thereafter, for every additional 1% profit, move the stop-loss up by 1% accordingly, dynamically protecting and locking in profits.

Financial markets are ever-changing. All market analysis and trading strategies require dynamic adjustment. All views, analytical models, and operational strategies mentioned in this article are derived from personal technical analysis and are solely for personal trading log purposes. They do not constitute any investment advice or basis for operation. The market carries risks; invest with caution. Do not make decisions based solely on this content.


Trending Cryptos

Related Questions

QAccording to the technical analysis, what is the key resistance zone for Bitcoin (BTC) this week, and what are the two potential market outcomes based on a test of this zone?

AThe key resistance zone for Bitcoin this week is $65,700–$67,300. If the price faces resistance and falls back in this area, a daily-level adjustment may resume. Conversely, if it breaks through this resistance effectively, the short-term structure will shift to a stronger bullish logic.

QWhat is the core trading strategy for HYPE this week as outlined in the article?

AThe core strategy for HYPE is to monitor the test result when the price rebounds to the $62–$63.5 area. If the price shows a clear reversal signal near this resistance zone (or a higher one), investors can consider opening a light short position with strict stop-loss discipline, keeping the position size within 30%.

QDescribe the two specific operational plans (Plan A and Plan B) prepared for Bitcoin's short-term trading.

APlan A (Tentative Short at Strong Resistance): If BTC price meets resistance in the $65,700–$67,300 zone and shows topping signals from the quantitative model, open a short position of about 30% with an initial stop-loss. Close the position for profit near important support levels combined with model signals. Plan B (Light Long at Strong Support): If the price falls back after testing the $65,700–$67,300 resistance and shows signs of stabilization above the previous low of $57,820, combined with quantitative model bottom signals, open a long position of about 30% with an initial stop-loss. Close the position for profit near important resistance levels combined with model signals.

QWhat was the profit percentage and main rationale for the Bitcoin short-term long trade conducted last week, as detailed in the trade review?

ALast week's Bitcoin short-term long trade achieved a profit of approximately 3.45%. The main rationale for opening the long position at $62,376 was: price stabilization above $61,000 forming a 'bottoming' candlestick pattern, a kinetic energy bottom divergence signal from the 'Dynamic Quantitative Model', and a strong bottom warning signal (white + red dots) from the 'Spread Trading Model' where the signal band broke above the baseline, indicating a potential rebound.

QWhat is the overall medium-term market structure view for Bitcoin based on the 'Position Monitoring Model' shown in Figure 3?

AAccording to the Position Monitoring Model (Figure 3), Bitcoin's price has effectively broken below the 'Bull-Bear Channel', confirming that the market structure has shifted to a bear-dominated pattern. Therefore, the medium-term view maintains a bearish-dominant mindset. A medium-term short position of about 20% is currently held, with consideration to increase it to within 50% if the price rebounds to the $65,700–$67,300 zone and shows signs of stagnation combined with proprietary quantitative model top signals.

Related Reads

The Verdict in Choi Tae-won's Divorce Case: Revealing the Inheritance Undercurrent Behind SK Hynix's Trillion-Won Empire

SK Group Chairman Chey Tae-won's high-profile divorce case, involving a record 1.38 trillion won settlement, has drawn attention to the succession plans for Korea's second-largest conglomerate, especially its crown jewel, SK hynix. Unlike traditional chaebol scripts centered on the eldest son, Chey's three children from his marriage to former President Roh Tae-woo's daughter, Roh Soh-yeong, are carving distinct, non-traditional paths. Eldest daughter Chey Yun-jung (b. 1989) is seen as the most evident successor. With a scientific and consulting background, she holds executive roles at SK bioscience and SK Inc.'s growth support department, focusing on future strategy and biopharma. Her marriage is to an AI infrastructure entrepreneur, not a traditional business alliance. Second daughter Chey Min-jung (b. 1991) took a unique route, voluntarily serving as a South Korean naval officer, including an anti-piracy deployment. She later worked on policy and strategy for SK hynix in Washington D.C. before co-founding an AI-driven healthcare startup. She married a former U.S. Marine Corps officer, connecting her to U.S. defense and policy circles—networks crucial for a global semiconductor giant. The only son, Chey In-geun (b. 1995), who studied physics like his father, worked briefly at SK E&S before joining McKinsey. Despite fitting the traditional "heir" profile as the eldest son, he remains silent and holds no public position or shares in SK, suggesting the old succession playbook is obsolete. As SK hynix's valuation soars, becoming a geopolitical asset in the AI era, the heirs' legitimacy is no longer automatic. They must prove themselves in fields like AI biotech, global policy, and strategic consulting. Their marriages also reflect new elite networks in tech and defense, not old political alliances. Their inheritance is the complex challenge of navigating a globalized, tech-driven world, not just a corporate throne.

marsbitYesterday 09:06

The Verdict in Choi Tae-won's Divorce Case: Revealing the Inheritance Undercurrent Behind SK Hynix's Trillion-Won Empire

marsbitYesterday 09:06

From OpenSea to OpenRouter: Is Alex Atallah Repeating His 'Exit at the Peak' Playbook?

From OpenSea to OpenRouter: Is Alex Atallah Repeating His "Exit at the Peak" Playbook? According to the Wall Street Journal, payments giant Stripe is in talks to acquire the AI model aggregation platform OpenRouter in a potential deal valuing the company near $100 billion. This would mark founder Alex Atallah's second creation of a company reaching a $100 billion valuation, following his co-founding of NFT marketplace OpenSea. OpenRouter, founded just over three years ago, has grown rapidly by acting as a unified gateway for developers to access over 400 AI models. It currently has about 10 million users and processes over 200 trillion tokens monthly. While the platform's annualized revenue is around $50 million, its valuation has skyrocketed from $1.3 billion in March 2026. The potential acquisition by Stripe, a company OpenRouter's founder once likened it to, represents a major expansion into AI infrastructure for the payments leader. This move echoes Atallah's previous timing with OpenSea, where he departed before the NFT market's significant downturn. For OpenRouter, selling now may be strategic. Despite its scale, its business model—charging a 5-5.5% fee on AI inference calls—faces pressure from competition, open-source models, and potential price wars among model providers, limiting its profitability narrative for an IPO. A key asset for potential acquirers like Stripe is OpenRouter's vast repository of real-world AI usage data, which offers unique insights into model performance and developer preferences that are difficult to replicate. Whether this potential deal signifies a new valuation benchmark for AI infrastructure or another market peak signal remains to be seen.

链捕手Yesterday 08:42

From OpenSea to OpenRouter: Is Alex Atallah Repeating His 'Exit at the Peak' Playbook?

链捕手Yesterday 08:42

Trading

Spot

Hot Articles

How to Buy HYPE

Welcome to HTX.com! We've made purchasing Hyperliquid (HYPE) simple and convenient. Follow our step-by-step guide to embark on your crypto journey.Step 1: Create Your HTX AccountUse your email or phone number to sign up for a free account on HTX. Experience a hassle-free registration journey and unlock all features.Get My AccountStep 2: Go to Buy Crypto and Choose Your Payment MethodCredit/Debit Card: Use your Visa or Mastercard to buy Hyperliquid (HYPE) instantly.Balance: Use funds from your HTX account balance to trade seamlessly.Third Parties: We've added popular payment methods such as Google Pay and Apple Pay to enhance convenience.P2P: Trade directly with other users on HTX.Over-the-Counter (OTC): We offer tailor-made services and competitive exchange rates for traders.Step 3: Store Your Hyperliquid (HYPE)After purchasing your Hyperliquid (HYPE), store it in your HTX account. Alternatively, you can send it elsewhere via blockchain transfer or use it to trade other cryptocurrencies.Step 4: Trade Hyperliquid (HYPE)Easily trade Hyperliquid (HYPE) on HTX's spot market. Simply access your account, select your trading pair, execute your trades, and monitor in real-time. We offer a user-friendly experience for both beginners and seasoned traders.

4.6k Total ViewsPublished 2024.03.29Updated 2026.06.02

How to Buy HYPE

Discussions

Welcome to the HTX Community. Here, you can stay informed about the latest platform developments and gain access to professional market insights. Users' opinions on the price of HYPE (HYPE) are presented below.

活动图片