Author: Brian Merchant
Compiled and Edited by: BitpushNews
The data center protest movement has swept across the United States. From Vermont to Oklahoma, from Indiana to California, communities are organizing to halt the tech industry's rapid expansion of data centers on their doorsteps. This week, the New York state legislature passed a one-year moratorium on data center construction, which is now on the governor's desk awaiting signature. The governor of Chicago, Illinois, has also suspended tax incentives for data centers. Few issues have generated such political intensity or unity; the rare bipartisan consensus emerging in the U.S. for 2026 is contempt for data centers and hostility towards artificial intelligence (AI).
This article brings an exclusive report from a data scientist who, through deep data analysis, precisely examines who is blocking data center construction and how successful these protests actually are.
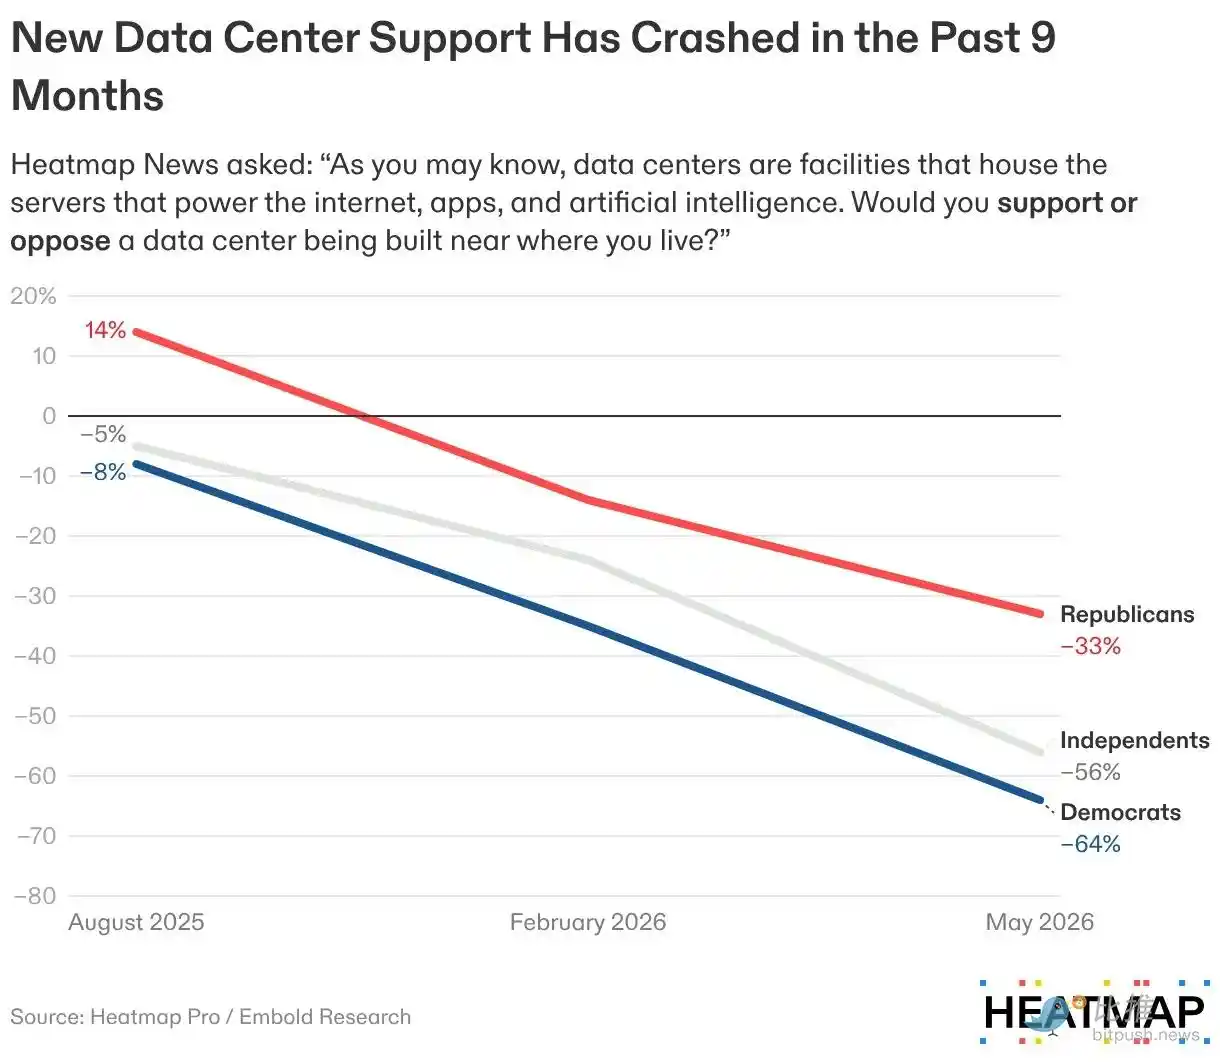
If you think I'm exaggerating, consider a recent survey released by Heatmap. It polled over 4,000 Americans on their attitudes towards data centers and whether they support building such projects near their homes.
The results show public negativity towards data centers has become utterly irreversible. The poll reveals that 55% of Americans "strongly" oppose building a data center in their area. This is a "record low, revealing a stunning shift in public opinion towards the facilities underpinning the AI boom."
Demographics of Opposition
Democrats, rural residents, and young people express particularly strong opposition: among respondents aged 18 to 35, a striking 80% oppose data centers. (This aligns perfectly with current overall trends; other polls and countless anecdotes have long confirmed that Generation Z holds deep-seated animosity towards AI. Just listen to the chorus of boos that erupted during pro-AI commencement speeches this summer.)
However, as readers well know, there has been debate and skepticism about the driving forces and nature of this growing resistance movement.
Some have argued with conviction that opposition to data centers is simply conservative "NIMBYism" (Not In My Backyard), led by affluent environmentalists in Patagonia vests. While the sheer number of data center opponents shown in the Heatmap survey suggests otherwise, that poll didn't specifically test for these class factors.
If you want to counter this narrative—as I, along with Astra Taylor and Saul Levin, have argued, positing that the data center opposition is actually rooted in working-class politics—then having solid data is crucial. That's where data scientists come in. After I published a report on the "Data Center Rebellion" (which relied on my firsthand interviews and a review of national news), researcher Geoff Holtzman contacted me to share his quantitative analysis of the movement, specifically focusing on who is actually protesting.
Holtzman describes himself as "a philosopher and data scientist who writes about quantitative rhetoric and scientism," often publishing in his Science & Power newsletter. His peer-reviewed work has appeared in journals like the Proceedings of the National Academy of Sciences (PNAS) and the American Journal of Bioethics. He too had heard the widespread claim that data center protests are led by wealthy NIMBYs, so he decided to investigate. He cross-referenced a dataset of current and proposed data center projects with U.S. Census data (see Note 1) and agreed to share his findings exclusively here. He arrived at at least three stark conclusions.
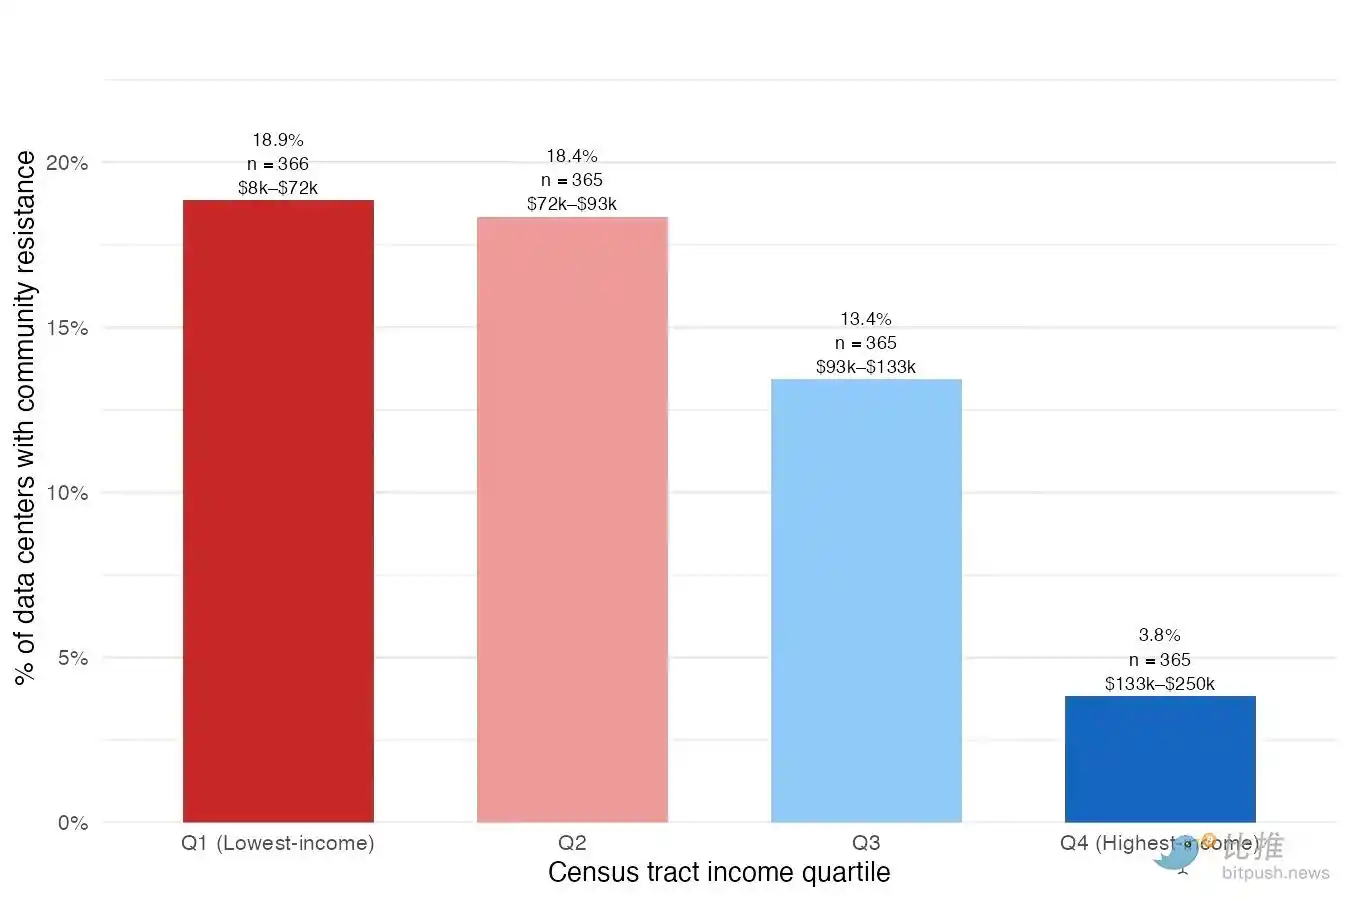
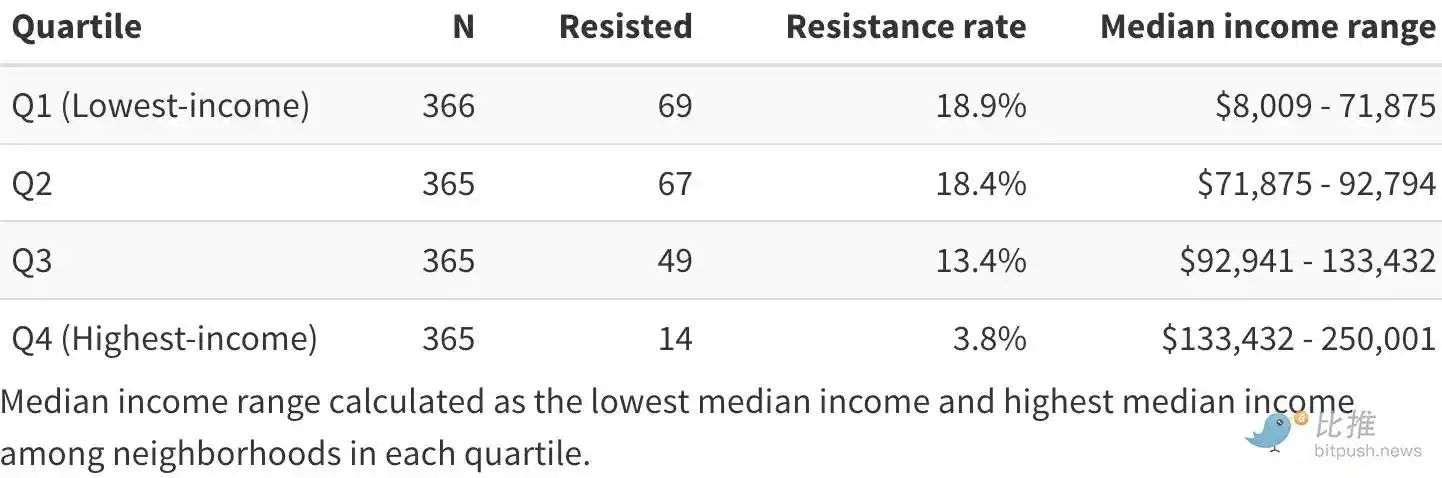
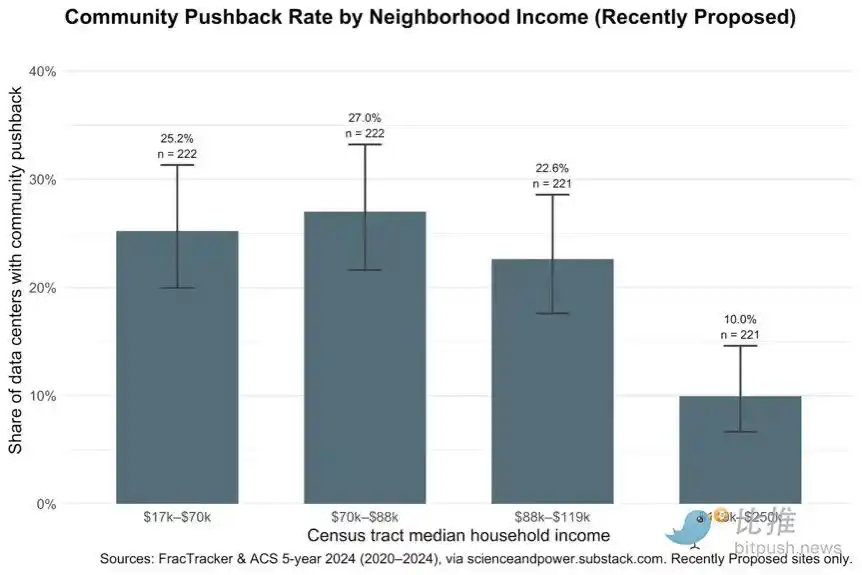
1. The poorest communities protest data centers at almost five times the rate of the highest-asset communities (19.0% vs. 3.8%).
(Chart note: These quartiles are calculated only for census tracts in the data center dataset, not nationwide quartiles.)
"The most frequent protests come from communities with median household incomes between $8,000 and $72,000," Holtzman notes. "Meanwhile, the communities with the lowest protest rates have average household incomes between $133,000 and $250,000."
This directly punctures the political myth that data center opposition is led by comfortable, Patagonia-clad upper-middle-class activists; protests occur far more frequently in poor or blue-collar communities than in affluent ones.
As Holtzman puts it: "Putting aside all moral or justice questions, from a purely pragmatic standpoint, tech companies would find it much easier to build compute centers in higher-income areas."
He adds: "Among low-income, low-education communities facing project proposals, it's the communities with the lowest income and least education that fight back the hardest." Meanwhile:
High-education, high-income communities show remarkably little protest. As for the possible role of homeownership rates, we're not talking about old money resisting affordable housing—we're talking precisely about the people who might be living in that affordable housing.
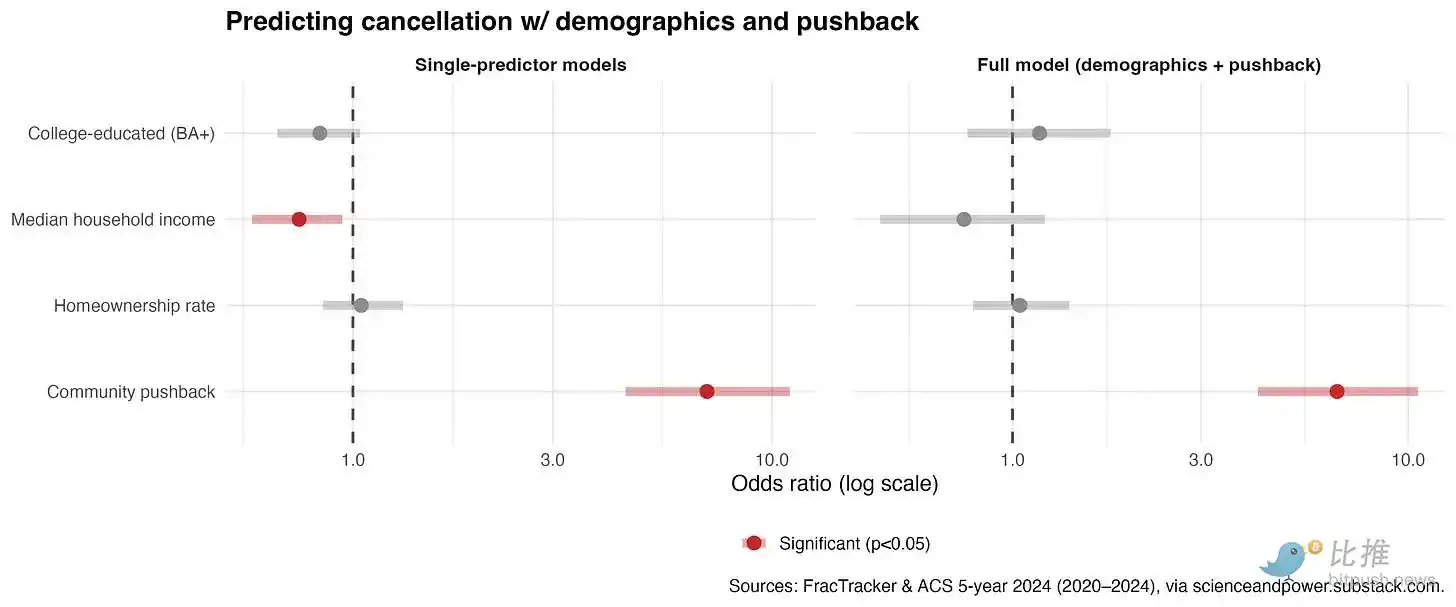
Furthermore, Holtzman's data confirms that the data center rebellion is working. We've seen numerous headlines about developments being canceled or scaled back—just this week, under immense public pressure, Ken O'Leary's massive Utah project was halved by the state's governor. Other projects have been canceled outright.
According to Holtzman's analysis:
2. Recently proposed data centers that faced protest were over five times more likely to be canceled or paused than those that didn't (28.2% vs. 5.2%).
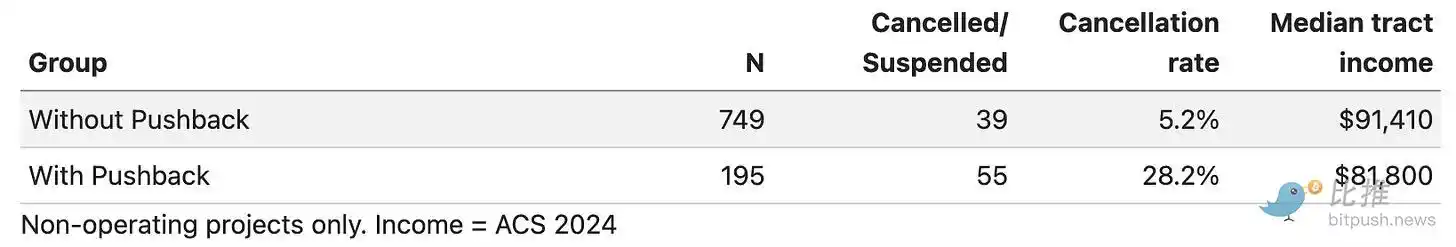
This is a startling figure. When a newly proposed data center project faces community resistance, nearly one-third end up being canceled, paused, or shut down. This is a remarkably high success rate, offering further inspiration for data center opposition organizers weighing whether to launch new campaigns.
Finally, combining insights from the first two points, Holtzman found:
3. The higher cancellation rates in low-income areas can be entirely explained by their higher protest rates.
"In communities that rise up, projects are six times more likely to be canceled than in communities that acquiesce," Holtzman points out. He adds: "The increase in cancellation rates in low-income areas is entirely due to the high protest rates in these communities. Therefore, continuing to push project proposals in these areas may incite more public anger, trigger stronger resistance, and further increase cancellation rates."
I hope this data helps shatter the condescending prejudice that the data center resistance movement is led by affluent NIMBYs. In reality, the vast majority of those standing up are working-class residents and communities. I also hope these findings serve as a powerful tool for cities, residents, and organizers grappling with data center development.
My sincere thanks again to Geoff Holtzman for allowing me to publish these research findings on the blog. For those interested in studying or further testing his data, he has hosted the entire code repository on GitHub.
The U.S. Becomes the Most Resistant Nation to New Data Centers Overall
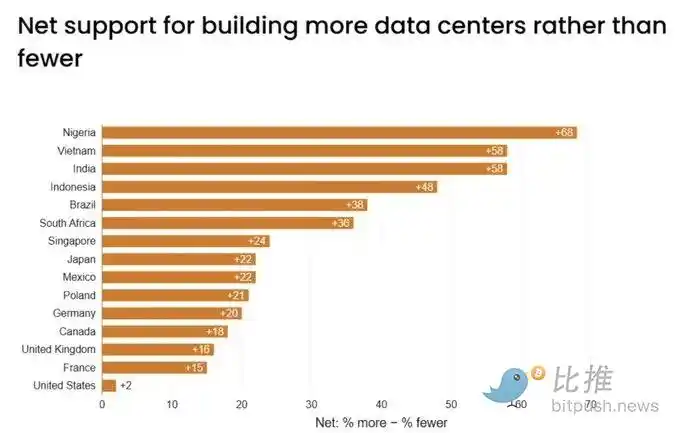
Data from research firm Public First (shared by WIRED reporter Molly Taft): How did the U.S., the epicenter of the AI boom, become its own stumbling block? Our survey offers several explanations.
–Informed Opposition
The public now understands better than before what AI is, what it does, and what data centers are and do. When we conducted AI surveys 5 years ago, it was at best a niche interest. Now we see a clear growth in public awareness and understanding, and more sophisticated use of the tools, especially among the 25-44 age group. Our analysis of who understands AI needs to shift from "who has opened a large language model" to "who uses large language models in complex, integrated ways."
Our survey shows the U.S. is middling in terms of self-reported understanding of data centers, higher than other "developed" markets. This is unsurprising given the prevalence of data center construction in the U.S.
And this "informed opposition" makes it more averse to data centers than any other country surveyed. Interesting!
Note 1:
According to Holtzman: I used 5-year American Community Survey data from 2020-2024, so income figures are generally a bit lower than you might expect. I needed to do this to get data at the census tract level; therefore, for national medians, I stuck with the same dataset.