Chiliz gains over 10% in 24 hours, but $0.04 is still far away – Here’s why

ambcryptoPublished on 2026-03-29Last updated on 2026-03-29

Abstract

Chiliz (CHZ) surged 10.6% in the past 24 hours, accompanied by a 160% spike in trading volume. This rally, occurring on a typically subdued trading day, suggests a potential strong uptrend. Despite the recent gains, CHZ has yet to reclaim the $0.04 level, a key local resistance. The price action since the start of the year has been structurally bullish, with a retracement to the $0.035 support—coinciding with the 78.6% Fibonacci level—now showing renewed buying interest. Key indicators like the RSI and OBV have improved, but the $0.043–$0.045 zone remains a significant barrier. Traders are advised to avoid FOMO; instead, consider taking profits near resistance or waiting for a pullback to the $0.034–$0.036 support range for long entries.

Chiliz [CHZ] has rallied 10.6% in the past 24 hours and saw its daily trading volume soar by 160%.

The high-volume price surge on the 29th of March, when volume and price moves are usually subdued, indicated a possibility of a strong uptrend for the upcoming week.

Source: CHZ/USDT on TradingView

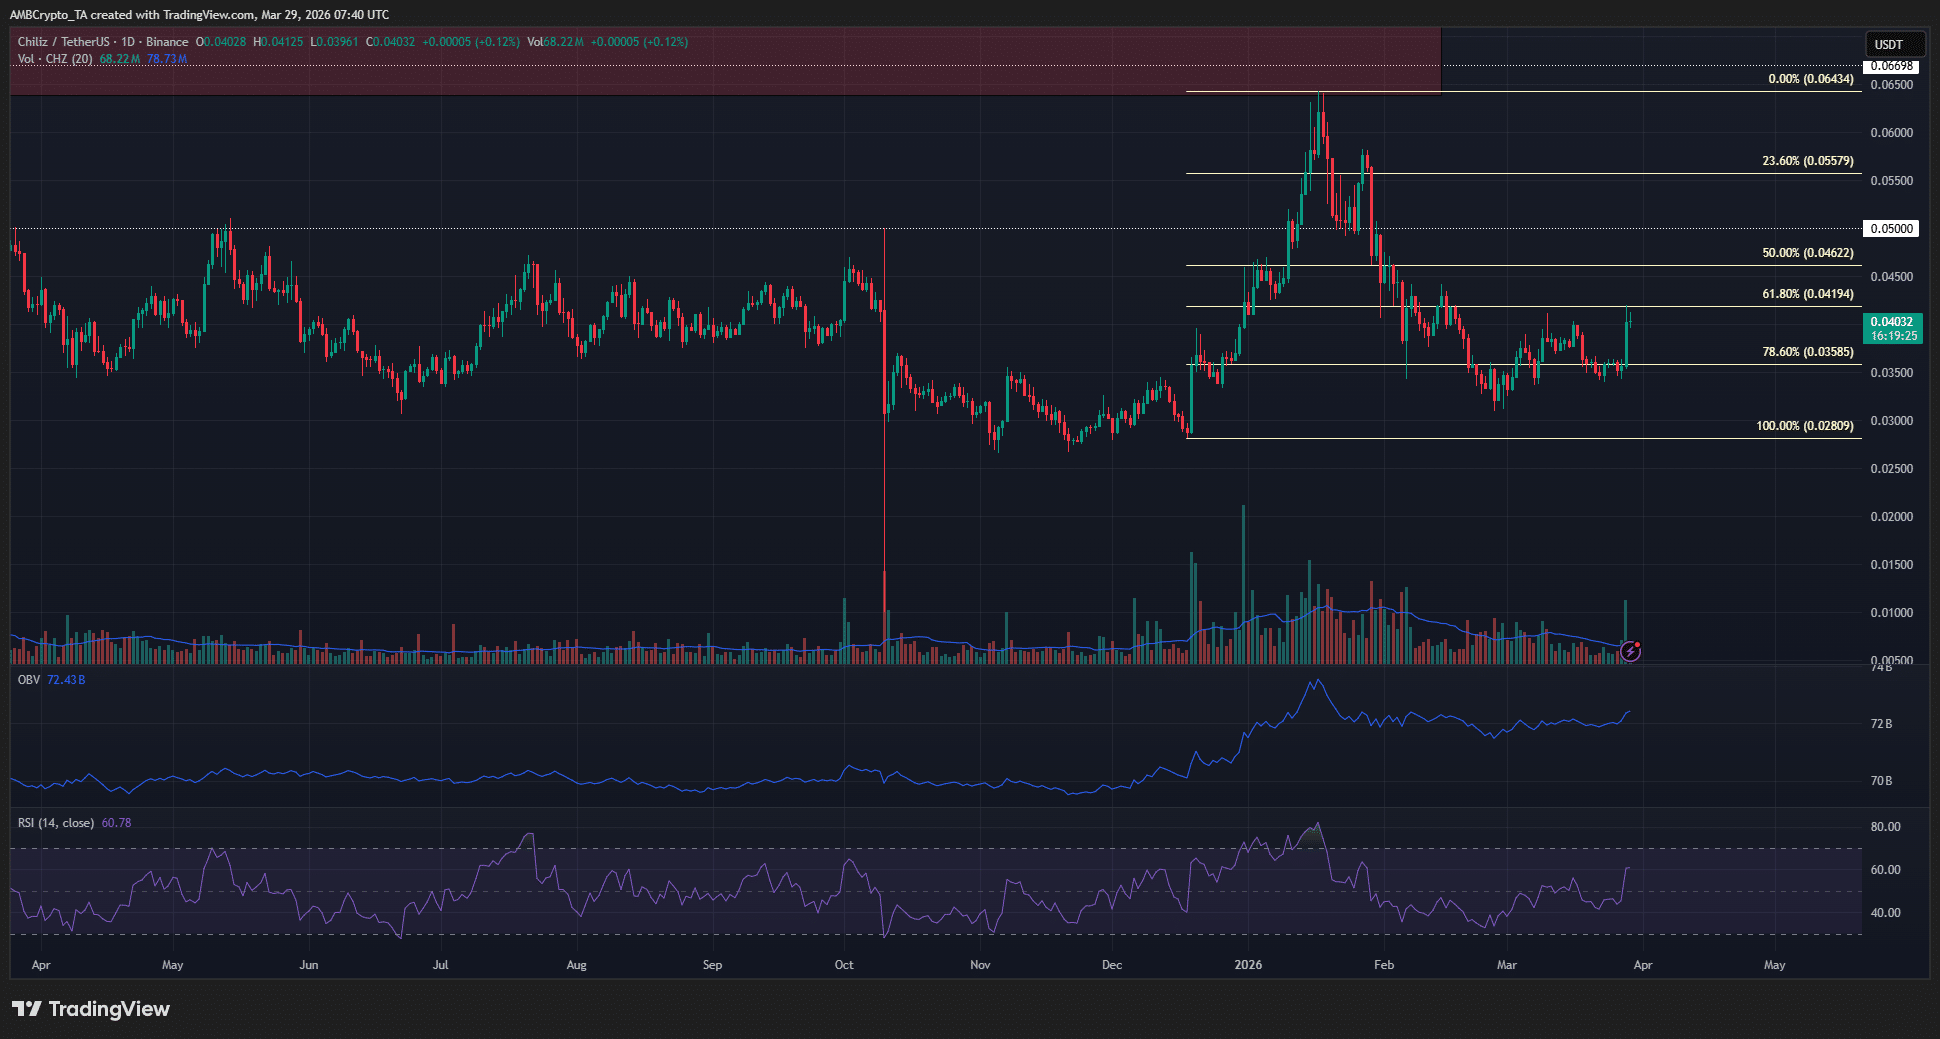
On the 1-day chart, the structure that CHZ exhibited since the start of the year was quite encouraging. After a rally to the long-term supply zone at $0.055-$0.065, CHZ has retraced to the $0.035 level.

This was the 78.6% Fibonacci retracement level based on the impulse move earlier this year. The retest of this crucial support did not yield an immediate, bullish response.

The buyers have, over time, forced prices higher once again.

The OBV was ticking higher over the past month, but there was a worry here. The trading volume has been below the 20-day average for the most part. Meanwhile, the RSI had not established itself above neutral 50 over the past six weeks, either.

This has changed in the past 24 hours. The RSI reached 60, and the volume surge saw a healthy uptick on the OBV.

If sustained, CHZ could become one of the outperforming assets as it recovers toward the $0.065 swing high. With extremely pessimistic sentiment around Bitcoin [BTC] and fearful macroeconomic conditions, it remains to be seen if Chiliz can do well.

Traders’ call to action – Do not FOMO into this rally

Source: CHZ/USDT on TradingView

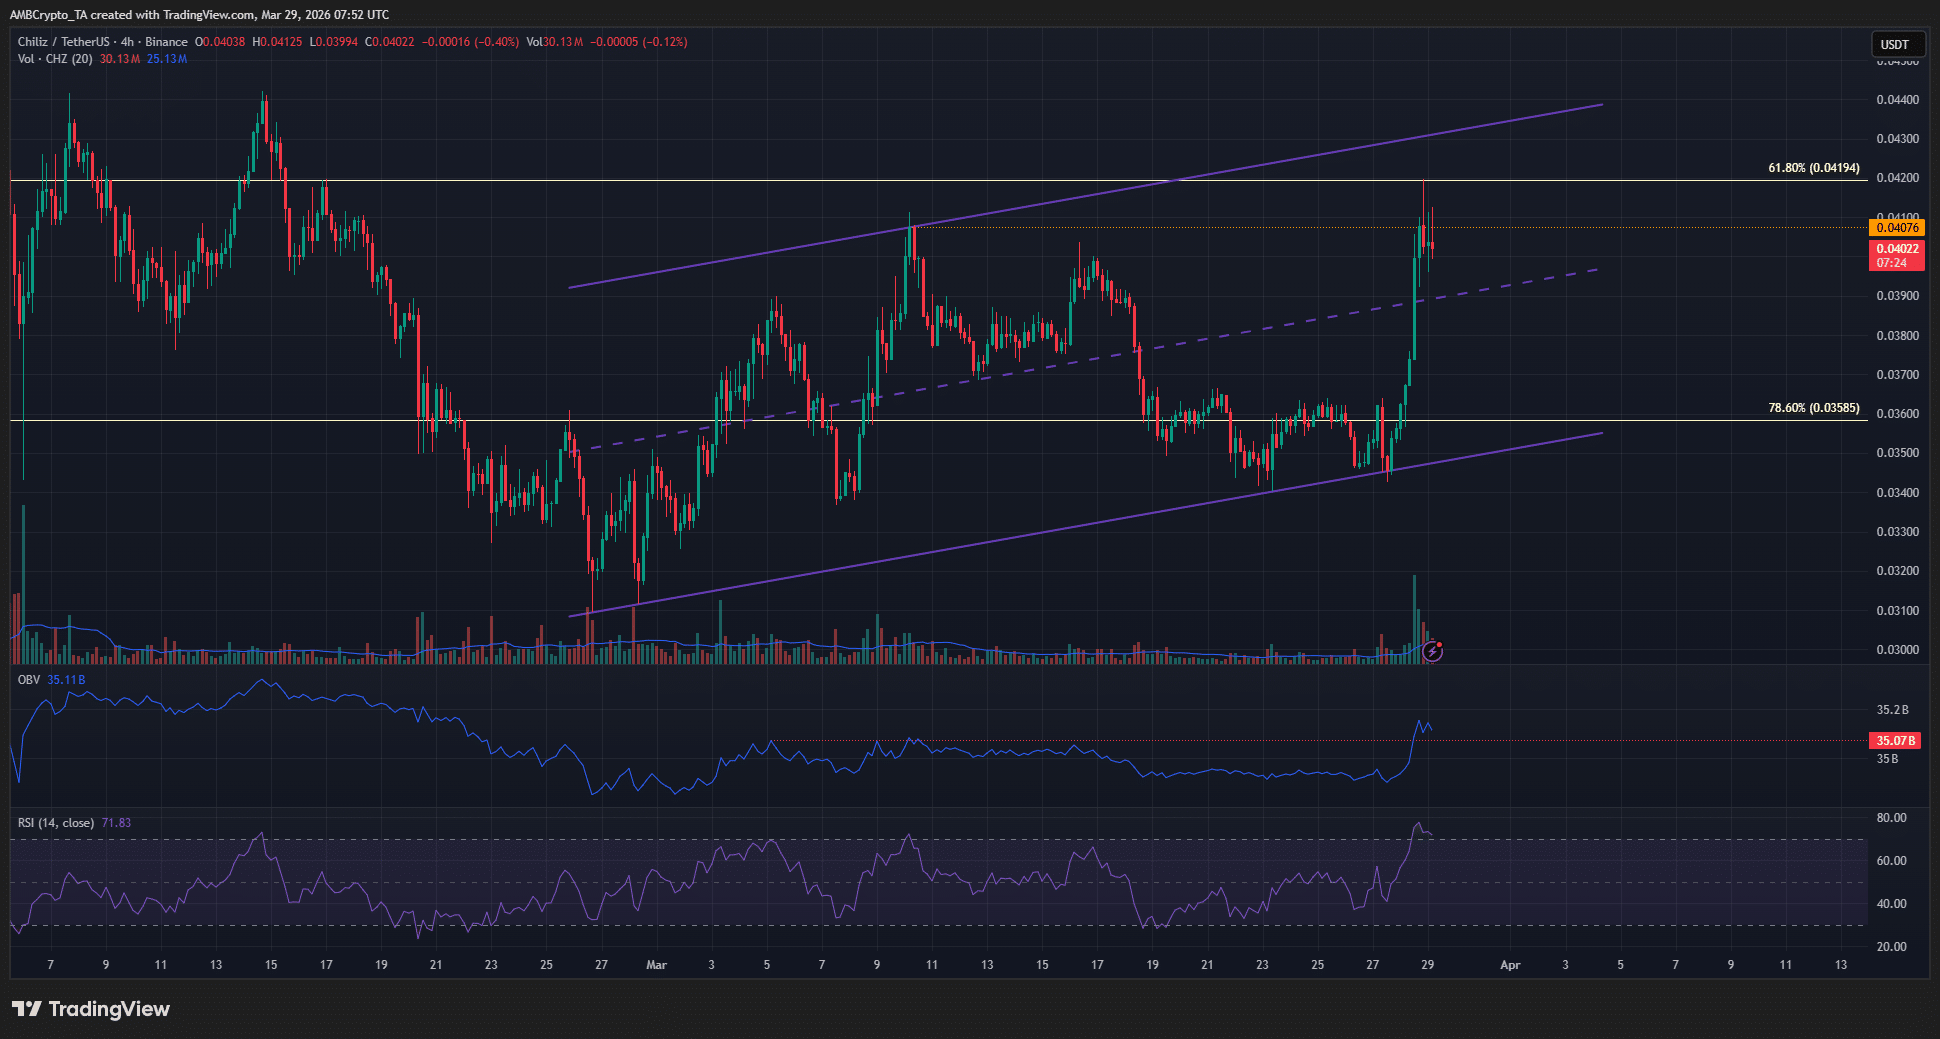
Despite the swift gains in the past 24 hours, CHZ bulls were unable to reclaim the $0.04 local high set earlier in March. The OBV has climbed past local highs, and the RSI has reached overbought territory, despite the rejection.

A rising channel (purple) has formed, and its highs were in the $0.043-$0.045 area. Therefore, this channel high would oppose the altcoin’s rally if CHZ can climb past $0.04.

Swing traders already in long positions can look to take profits. Those who missed the move can wait for a retracement to $0.034-$0.036 before looking to go long.


Final Summary

  • CHZ’s rally in the past 24 hours reinforced the long-term bullish structure of the altcoin.
  • In the coming days, the $0.04 and the $0.043-$0.045 would likely halt any further price rally. If breached and retested, it could be a buying opportunity.

Trending Cryptos

Related Questions

QWhat was the percentage gain and increase in trading volume for Chiliz (CHZ) in the past 24 hours?

AChiliz (CHZ) gained 10.6% in the past 24 hours and saw its daily trading volume soar by 160%.

QWhat crucial Fibonacci retracement level did CHZ retest, and what was the price area of this support?

ACHZ retested the 78.6% Fibonacci retracement level, which was at the $0.035 price level.

QWhat two key technical indicators showed positive changes in the past 24 hours for CHZ?

AThe RSI reached 60, indicating strong momentum, and the On-Balance Volume (OBV) saw a healthy uptick due to the volume surge.

QAccording to the article, what price levels are likely to act as resistance and halt CHZ's rally in the coming days?

AThe $0.04 level and the $0.043-$0.045 area (the high of the rising channel) are likely to act as resistance and halt any further price rally.

QWhat advice does the article give to traders who missed the recent price move and are considering a long position?

AThe article advises traders who missed the move to wait for a retracement to the $0.034-$0.036 level before looking to go long.

Related Reads

Report Interpretation: J.P. Morgan Details Micron's Pre-Earnings Sentiment, Current Hardware Sector Dynamics

Morgan Stanley analyst Joshua Meyers' report (June 21, 2026) highlights key trends in the hardware and semiconductor sector ahead of Micron's earnings. The core takeaways are: 1. **Micron & Memory:** Memory remains a high-conviction long theme, driven by strong AI demand and rising ASPs. However, investor focus is shifting to the sustainability of Micron's >80% gross margins and the specifics of potential new long-term supply agreements (SCAs). 2. **Hardware Supply Chain:** AI-related demand for servers, networking, and storage remains robust, but company performance is diverging. Celestica (CLS) shows improved margin confidence, Western Digital and Seagate benefit from pricing, Fabrinet (FN) sees predictable AI optics growth, and Teradyne (TER) anticipates a new Google customer. 3. **AI Capex & WFE Forecasts:** JPMorgan increased its Wafer Fab Equipment (WFE) market growth forecasts to 28% in 2026 and 29% in 2027. AI infrastructure financing is evolving, with higher project-level debt reducing constraints on capex expansion. The report signals that while the AI-driven hardware cycle is strong, the market is entering a phase focused on execution verification (e.g., Micron's SCA details, Fabrinet's ramp with Amazon) and valuation sustainability. Key near-term signals include Micron's guidance, Arista Networks' outlook, and the pace of demand normalization post potential tariff-related pull-ins.

marsbit3h ago

Report Interpretation: J.P. Morgan Details Micron's Pre-Earnings Sentiment, Current Hardware Sector Dynamics

marsbit3h ago

Research Report Analysis: The Fed's New Chair's Debut – New Leader, But Same Script?

Report Analysis: Federal Reserve's New Chair Debut – A New Captain, But the Same Script? Morgan Stanley's chief global economist Seth B. Carpenter analyzes the first FOMC meeting under new Fed Chair Kevin Warsh in a June 21 report. Warsh deliberately avoided providing forward guidance on interest rates, aligning with his philosophy. However, market expectations for a rate hike this year were reinforced. Key signals lie elsewhere: inflation may fall more than expected, and quantitative tightening (QT) could be more aggressive than anticipated. The FOMC's "dot plot" suggests only one rate hike in 2026. Carpenter argues that if inflation undershoots forecasts, the logic for even a single hike weakens, especially as projections indicate potential rate cuts in 2027. On QT, Warsh's stance is clear. Carpenter notes that measures like halving the Treasury's account balance could shrink the Fed's balance sheet by around $500 billion with minimal market impact. Combined with adjustments to reserve interest and liquidity rules, the ultimate QT scale may exceed expectations, though its market effect might be less disruptive unless the Fed actively sells Mortgage-Backed Securities (MBS). While Warsh initiated a review of the Fed's policy framework, the 2% inflation target remains intact for now. The report concludes that the market may be overestimating the significance of reduced forward guidance and the near-term rate hike risk, while potentially underestimating the scope and manageable nature of the coming balance sheet reduction. The key debates will hinge on upcoming core PCE data, the specifics of the QT path, and the framework review's findings.

marsbit4h ago

Research Report Analysis: The Fed's New Chair's Debut – New Leader, But Same Script?

marsbit4h ago

Critical Game Week: BTC Retracement Confirmation vs. HYPE Support Battle | Guest Analysis

This weekly analysis outlines a critical juncture for BTC and HYPE markets, focusing on key price level confirmations. **BTC Analysis:** BTC is at a pivotal point after a five-wave rally from the June 5th low of $59,100. The price has broken below a short-term rising channel's lower boundary, with the current move seen as a pullback to test this breakdown. Failure to reclaim this level could lead to a retest of the $59,000-$60,000 support zone. The core scenario hinges on this channel retest outcome. * **Key Levels:** Resistance at $64,500-$65,000 (channel boundary) and $69,500-$70,500. Support at $59,000-$60,000 and $55,000. * **Strategy:** A core bearish stance is maintained (20% short from last week), with short-term plans for tactical trades. Three detailed contingency plans (A/B/C) are provided for short positions on resistance tests or breakdowns, emphasizing strict stop-loss discipline. **HYPE Analysis:** HYPE shows strong momentum but is currently in a corrective phase after hitting a new high of $76.94. The price is retesting the crucial $64-$66 support area. * **Key Levels:** Resistance near $77 and $80-$82. Support at $64-$66 and $52-$54. * **Strategy:** The short-term approach is "buy on dips, avoid chasing rallies." A long position is considered only if clear stabilization signals appear at the $64-$66 or deeper $52-$54 support zones, with tight risk controls. **General Risk Management:** A standardized trailing stop-loss protocol is emphasized: set initial stop, breakeven at +1% profit, then trail stops upward to lock in gains. *Disclaimer: All analysis is presented as a personal trading framework, not investment advice. Market conditions are complex and require dynamic adjustment.*

marsbit4h ago

Critical Game Week: BTC Retracement Confirmation vs. HYPE Support Battle | Guest Analysis

marsbit4h ago

Trading

Spot
Futures

Hot Articles

Discussions

Welcome to the HTX Community. Here, you can stay informed about the latest platform developments and gain access to professional market insights. Users' opinions on the price of S (S) are presented below.

活动图片