Executive Summary
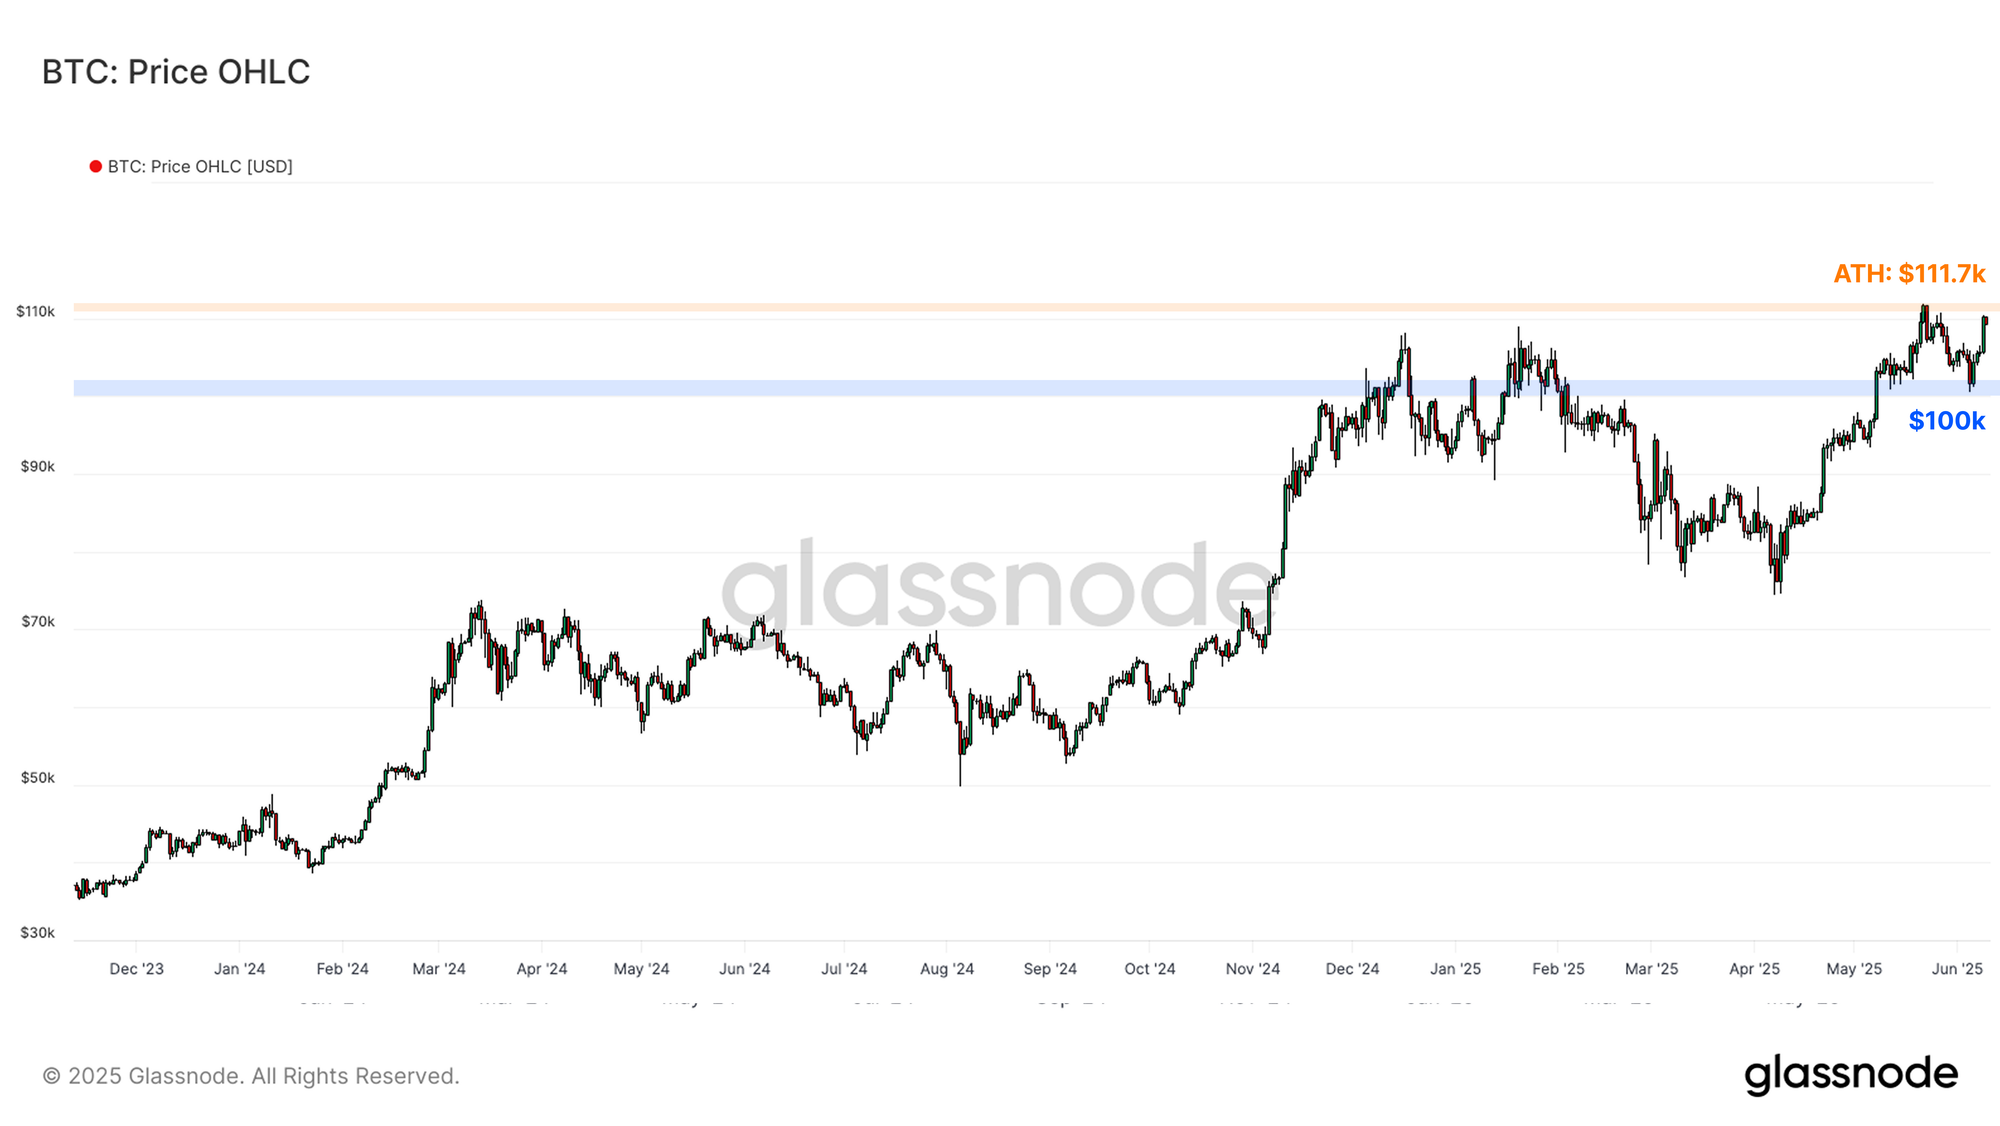
- After collapsing to the $101k level, demand has appeared to re-emerge at this level, with Bitcoin staging a marked recovery to $110.3k, now just $2.4k off of the ATH (-1.5%). Holding above the psychologically significant $100k mark suggests investor confidence remains robust.
- Elevated prices have inspired an uptick in Long-Term Holder spending, with the cohort realizing a local peak of +$930M of profit per day. However, a unique market dynamic persists where, despite elevated profit taking, maturation pressures are overwhelming spending behavior.
- Volatility expectations remain raised from the perspective of the on-chain market, with a significant cluster of coins residing within close proximity to the spot price. Additionally, options traders are pricing in a low volatility regime, suggesting that they may be underpricing the likelihood of a volatility regime shift.
- The $97.6k Short-Term Holder cost basis continues to serve as a pivotal support level necessary for maintaining local bullish momentum. On the upside, the $115.4k zone emerges as the first significant resistance should the market enter price discovery.
Assessing Damage
After reaching a new all-time high of $111K, Bitcoin encountered meaningful resistance with sell-side pressure across mature investors intensifying. This resulted in price pulling back to a local low of $101K. Nevertheless, demand has appeared to re-emerged at this level, leading to a notable recovery in market strength, with price climbing to a current value of $110.3k, just $2.4k off of the ATH (-1.5%).
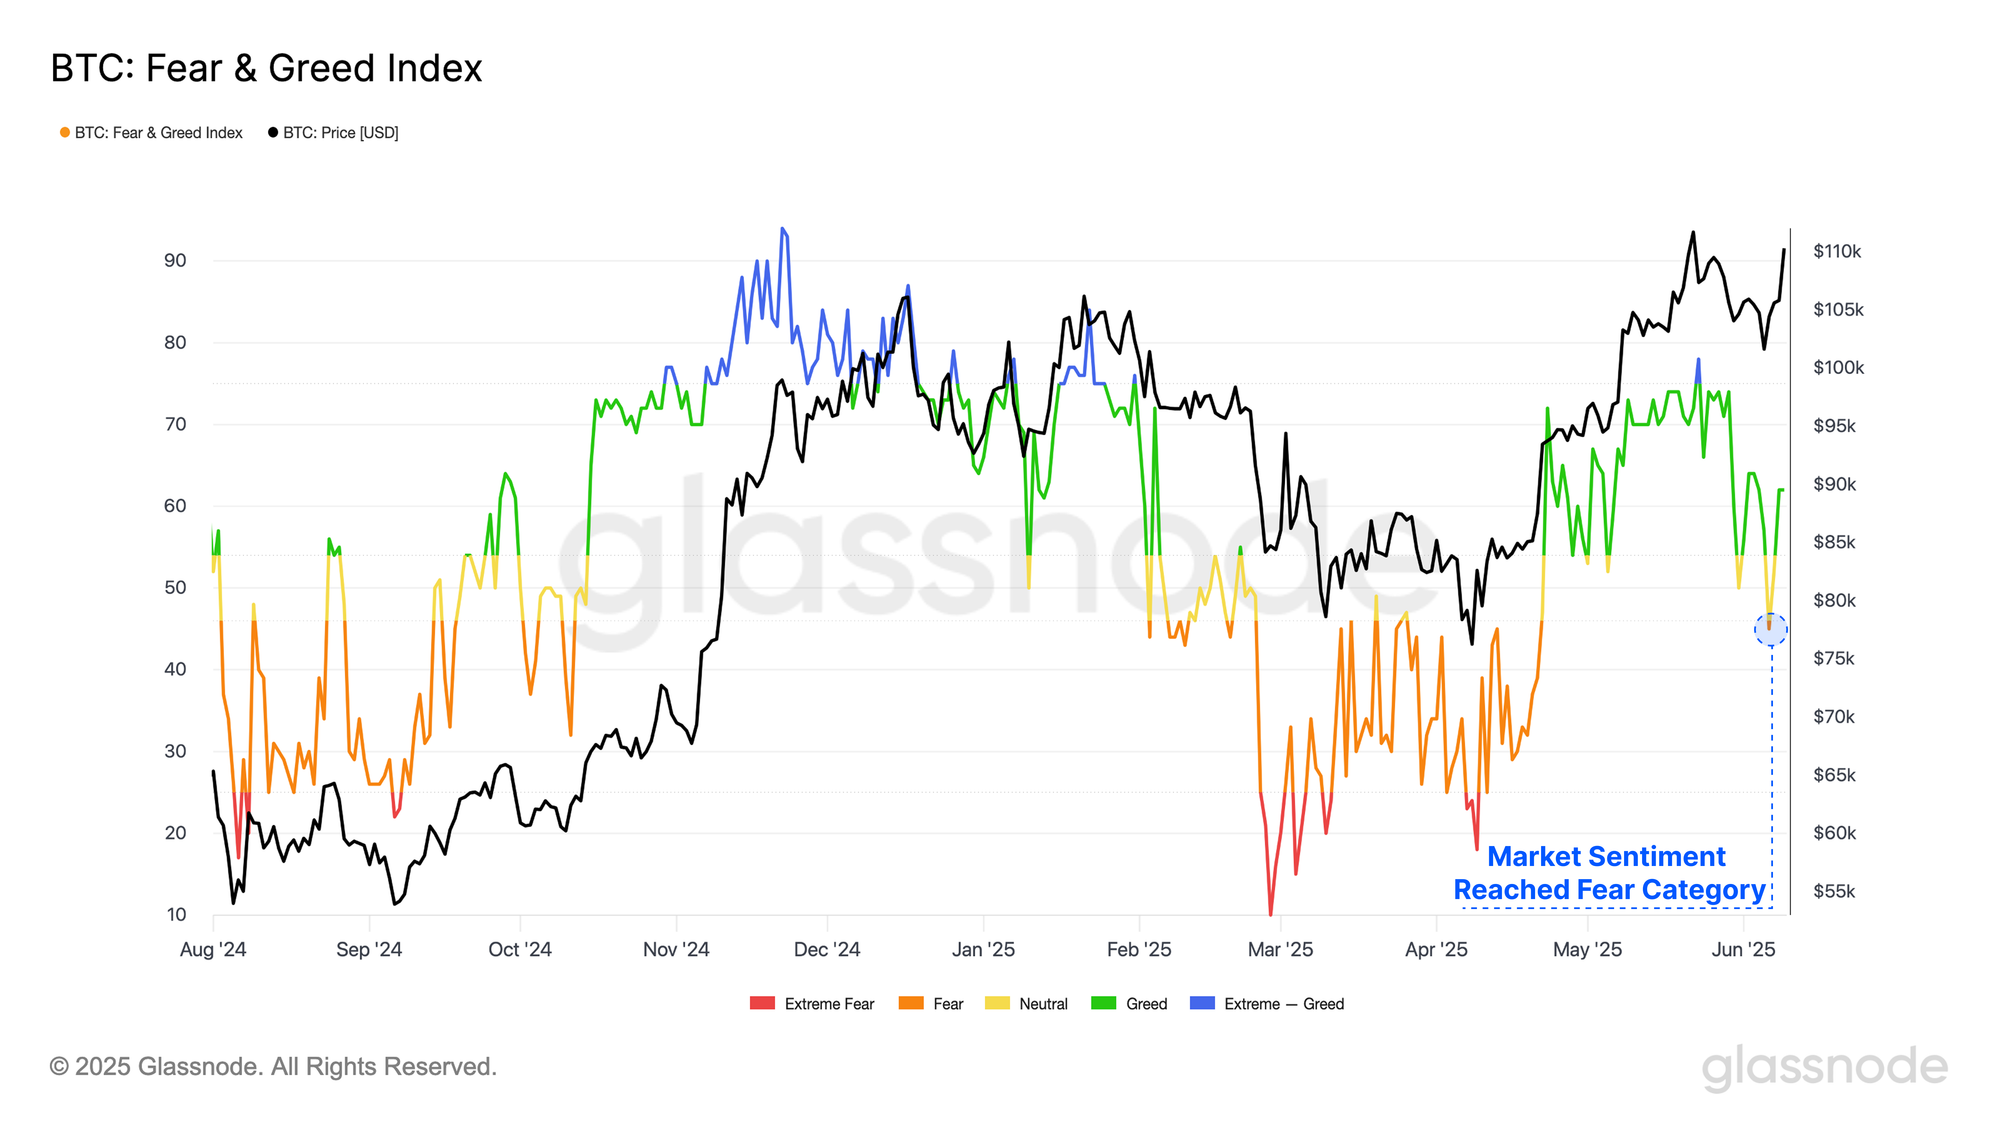
Despite the relatively shallow drawdown to $101k, sentiment across market investors took a notable hit, with the Fear and Greed Index briefly dipping into the 'Fear' category. One potential reason for this sharp shift in sentiment was investor concern over a possible double-top formation, reminiscent of the 2021 cycle.
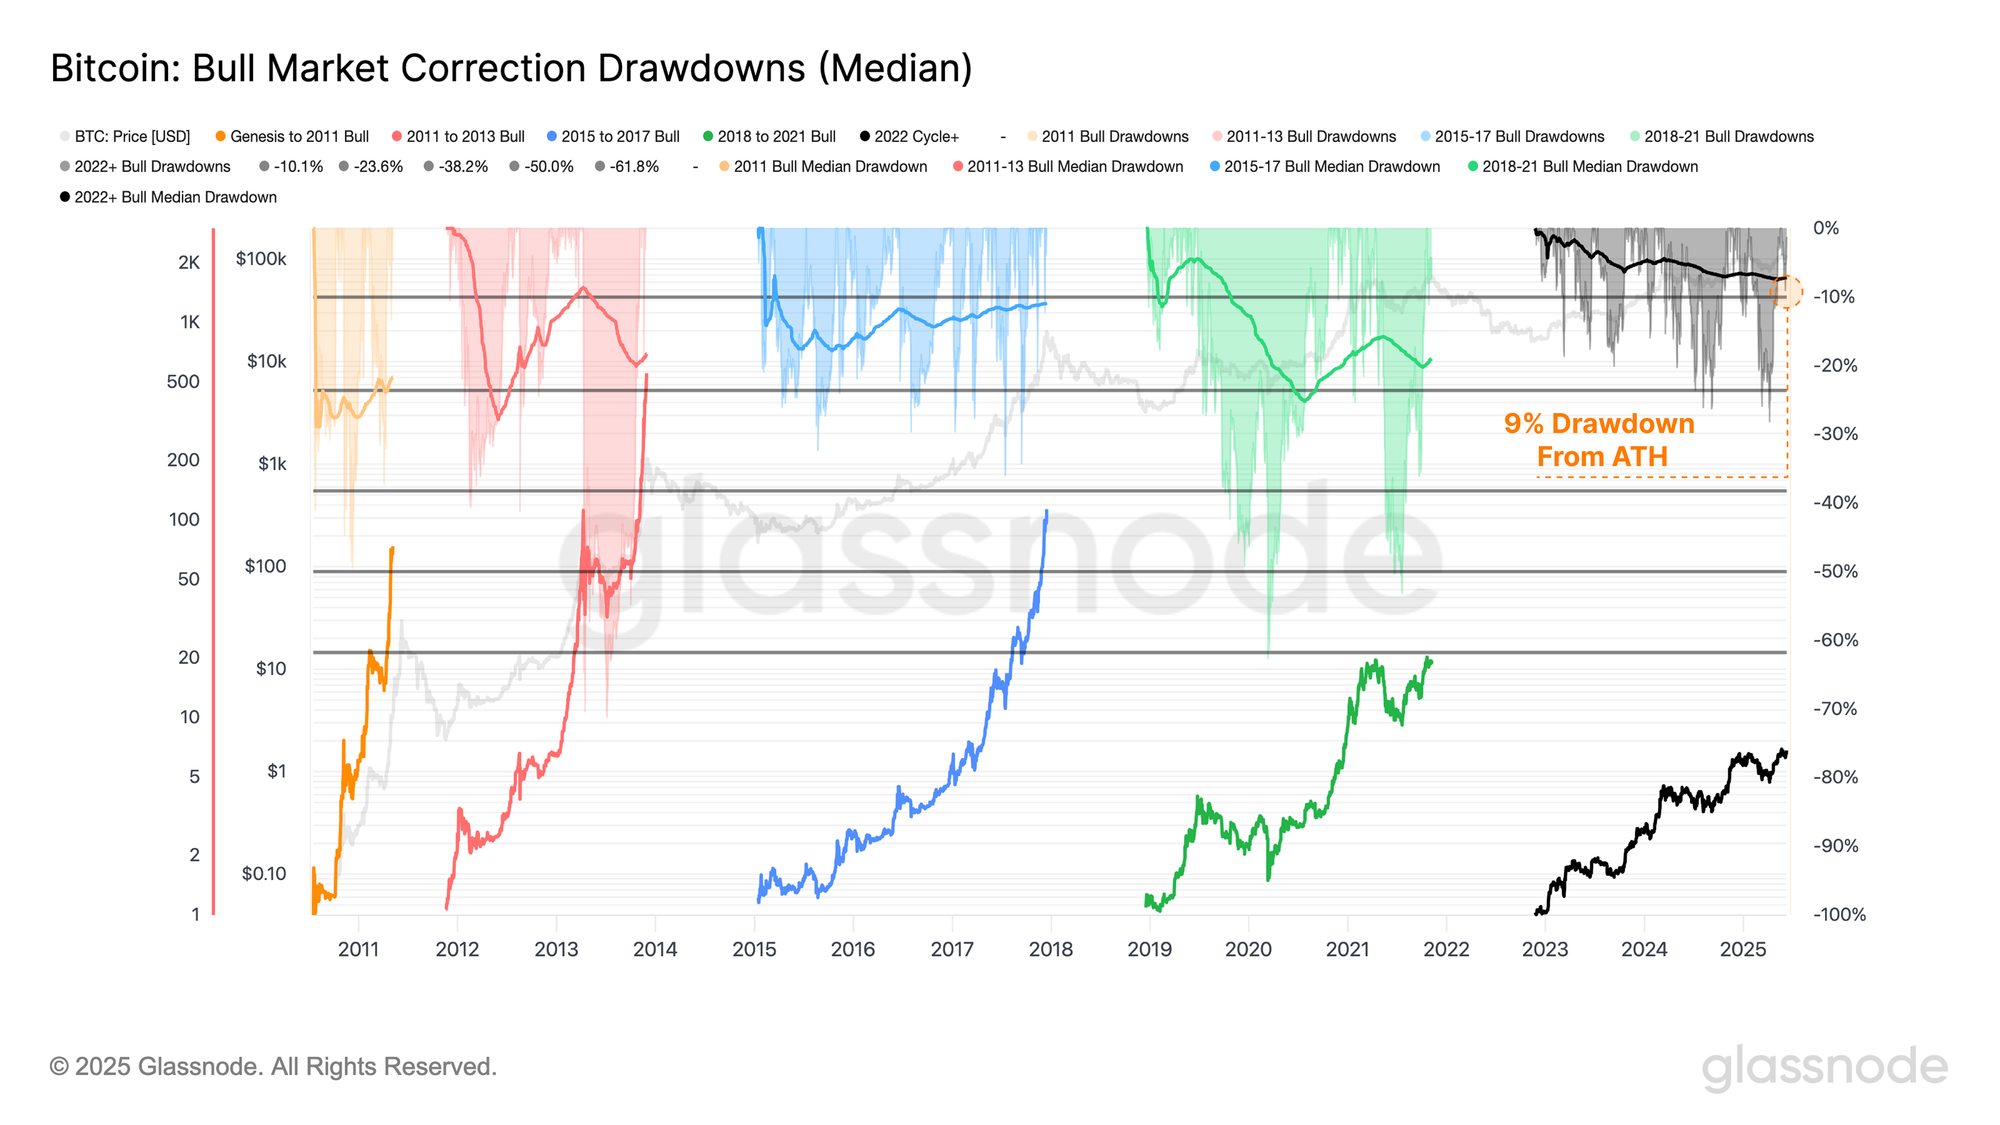
When measuring the market correction as a percentage drawdown from the ATH, the correction amounted to just -9%, with 384 out of 928 trading days (41.4%) this cycle experiencing a larger drawdown. This decline also closely aligns with the cycle’s median drawdown of 7%, indicating that, from a price perspective, the severity of the contraction was broadly consistent with typical market behavior this cycle.
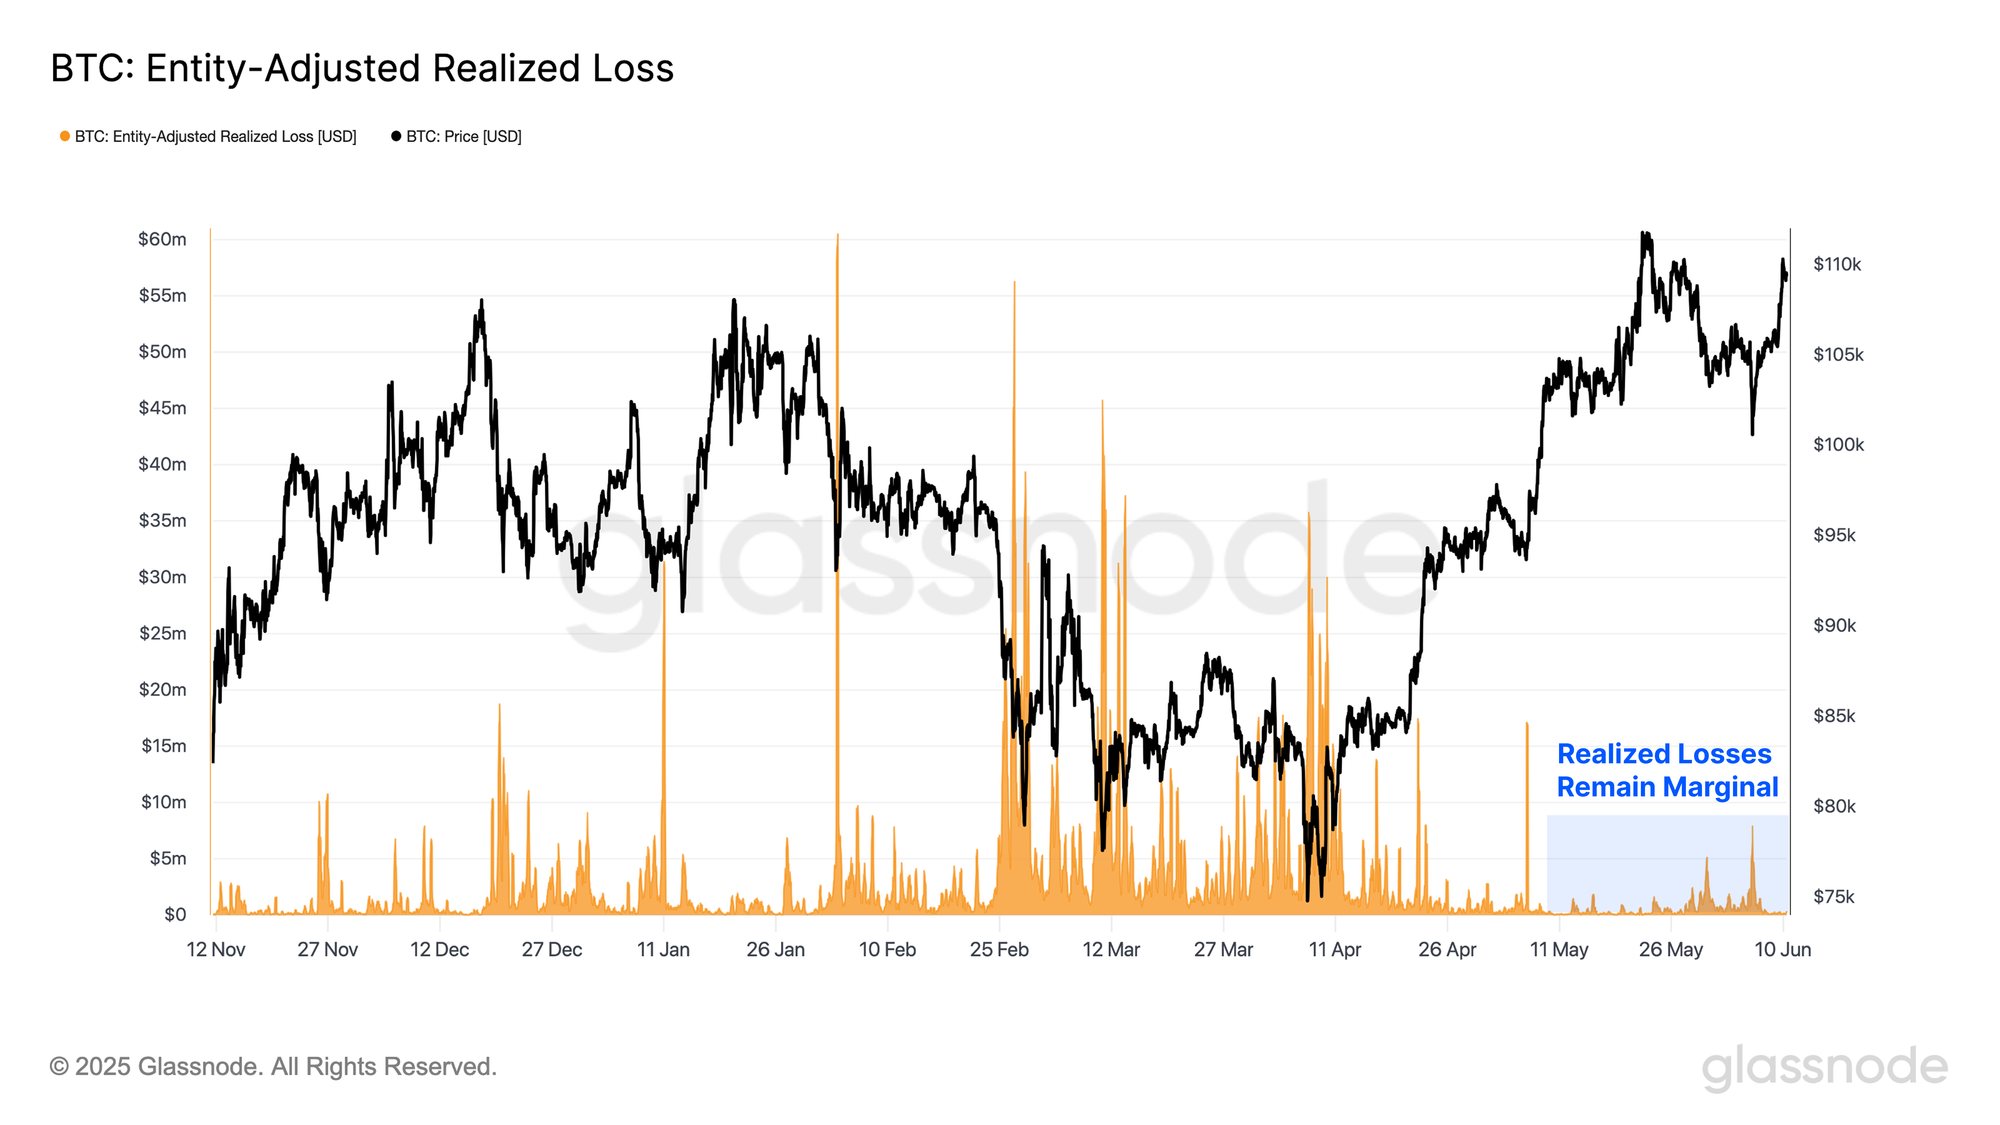
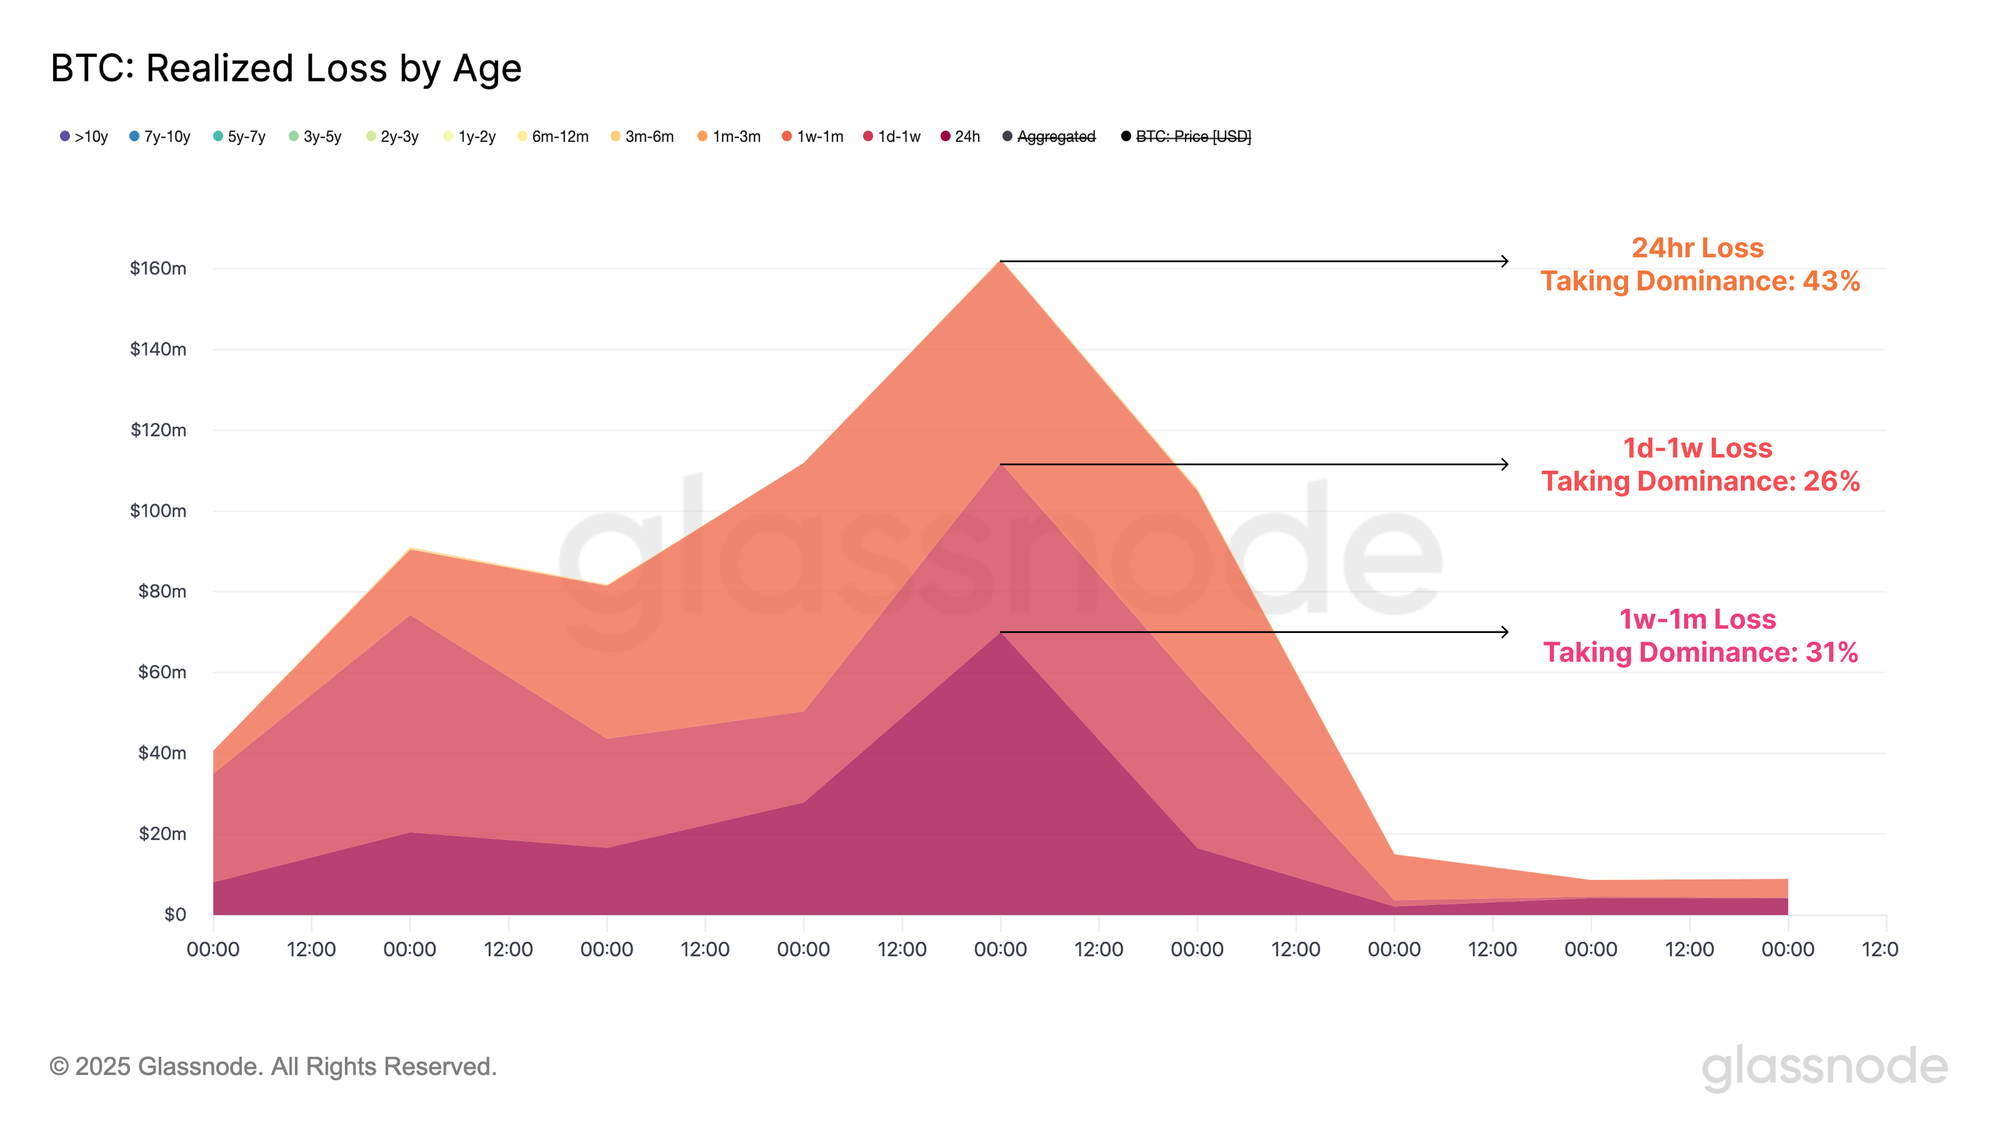
Encouragingly, the wave of fear in market sentiment did not translate into a meaningful shift in spending behavior. When assessing losses locked in on-chain, only -$200M of losses were realized, with the magnitude significantly shallower than previous correction events. This suggests that loss-taking remained contained, with investors largely unfazed by the drawdown.
Increasing granularity, when inspecting the composition of the loss taking transactions, the majority of losses originate from the front end of the Short-Term Holder curve, with only the newest of investors capitulating across the market correction.
- 24hr Loss Taking Dominance: 43%
- 1d-1w Loss Taking Dominance: 26%
- 1w-1m Loss Taking Dominance: 31%
- 1m-3m Loss Taking Dominance: 0%
- 3m-6m Loss Taking Dominance: 0%
With no losses locked in across mature investors, nearly the entirety of loss taking occurred from top buyers across the ATH formation, suggesting a capitulation of only the most speculative of investors.
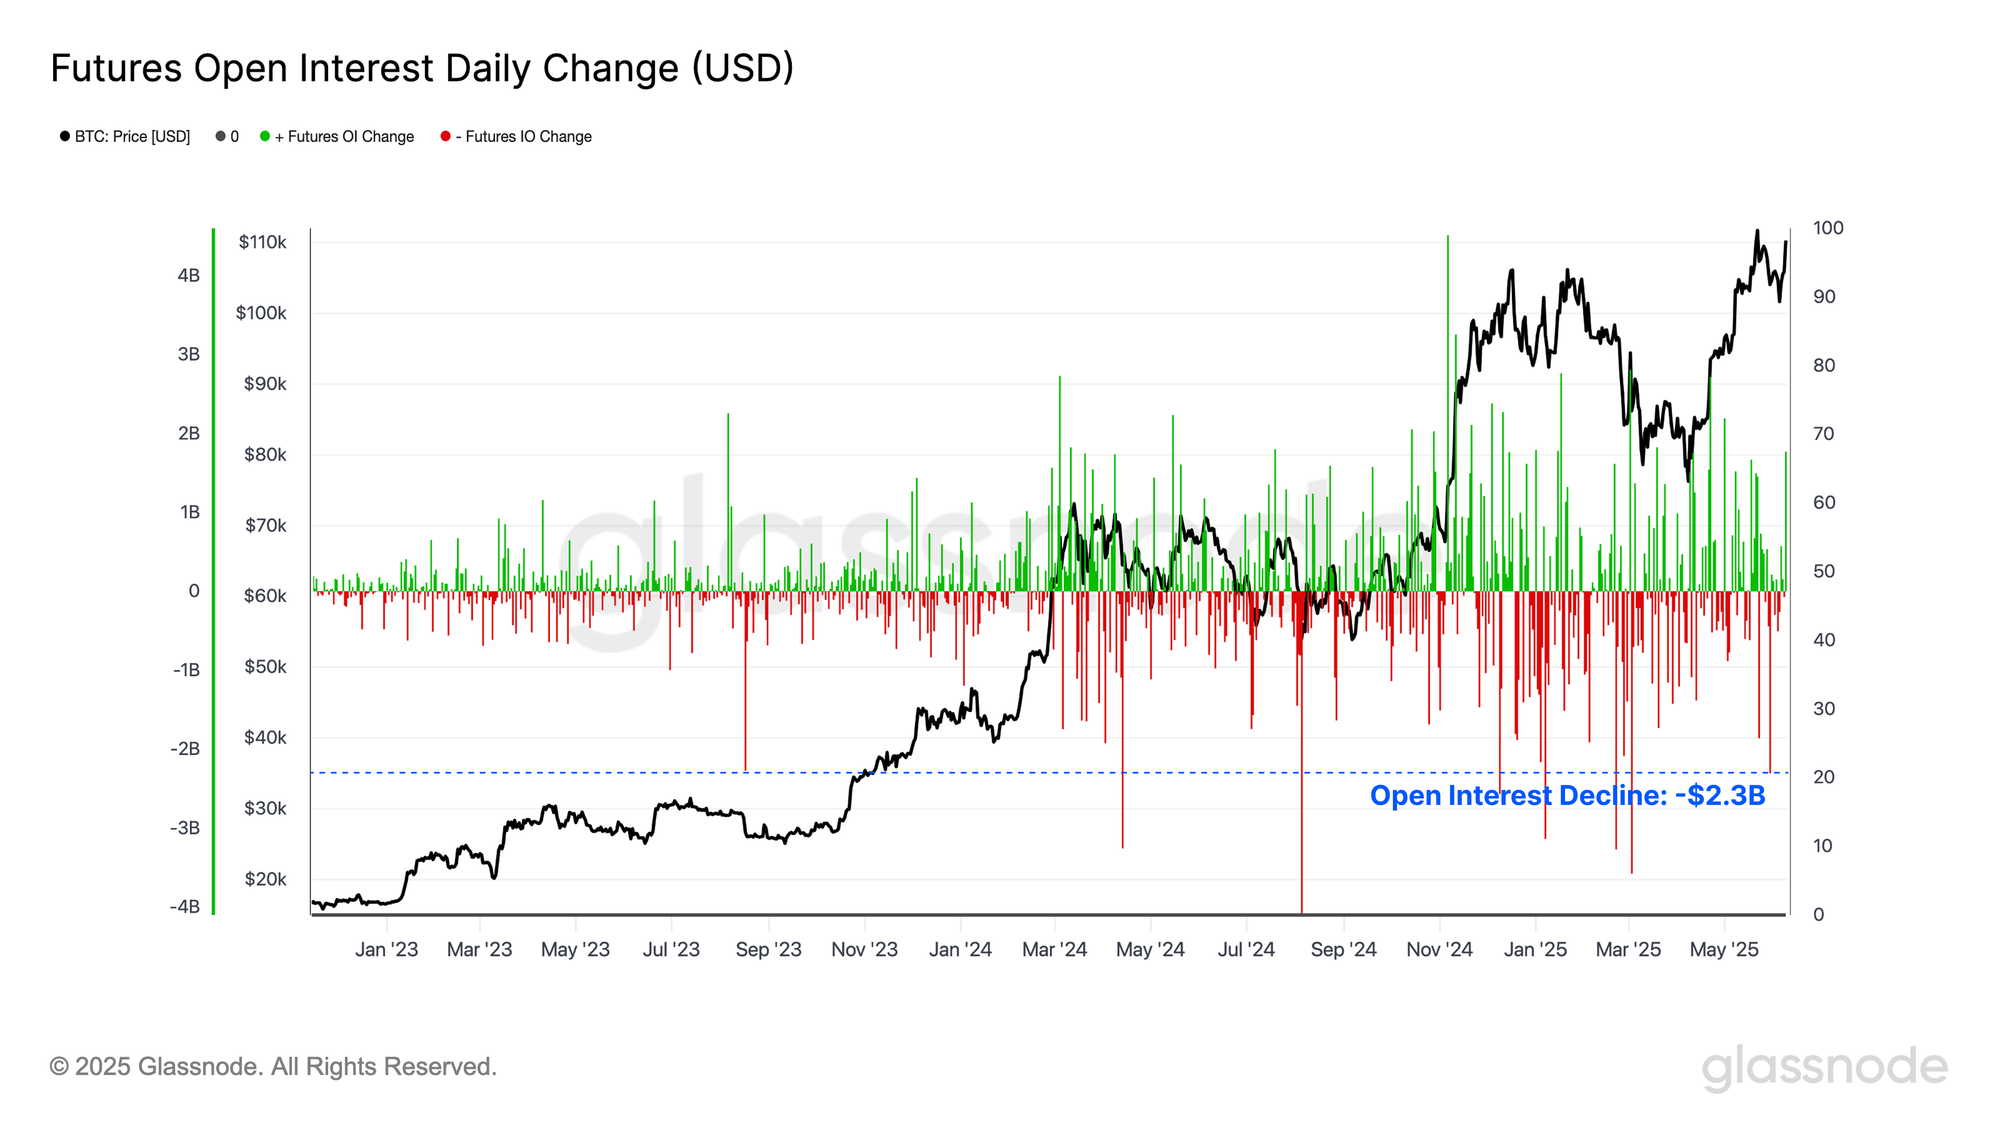
However, a significant closure in open interest occurred across futures markets, with over -$2.3B of force closed or withdrawn contracts. This event was the 7th largest of the current cycle, highlighting the contraction as a significant de-leveraging event this cycle.
This dichotomy between the on-chain and futures market highlights that the market contraction was likely driven by activity within the futures market, with investor confidence across on-chain markets remaining robust.
Long-Term Holder Profit Taking
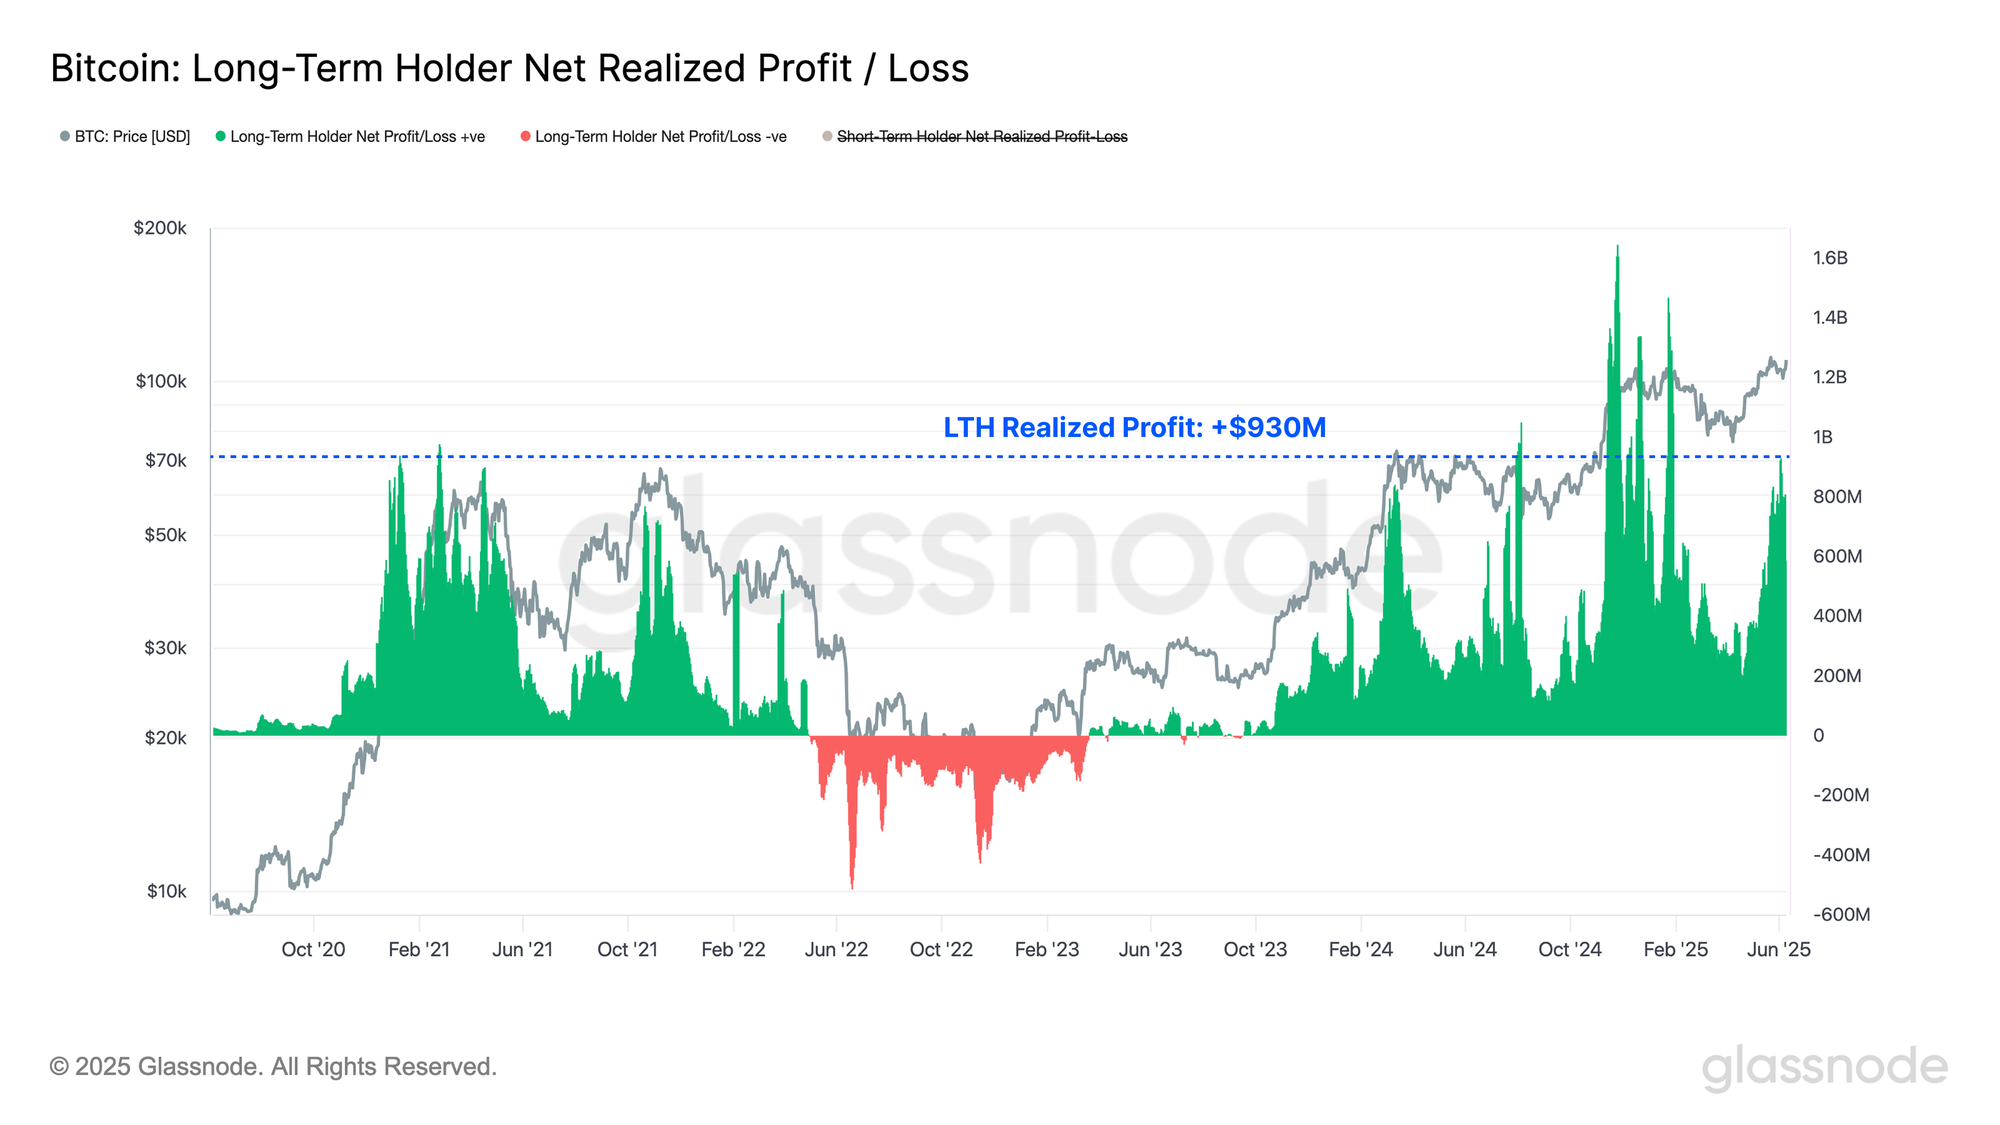
With Bitcoin trading just a stone’s throw from its ATH, it is prudent to assess the behavior of Long-Term Holders (LTHs), a cohort known to become increasingly active at market extremes. Historically, outsized distribution from this group has aligned with overheated market conditions and, at times, signaled transitions into bear market regimes.
Currently, we observe a notable uptick in LTH spending behavior, with their Net Realized Profit/Loss reaching a local peak of $930M/day. This figure rivals the $840M/day realized during the $73K ATH, yet remains well below the $1.64B/day peak seen during the initial breakout above $100K. This dynamic suggests that while LTH profit-taking is elevated, current price levels are not yet attractive enough to trigger broader-scale distribution.
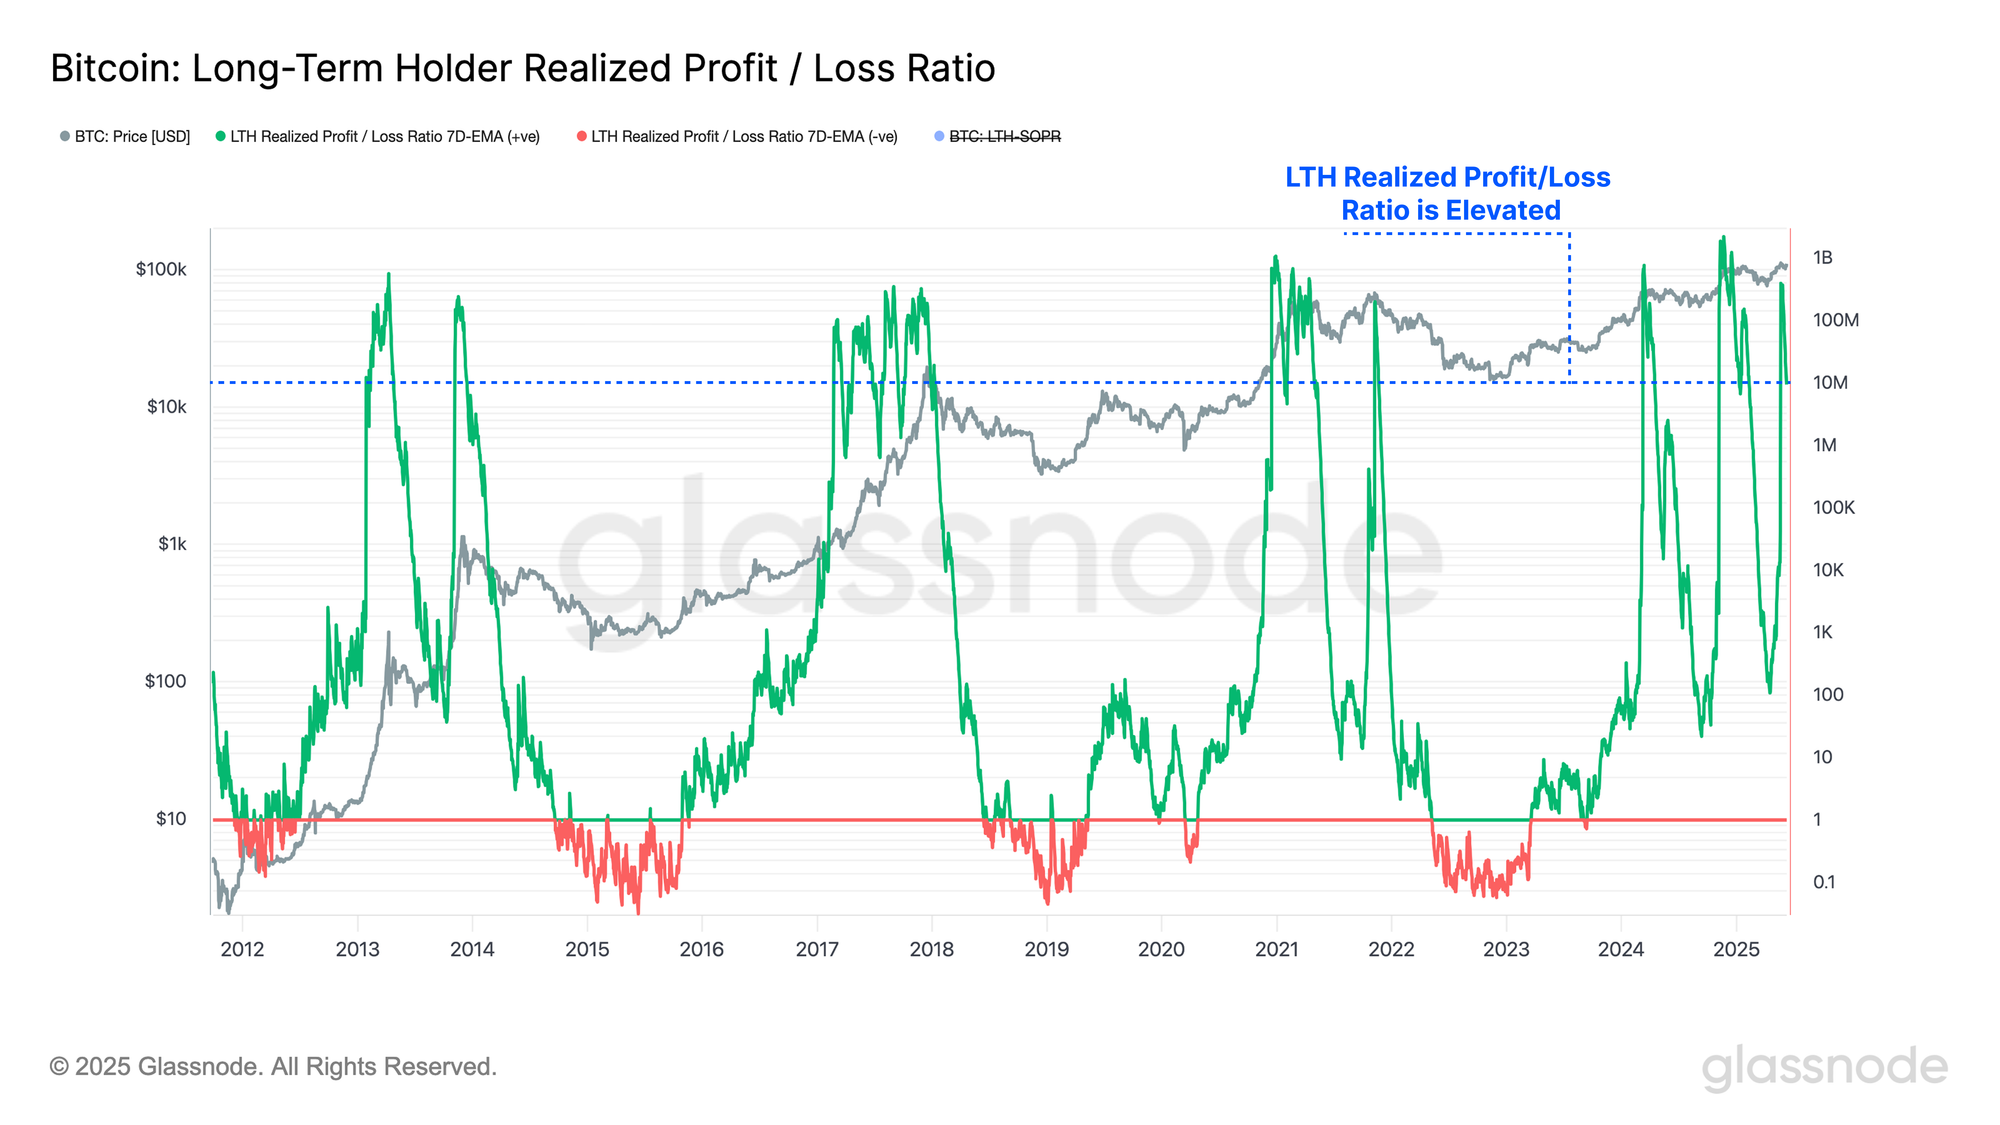
The recent surge in profit-taking has driven the LTH Realized P/L Ratio aggressively higher, reaching a value of 9.4M, a level surpassed on only 884 / 5601 trading days (15.8%). This uptick reflects a regime where the vast majority of long-term held supply is now transacting at large scale profits, with minimal volume being transacted at a loss.
Historically, such elevated readings in this metric are consistent with periods of euphoria, which typically occur at the later stages of the bull market. Provided there is a sustained influx of new demand and liquidity, these euphoric phases can persist for several months.
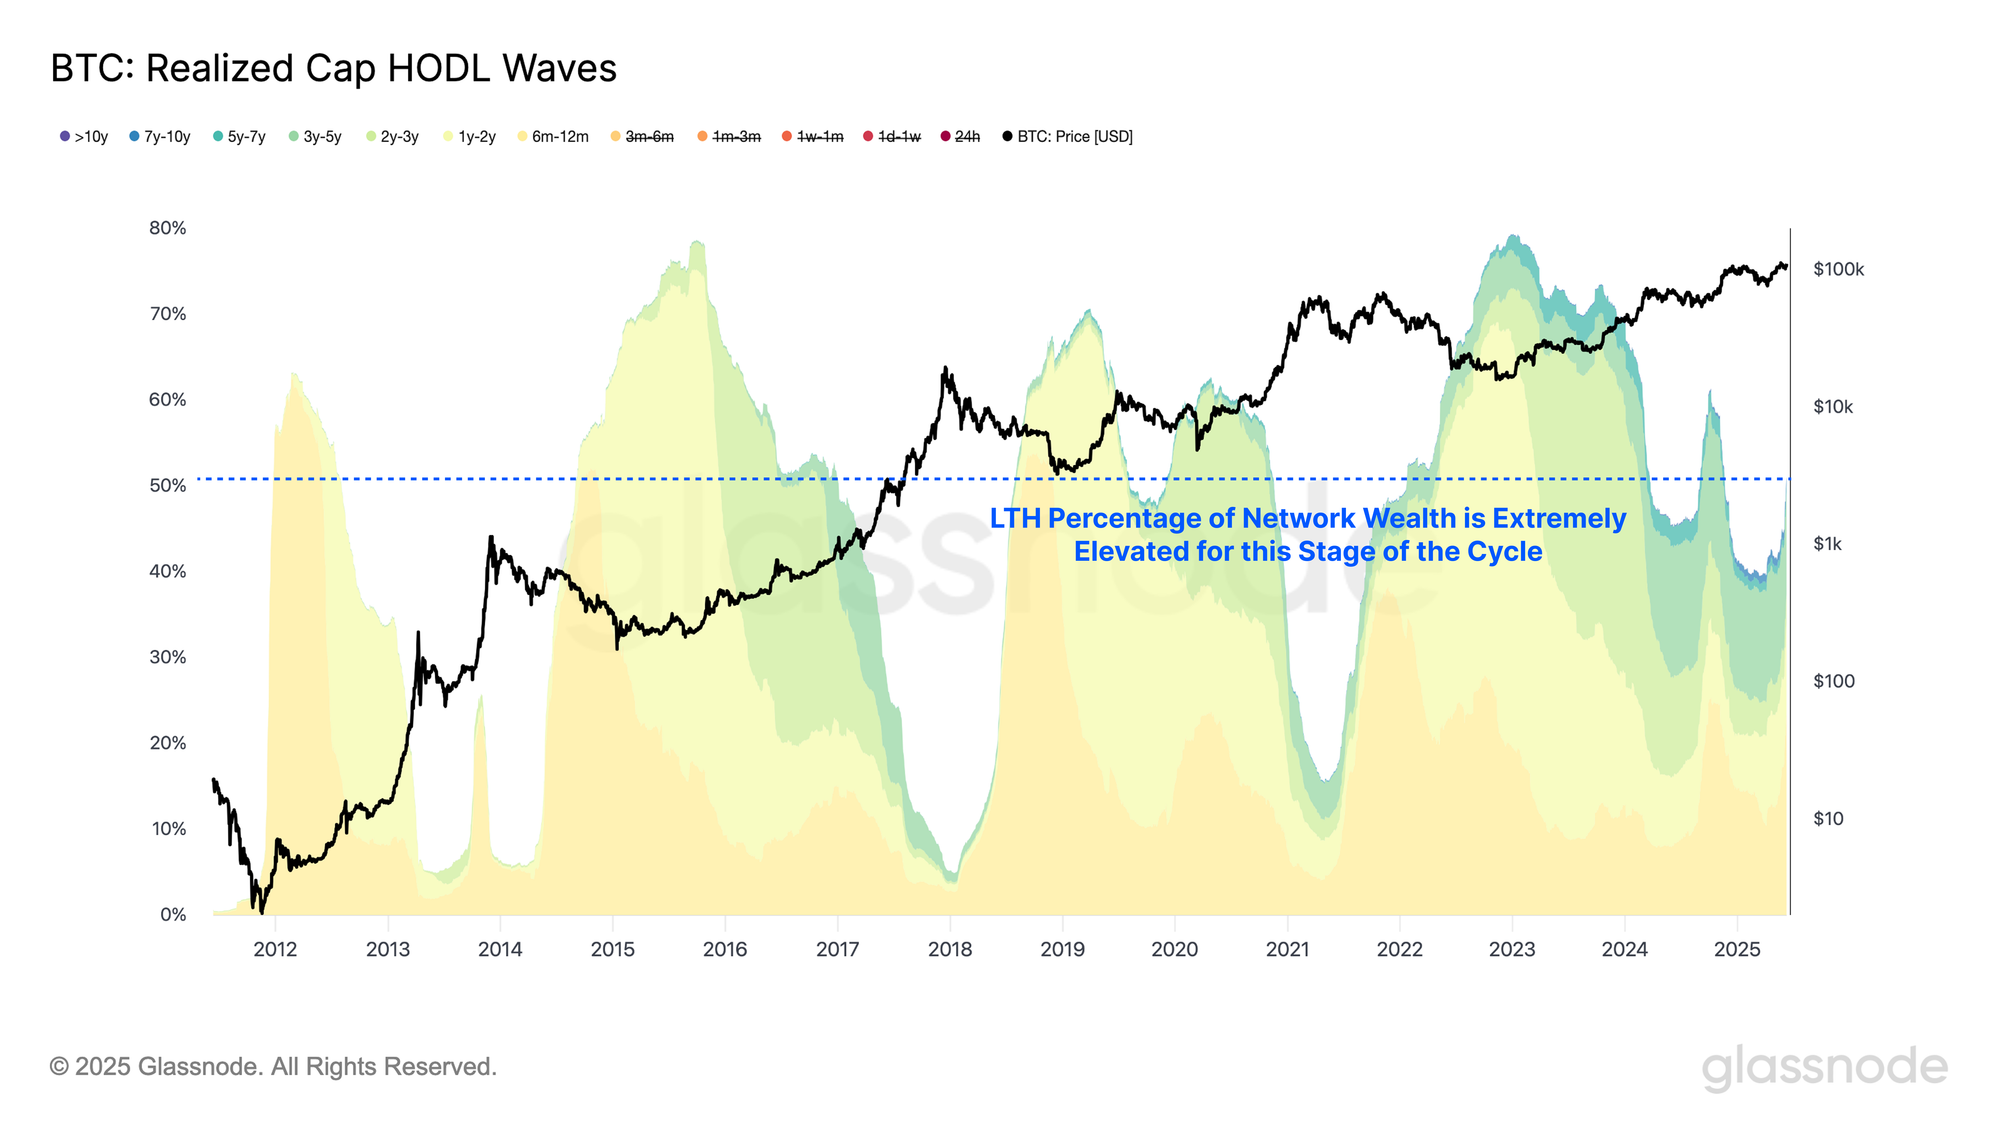
Despite the marked increase in Long-Term Holder profit-taking and spending activity, the proportion of network wealth held by the cohort continues to rise. This dynamic highlights that maturation and accumulation pressures are outweighing distribution behavior.
Such a trend is highly atypical for late-stage bull markets, which are traditionally characterized by a decline in LTH supply as the cohort enters sustained periods of aggressive distribution. In contrast, the current cycle reflects a unique duality: elevated LTH spending volumes are occurring alongside an even greater volume of coins aging into maturity and entering the cohort.
This phenomenon introduces a new market structure, where LTH wealth appears significantly stickier than in prior cycles. A likely driver of this change is the influence of U.S. Spot Bitcoin ETFs and growing institutional participation, which may be anchoring a larger portion of supply in long-term custody.
Volatility Builds
As the market approaches all-time highs and Long-Term Holder distribution accelerates, assessing volatility expectations becomes increasingly relevant.
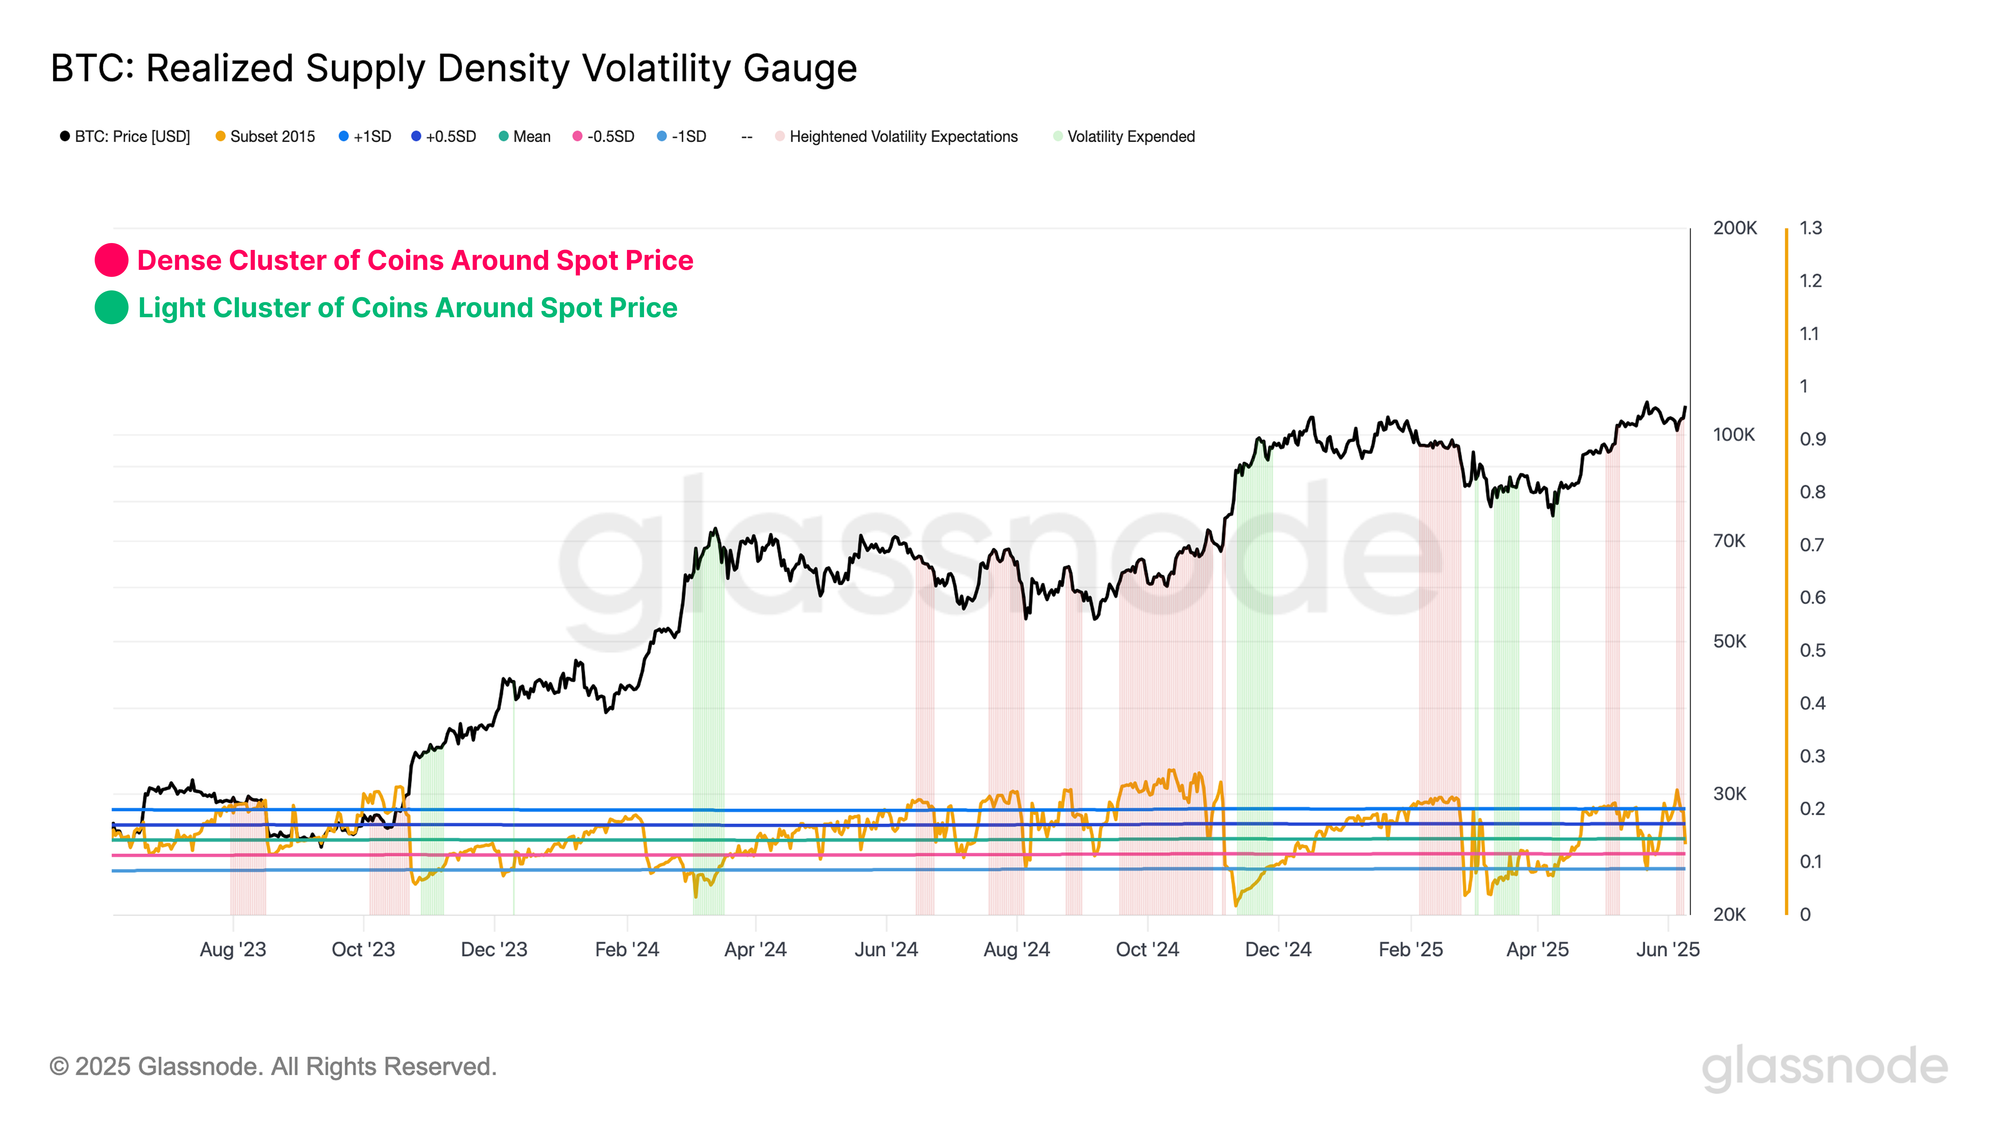
The Realized Supply Density metric offers a valuable lens through which to evaluate the concentration of coin supply with a cost basis near the current spot price. Elevated values indicate a dense cluster of coins acquired at or around current prices. In such environments, even modest price fluctuations can affect a broad swath of investors, often amplifying market sensitivity and, in turn, volatility potential.
In recent weeks, this metric has seen a notable uptick, pointing to strong accumulation near the spot price. This concentration raises the probability of outsized reactions to price movements, increasing volatility risk in the near term.
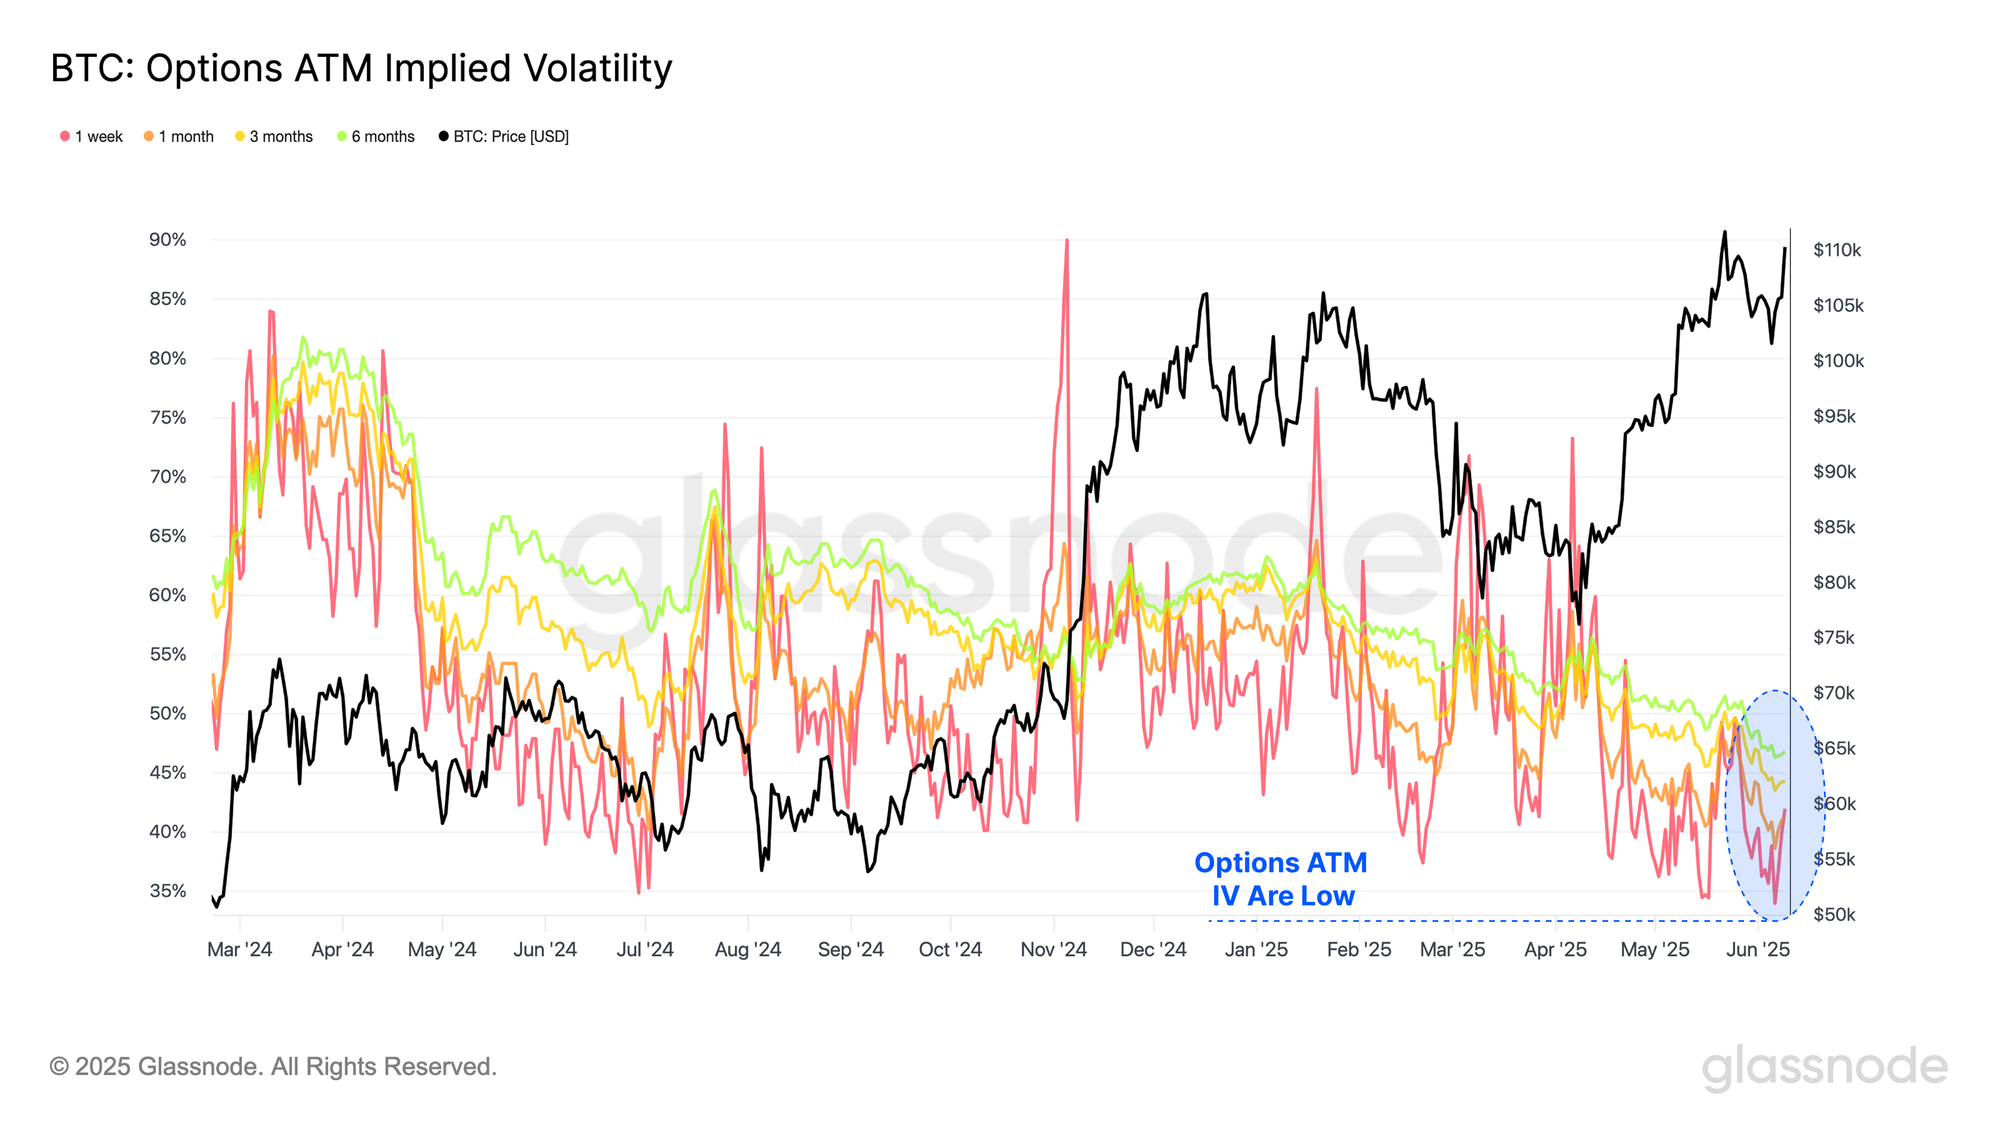
In contrast, a view from the options market tells a different story. At-the-Money Implied Volatility (ATM IV) across all major tenors continues to trend lower, suggesting that options traders are not anticipating a shift to a high-volatility regime. Historically, such complacency in volatility pricing has often served as a counter-trend signal, preceding periods of heightened volatility.
Market Navigation
With Bitcoin continuing its upwards approach towards its ATH, whilst volatility expectations continue to uptick, we shall consult a combination of key technical and on-chain pricing levels to help navigate multiple paths for price.
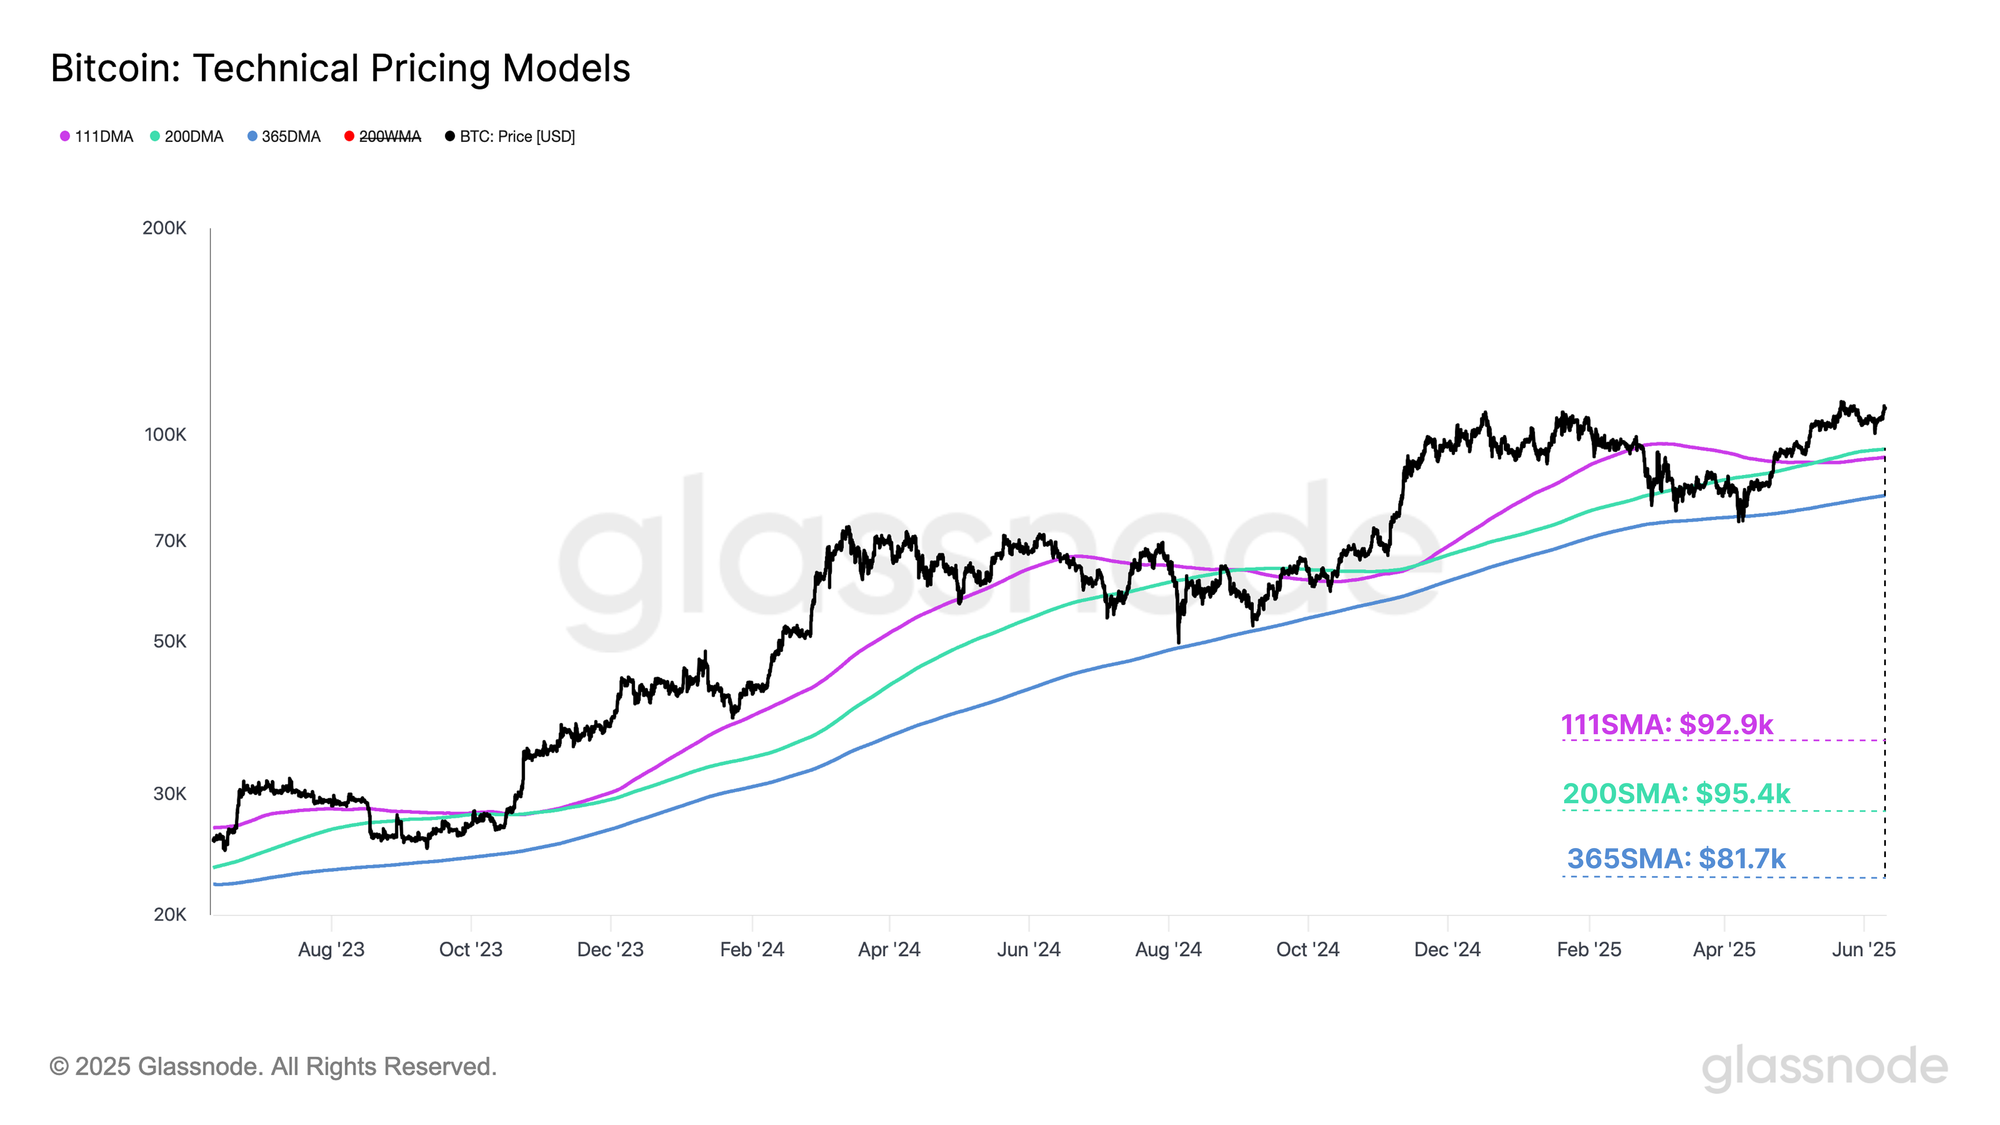
With price is commonly considered as the ultimate distillation point of supply and demand, the 111DMA, the 200DMA and the 365DMA have historically served as robust momentum gauges for Bitcoin, with elevation above all three generally a constructive observation.
- 111DMA: $92.9k
- 200DMA: $95.4k
- 365DMA: $81.7k
From a technical standpoint, the price band between $92.9k and $95.4k appears to be a critical region to maintain in order to reinforce local momentum, while the $81.7k level serves as a potential lower bound consistent with broader bull market conditions. At present, Bitcoin is recording a substantial deviation above these levels, indicating notable market strength.
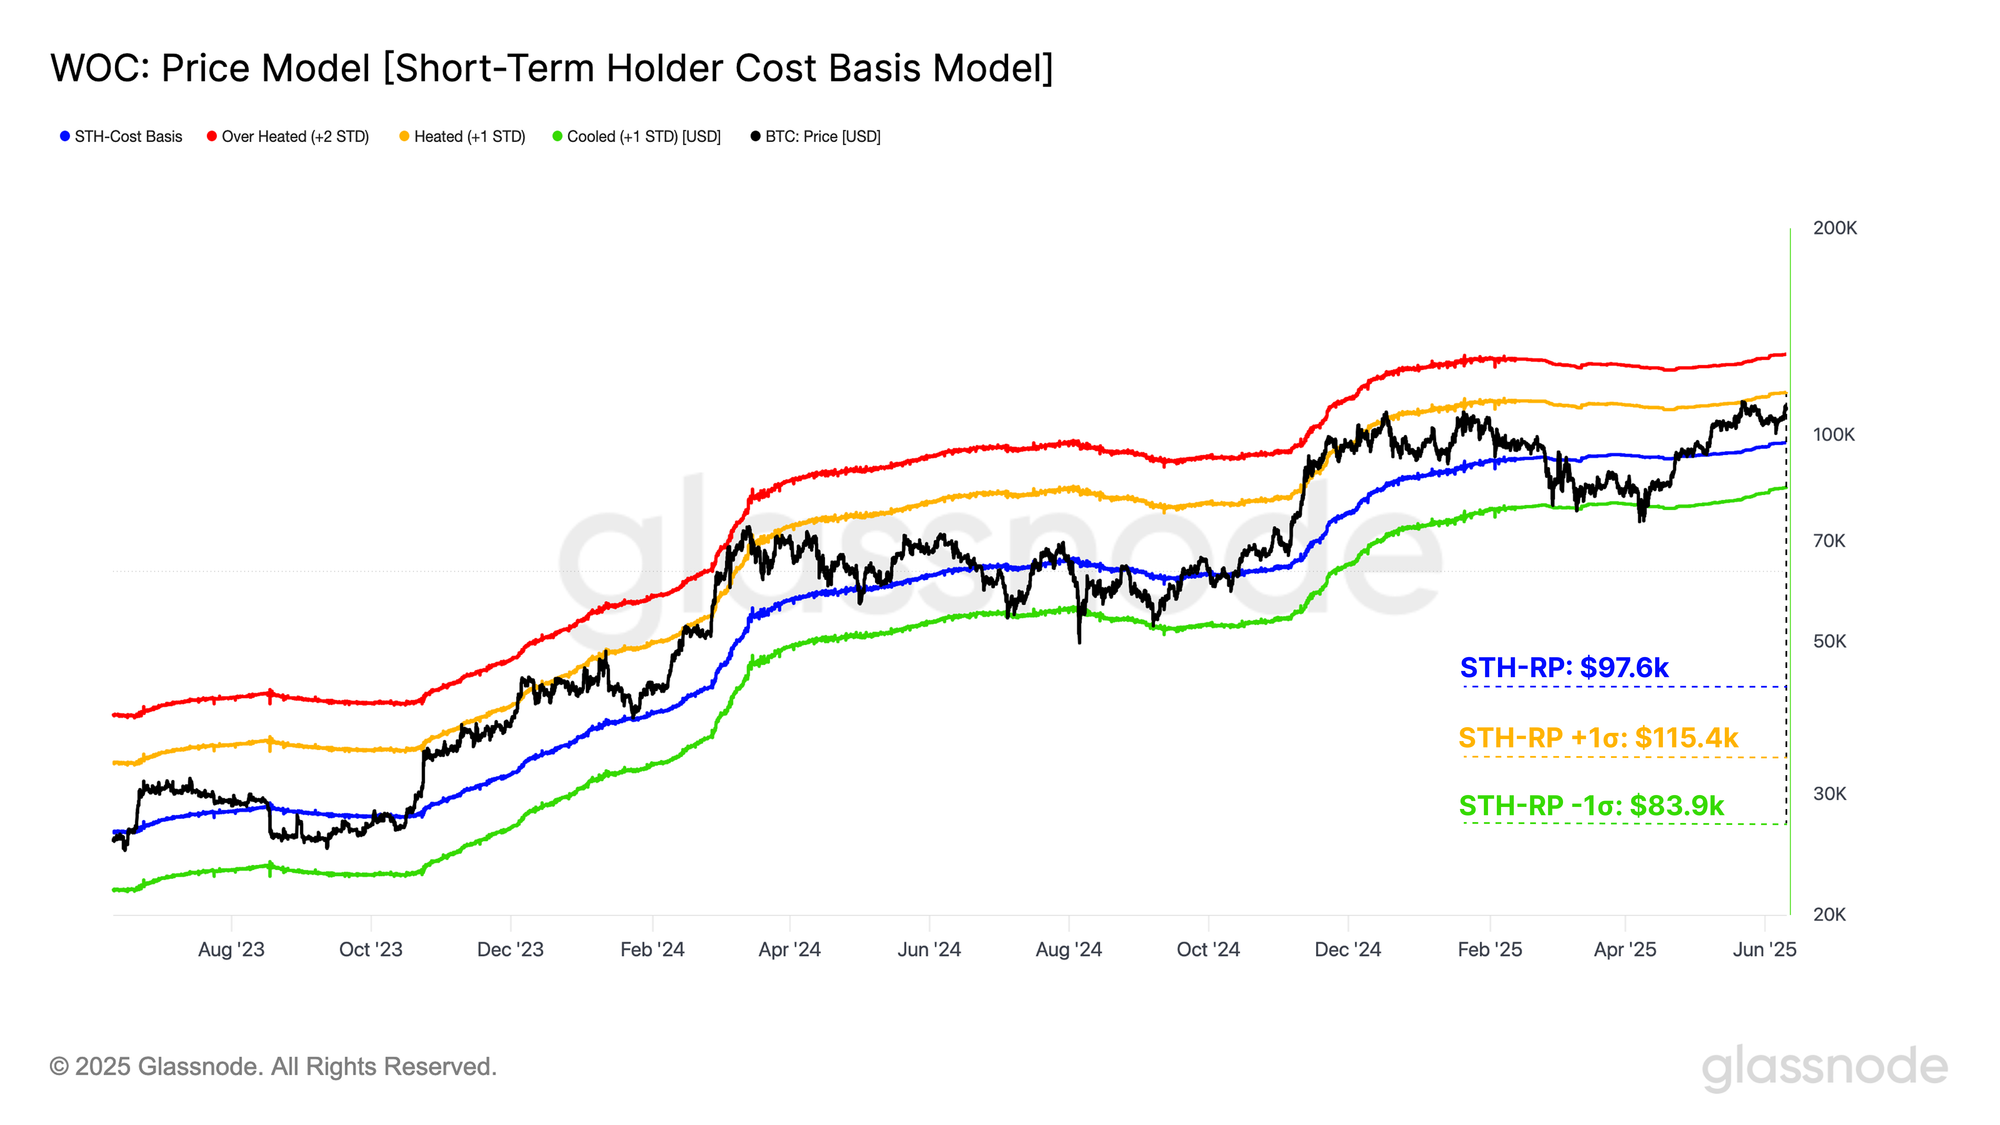
Shifting focus to key on-chain pricing levels, the Short-Term Holder (STH) cost basis, representing the average acquisition price for newer market participants, has historically served as a pivotal threshold delineating between bullish and bearish local regimes.
To provide greater statistical context, we apply standard deviation bands around the STH cost basis to define dynamic support and resistance zones. These bands quantify the range of market consensus among short-term participants, with the outer bounds often signaling zones of trend exhaustion or breakout potential.
- STH CB +1σ: $115.4k
- STH Cost Basis: $97.6k
- STH CB -1σ: $83.9k
During the recent market contraction, price began to approach the STH cost basis at $97k, yet ultimately found demand and reversed at the $101k level. This is a constructive signal, as the price not only front-ran a retest of the STH-CB but also held above the psychologically significant $100k mark, suggesting investor confidence remains robust.
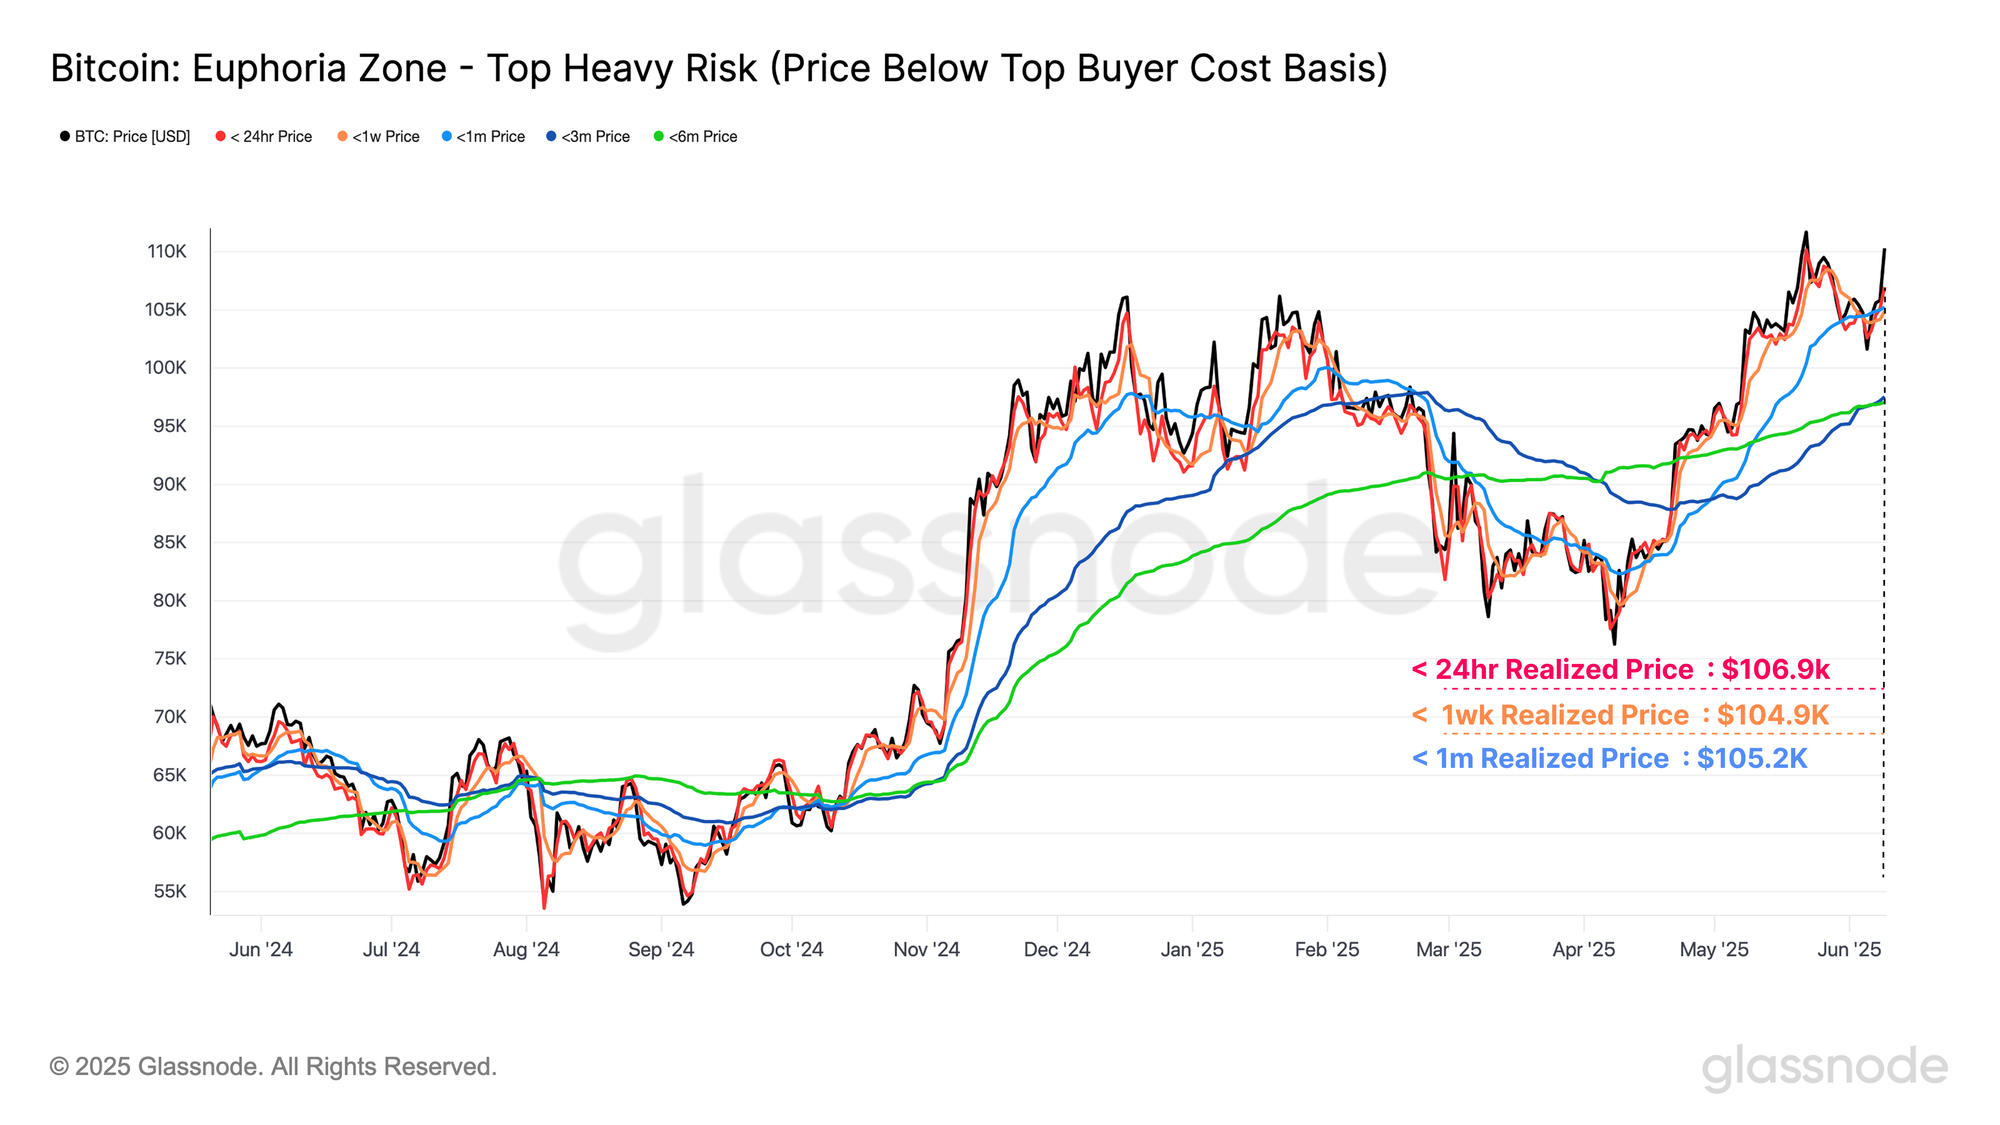
We can complement our observation of the Short-Term Holder investors by assessing the cost-basis of individual sub-groups within the cohort. We can consider these as a sort of fast-to-slow ribbon of cost basis levels, providing a form of momentum indicator:
The recent upwards impulse has led to a notable reduction in financial pressure and stress on these investors with all new demand sub-groups now in a profitable position. If sustained, this can be considered as another positive observation for market momentum, with nearly all denominations of investors now in profit.
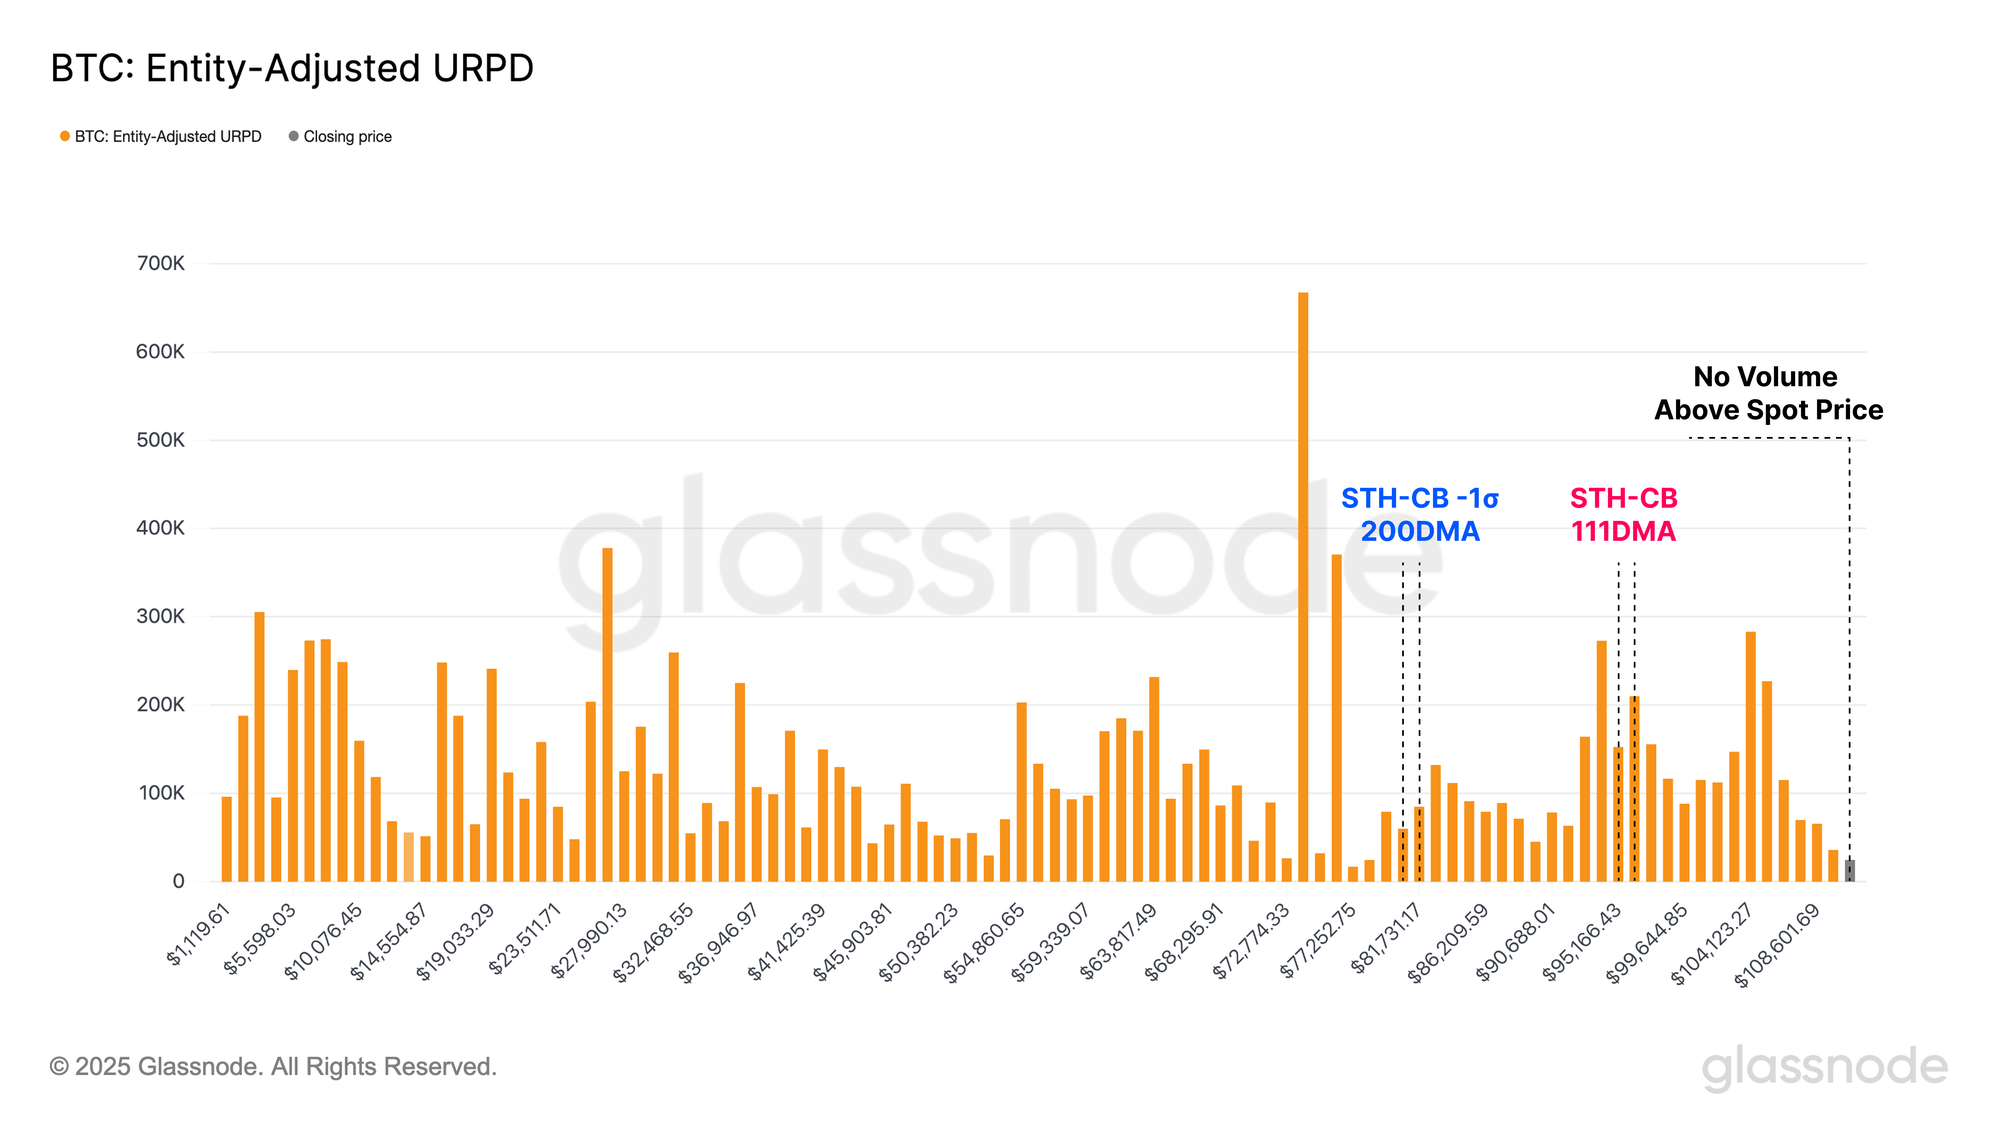
To close out, we turn to the URPD (UTXO Realized Price Distribution) metric, which illustrates the on-chain volume profile of all circulating coins by their acquisition price. During the recent correction, price retraced into the core of the supply cluster, reaching the midpoint of the underlying support zone. As highlighted earlier, the absence of significant panic selling among underwater investors, coupled with the swift recovery in price, marks a positive development.
Currently, Bitcoin sits on the upper edge of a dense supply cluster, with relatively sparse on-chain volume located above. As price enters this air gap region, where fewer coins have historically transacted, market momentum now depends on the strength of demand. To sustain the uptrend and push into price discovery, bullish pressure must decisively outweigh any emerging sell-side resistance.
Summary and Conclusions
With Bitcoin trading just below its all-time high, distribution from mature investors has accelerated, with realized profits peaking at over +$930M per day. Despite this marked uptick in spending activity, a unique dynamic of this cycle persists where maturation and accumulation pressures continue to outweigh Long-Term Holder sell-side flows, leaving this cohort with an unusually large share of network wealth for such a late stage in the bull market.
Concurrently, volatility expectations are beginning to rise, driven by the dense concentration of coin supply near the current spot price. This clustering increases market sensitivity to price fluctuations. However, Options At-the-Money Implied Volatility (ATM IVs) across all major tenors remain historically low, suggesting that options traders may be underpricing the likelihood of a volatility regime shift.
With volatility potentially on the horizon, we turn to key technical and on-chain cost-basis levels to assess market conviction and critical support/resistance thresholds. The $97.6k Short-Term Holder cost basis continues to serve as a pivotal support level necessary for maintaining local bullish momentum. On the upside, the $115.4k zone emerges as the first significant resistance should the market enter price discovery.
Disclaimer: This report does not provide any investment advice. All data is provided for informational, and educational purposes only. No investment decision shall be based on the information provided here and you are solely responsible for your own investment decisions.
Exchange balances presented are derived from Glassnode’s comprehensive database of address labels, which are amassed through both officially published exchange information and proprietary clustering algorithms. While we strive to ensure the utmost accuracy in representing exchange balances, it is important to note that these figures might not always encapsulate the entirety of an exchange’s reserves, particularly when exchanges refrain from disclosing their official addresses. We urge users to exercise caution and discretion when utilizing these metrics. Glassnode shall not be held responsible for any discrepancies or potential inaccuracies.
Please read our Transparency Notice when using exchange data.
- Join our Telegram channel.
- For on-chain metrics, dashboards, and alerts, visit Glassnode Studio.