After a turbulent price action over the weekend that saw Dogecoin briefly dip below $0.15, the meme-inspired cryptocurrency is now back again to testing an important technical level. Particularly, DOGE is now revisiting the 100-week Simple Moving Average (SMA), which has served as a strong support line for more than a year on the weekly candlestick timeframe, raising questions about what might unfold next for its price movement.
Dogecoin Revisits Familiar Support Line
Dogecoin’s recent extended price decline saw it break below $0.15 very briefly in the past 24 hours. Notably, Dogecoin slipped below $0.16 on Saturday for the first time since April, extending a downtrend that’s seen its price fall about 36% in the past 30 days. Over the weekend, DOGE’s price dropped to around $0.143 before rebounding to approximately $0.153 behind heavy trading volume of over five times the recent daily average.
Interestingly, this downward price action has seen DOGE now retesting a technical indicator that has had an important hand in its price action over the past year. This phenomenon was first noted on the social media platform X by crypto analyst Trader Tardigrade.
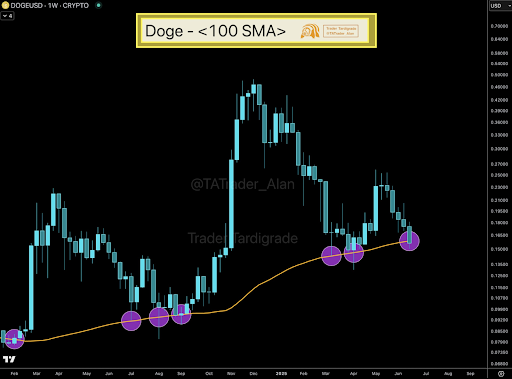
The chart shared by the crypto analyst on X captures an important pattern. DOGE’s weekly candles have repeatedly bounced off the 100 SMA over the past year, which has made it a vital technical floor for the meme coin. Each time Dogecoin’s price approached or dipped slightly below this moving average, it quickly recovered and went on uptrends.
Dogecoin’s brief plunge to around $0.143, its lowest point since early April, before rebounding above $0.15, has now placed interest with the 100 SMA, which could serve as a launchpad once again if bullish sentiment seeps in.
DOGE Price Zones To Watch
Right now, the important thing is whether Dogecoin can maintain its footing above the $0.145 to $0.151 support zone. The quick rebound following the weekend’s drop below $0.15 shows that buyers are still stepping in at this level. However, any signs of weakness could invalidate the bullish outlook of a bounce off the 100 SMA.
On the upside, reclaiming the $0.153 to $0.16 resistance range with volume confirmation would lend credibility to the idea that Dogecoin is ready for another rally from the 100 SMA. If that happens, price history shows Dogecoin could mirror previous reactions off this moving average and set up a rebound to a resistance level between $0.19 and $0.21. If the current retest leads to another successful bounce, a projection of the most recent bounce shows a move to at least $0.3 could be next.
At the time of writing, Dogecoin is trading at $0.1547, down by 2% in the past 24 hours.

Related Posts