Executive Summary
- The macroeconomic environment remains uncertain with the restructuring of global trade relations ongoing. This uncertainty has contributed to heightened volatility across both the U.S. Treasury and equity markets.
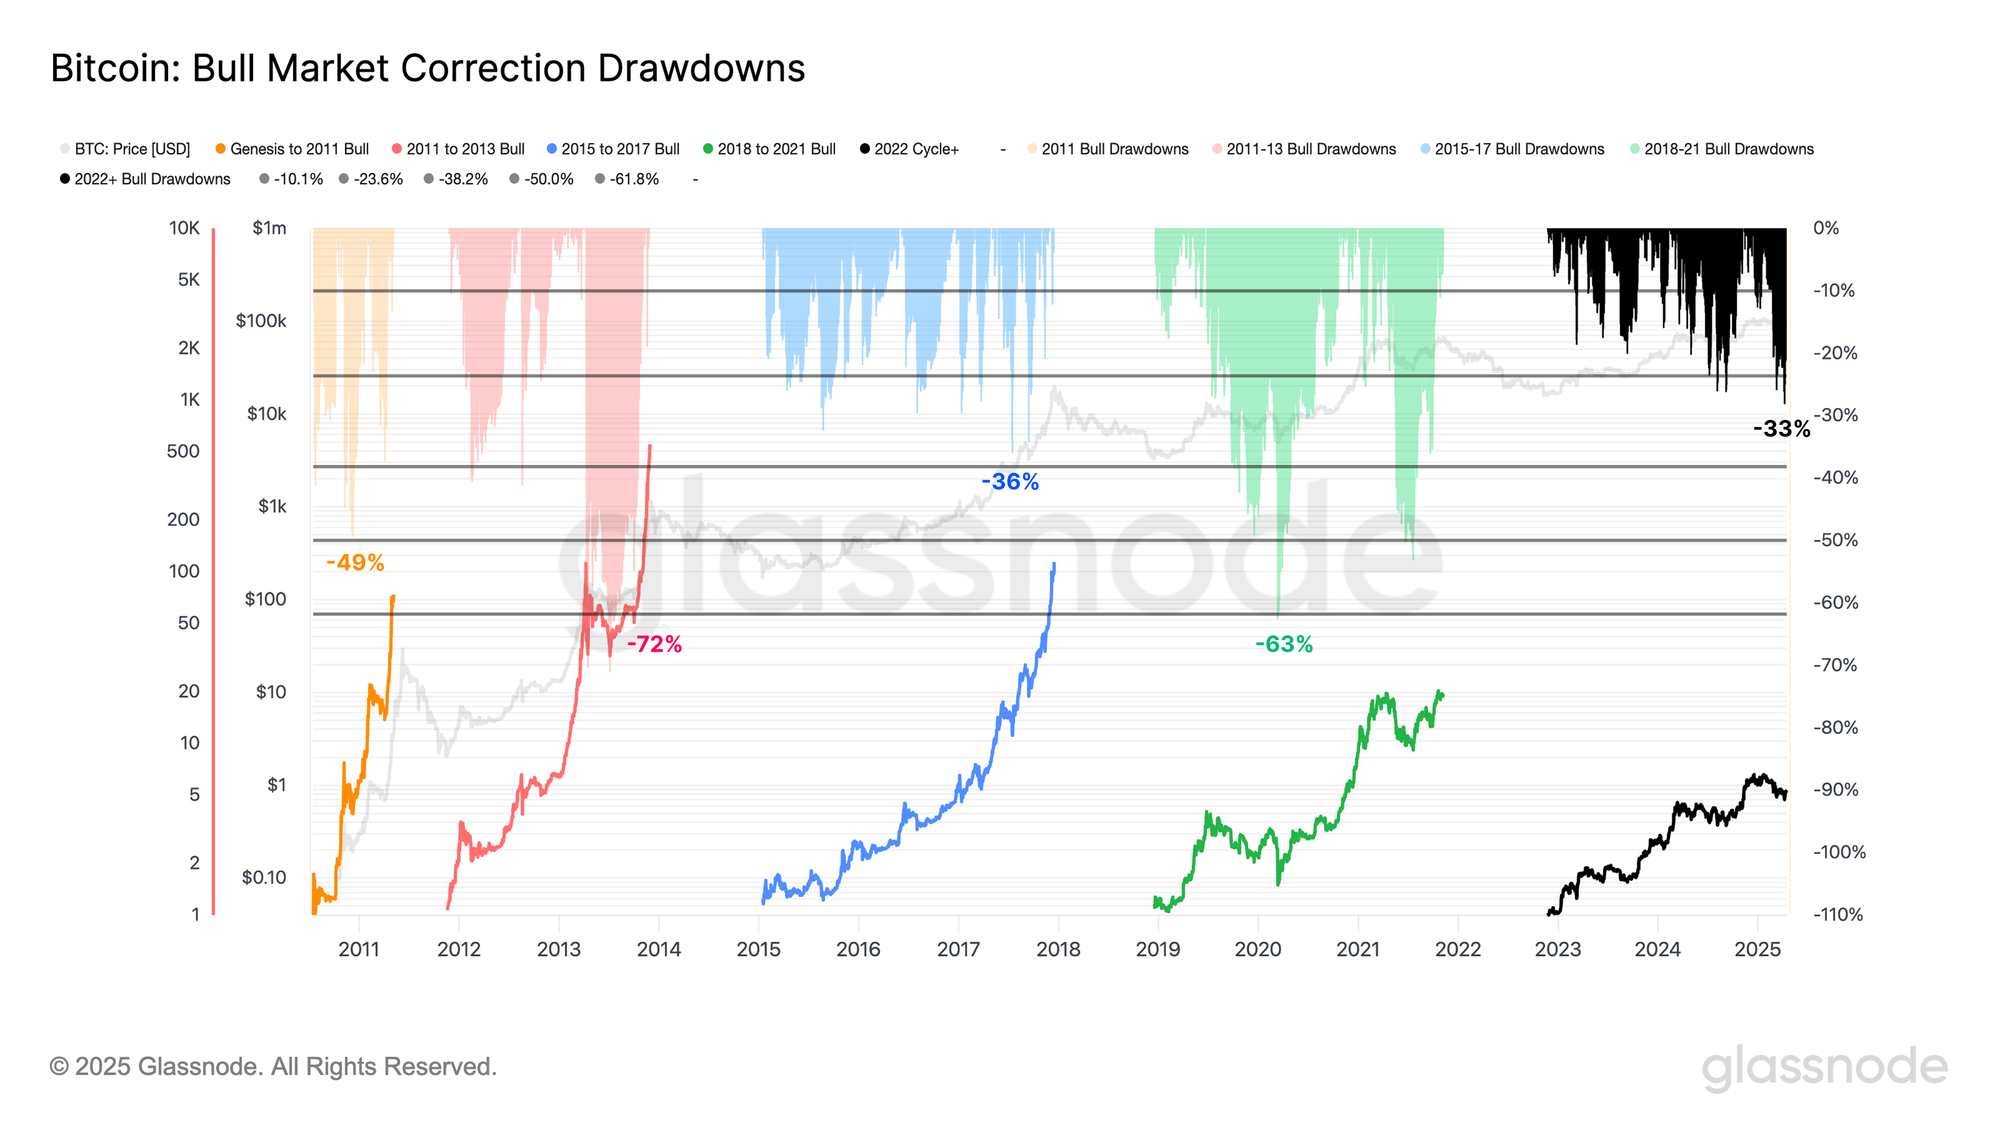
- In response to the challenging economic backdrop, Bitcoin has recorded its largest drawdown of the cycle. Nevertheless, this remains within typical bounds of previous corrections during bull markets. Additionally, the median drawdown of the cycle remains an order of magnitude lower than previous iterations, highlighting a more resilient demand profile.
- Liquidity across the digital asset ecosystem continues to tighten, reflected in declining capital inflows and stagnation in stablecoin growth.
- Investors are under considerable stress, currently facing the largest unrealized losses on record. However, the bulk of these losses are concentrated among newer market participants, while Long-Term Holders remain broadly in profit.
Macro Uncertainty Remains Rife
Uncertainty looms large across the macroeconomic landscape, with the Trump administration aiming to upend and restructure the status-quo of global trade relationships. As it stands, U.S Treasuries operate as the collateral and foundation of the financial system, with the 10yr Treasury considered to be the benchmark risk-free rate.
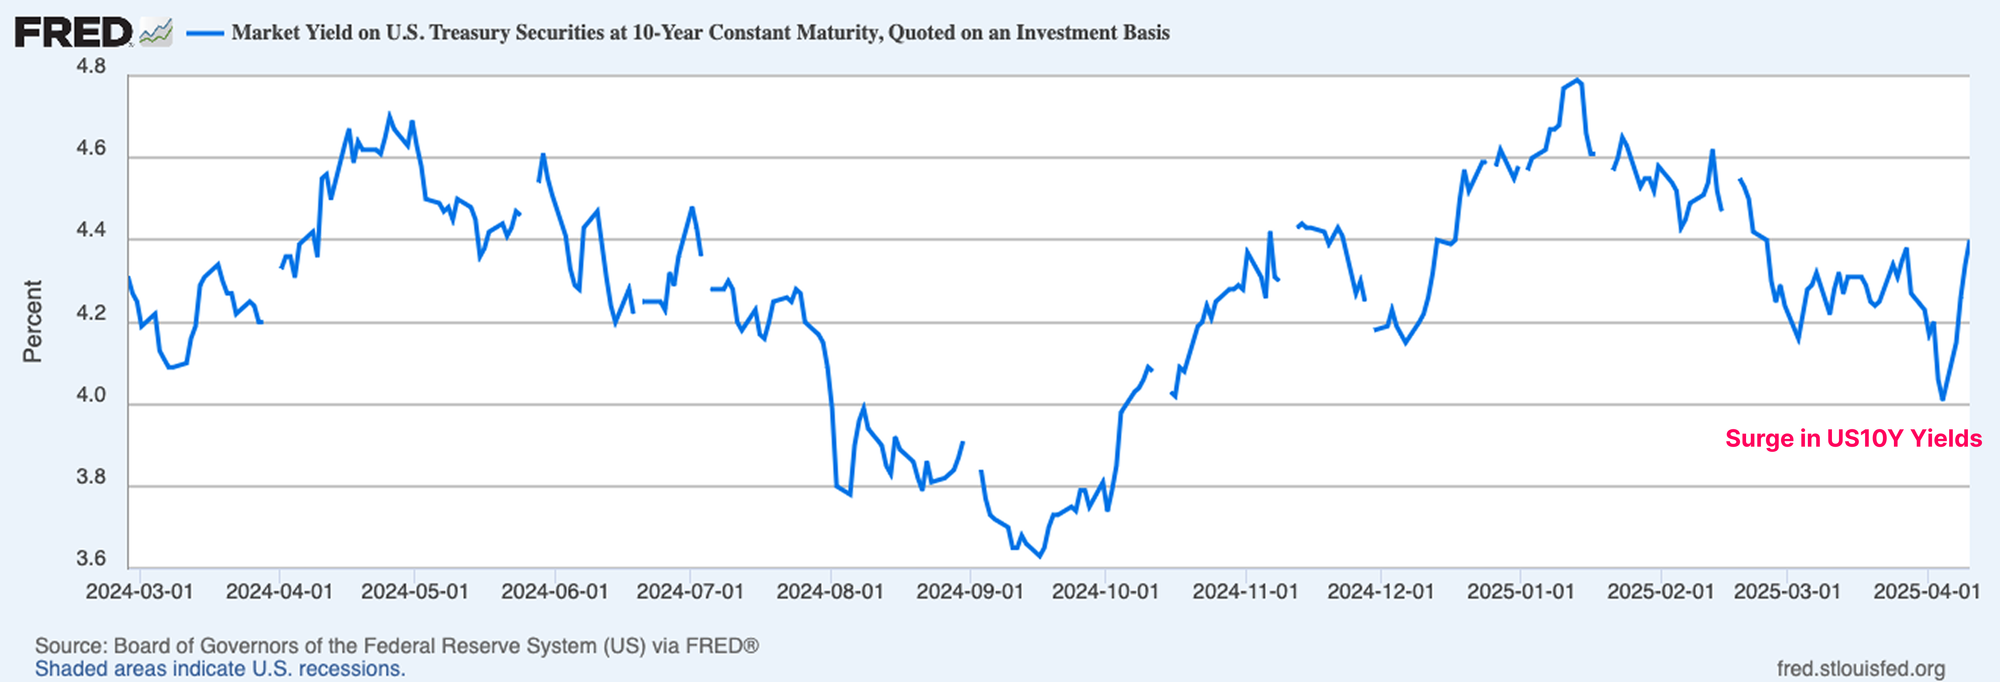
A key aim of the administration has been to lower the yield of the 10yr Treasury, and they found initial success in the opening months of the year with yields trading down to 3.7% as wider markets sold off. However, this was fleeting, as yields have since surged back to 4.5%, erasing this progress, and creating significant volatility within the bond market.
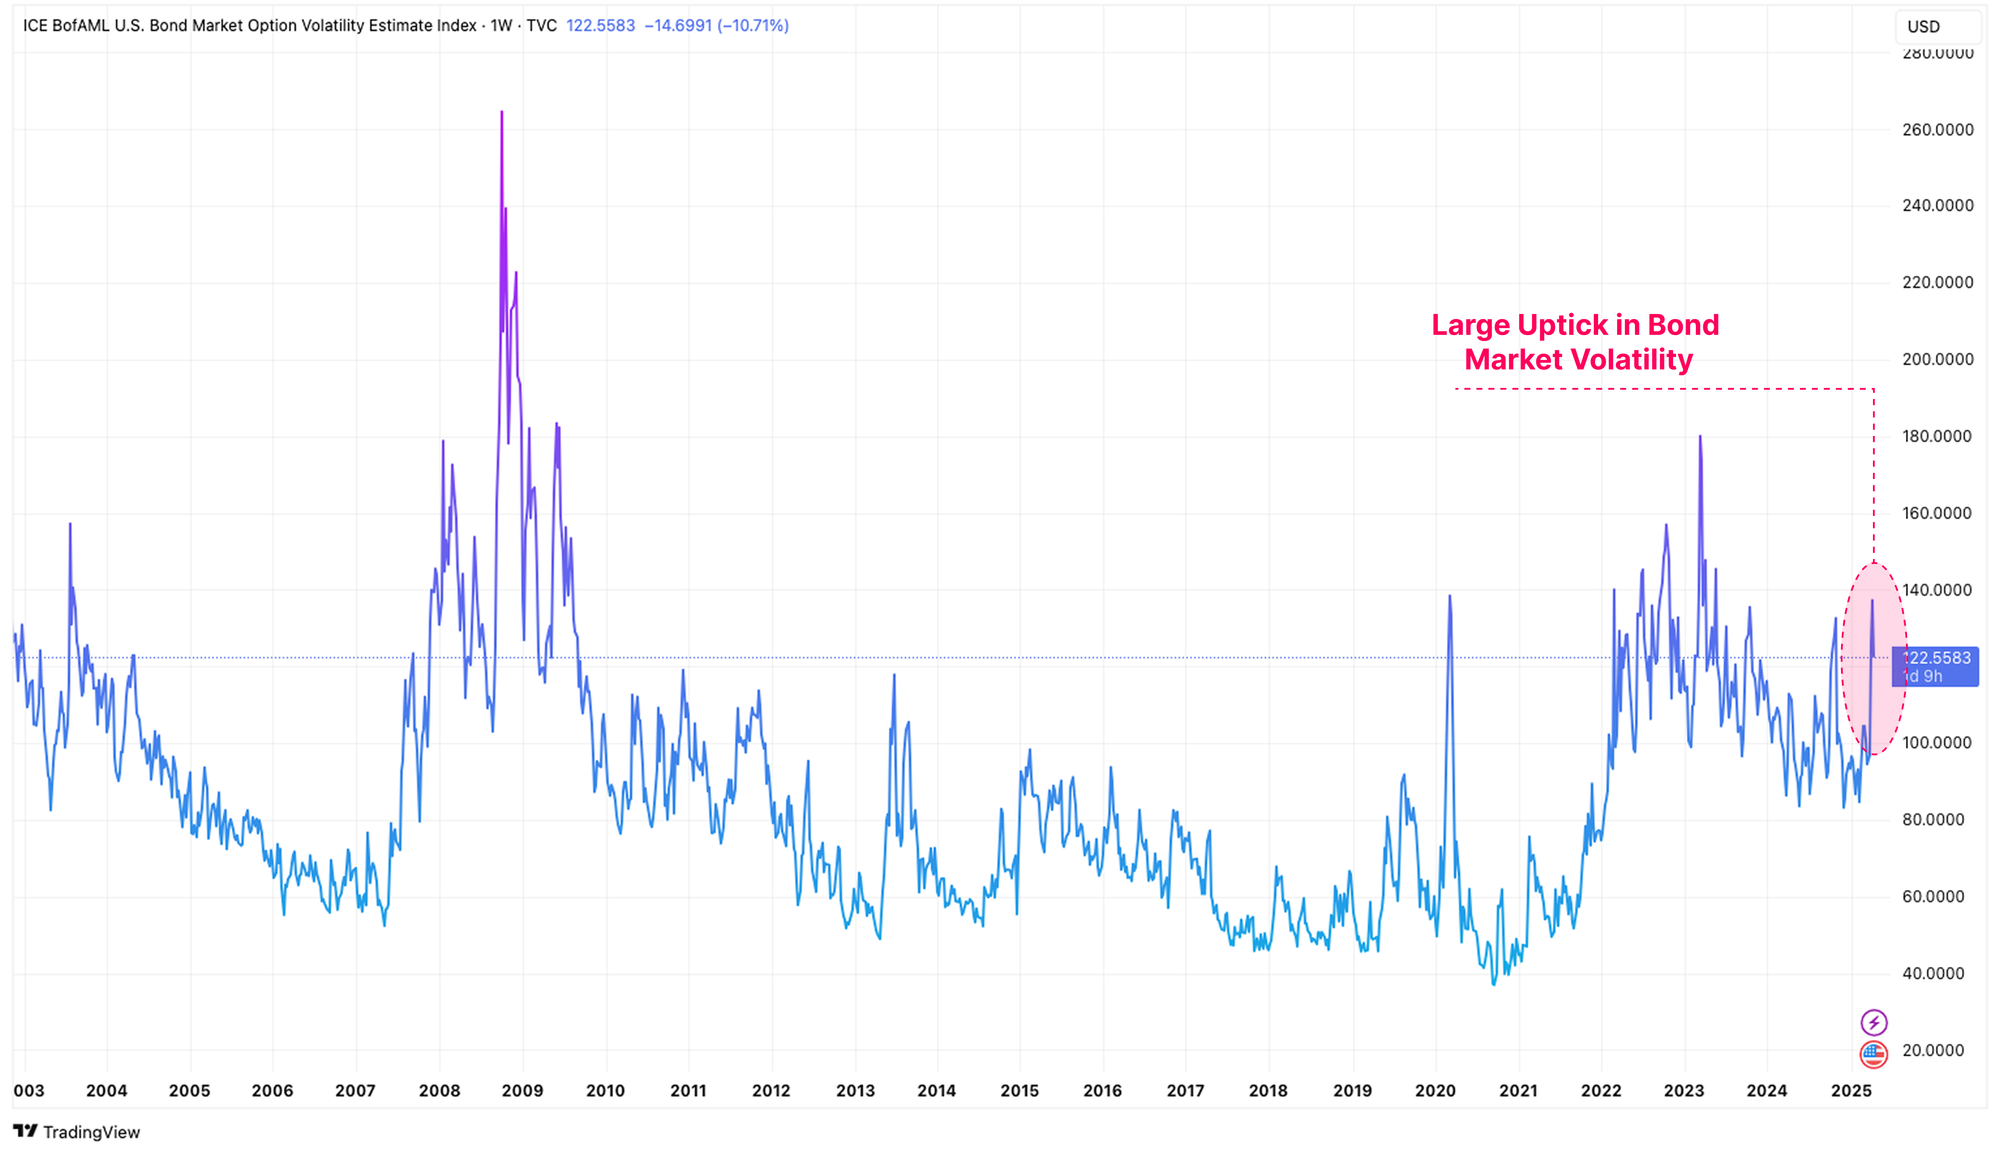
We can quantify the disorderly behavior of the bond market by way of the MOVE Index. This metric is a key indicator for bond market stress and volatility, derived from the implied 30-day volatility in the U.S. Treasury market based on option prices across various maturities.
By this measure, volatility in U.S treasures has surged higher, underscoring the extreme degree of uncertainty and fear amongst bond market investors.
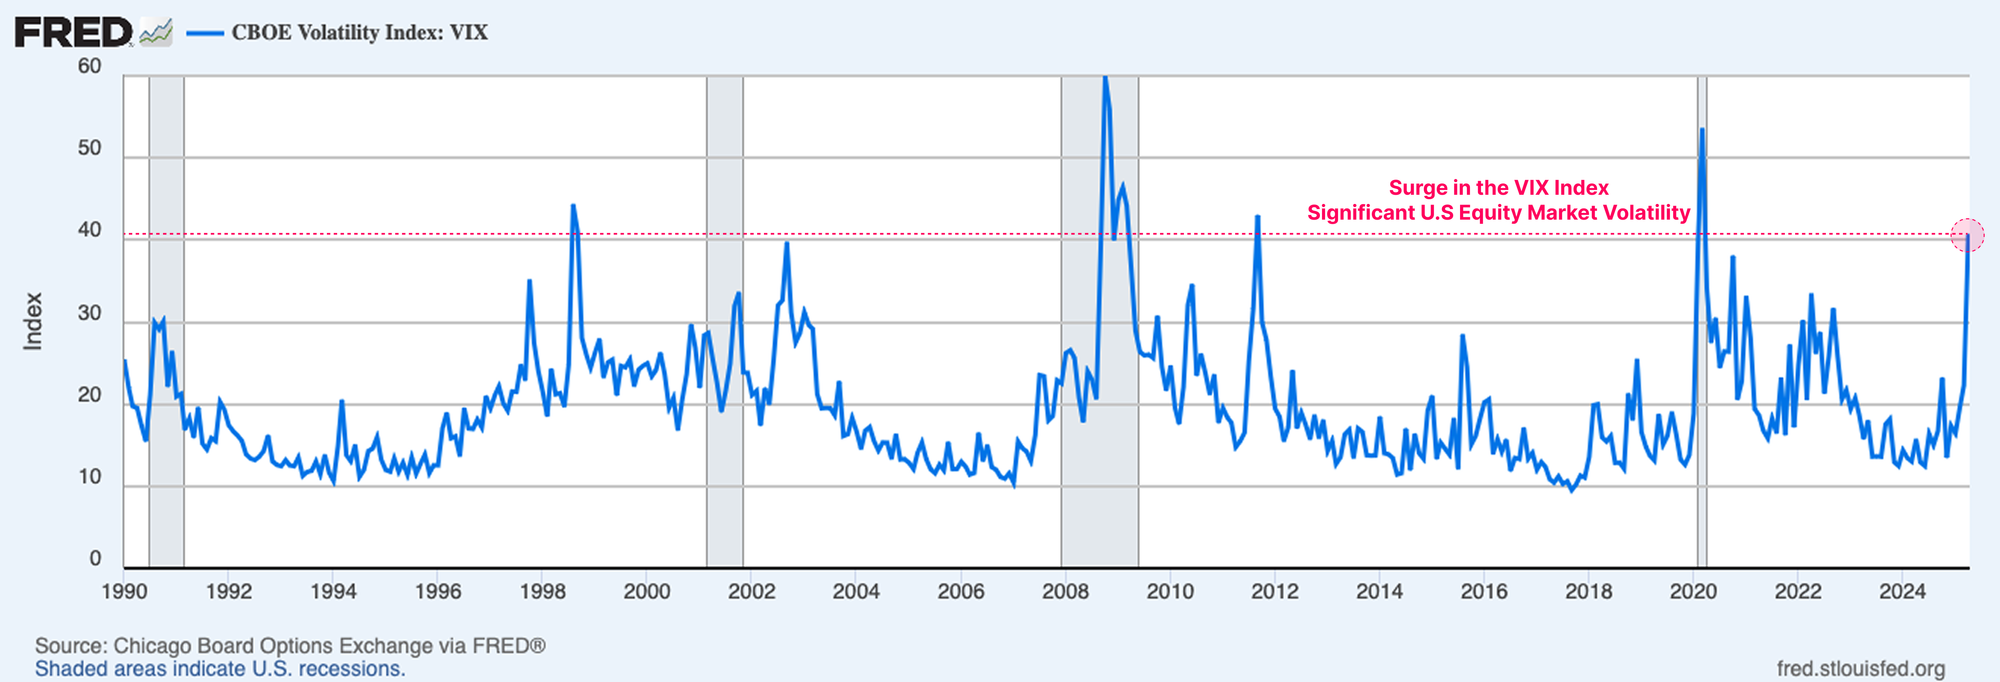
We can also measure disruption in U.S equity markets using the VIX Index which measures the market’s expectation for 30-day volatility in the U.S. stock market. Volatility in the bond market has also notably manifested within the equities market, with the VIX now recording similar values of volatility to the 2020 COVID crisis, the 2008 GFC, and the 2001 Dot Com Bubble.
Volatility in the base collateral of the financial system tends to result in a pull-back of investor capital, and a tightening of liquidity conditions. Given Bitcoin and digital assets are one of the most liquidity sensitive instruments, they were naturally swept up in the volatility and risk asset drawdown.
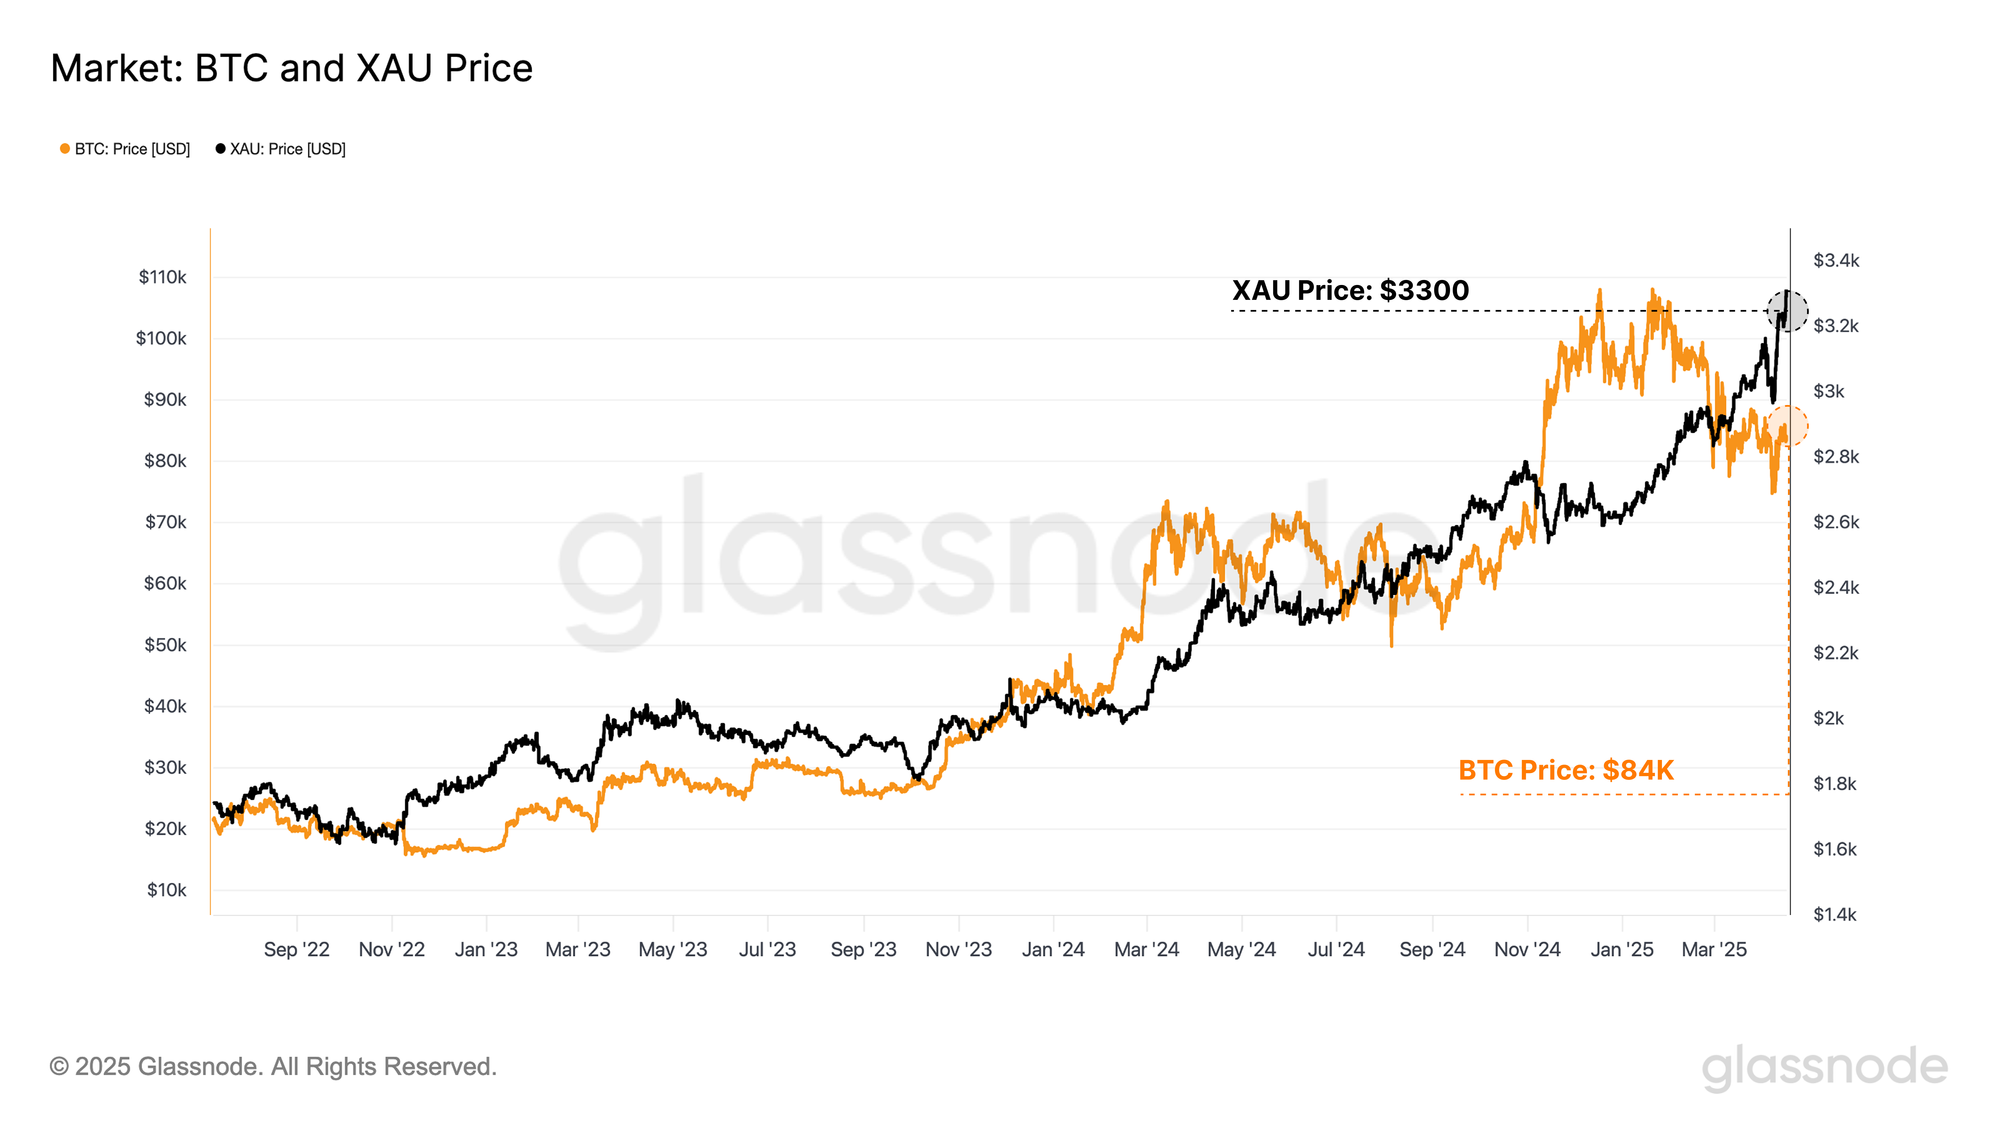
Amidst this turmoil, the performance of hard assets remains remarkably impressive. Gold continues to surge higher, having reached a new ATH of $3,300, as investors flee to the traditional safe haven asset. Bitcoin sold off to $75k initially alongside risk assets, but has since recovered the weeks gains, trading back up to $85k, now flat since this burst of volatility.
As the world adjusts to changing trade relationships, Gold and Bitcoin are increasingly entering the centre stage as global neutral reserve assets. Thus, one can argue there is a fascinating signal signal in the performance of Gold and Bitcoin during last weeks events.
Bitcoin Remains Resilient
Whilst it is impressive to observe Bitcoin still trading within $85k region, the leading digital asset has still experienced heightened volatility and drawdowns in recent months. The asset has recorded its largest drawdown in the 2023-25 cycle, reaching a max pull-back of -33% below its ATH.
However, the magnitude of the drawdown remains within the typical bounds of previous corrections during bull markets. In prior macroeconomic events like last week, Bitcoin has typically experienced greater than -50% sell-offs in such events, which highlights a degree of robustness of modern investor sentiment towards the asset during unfavourable conditions.
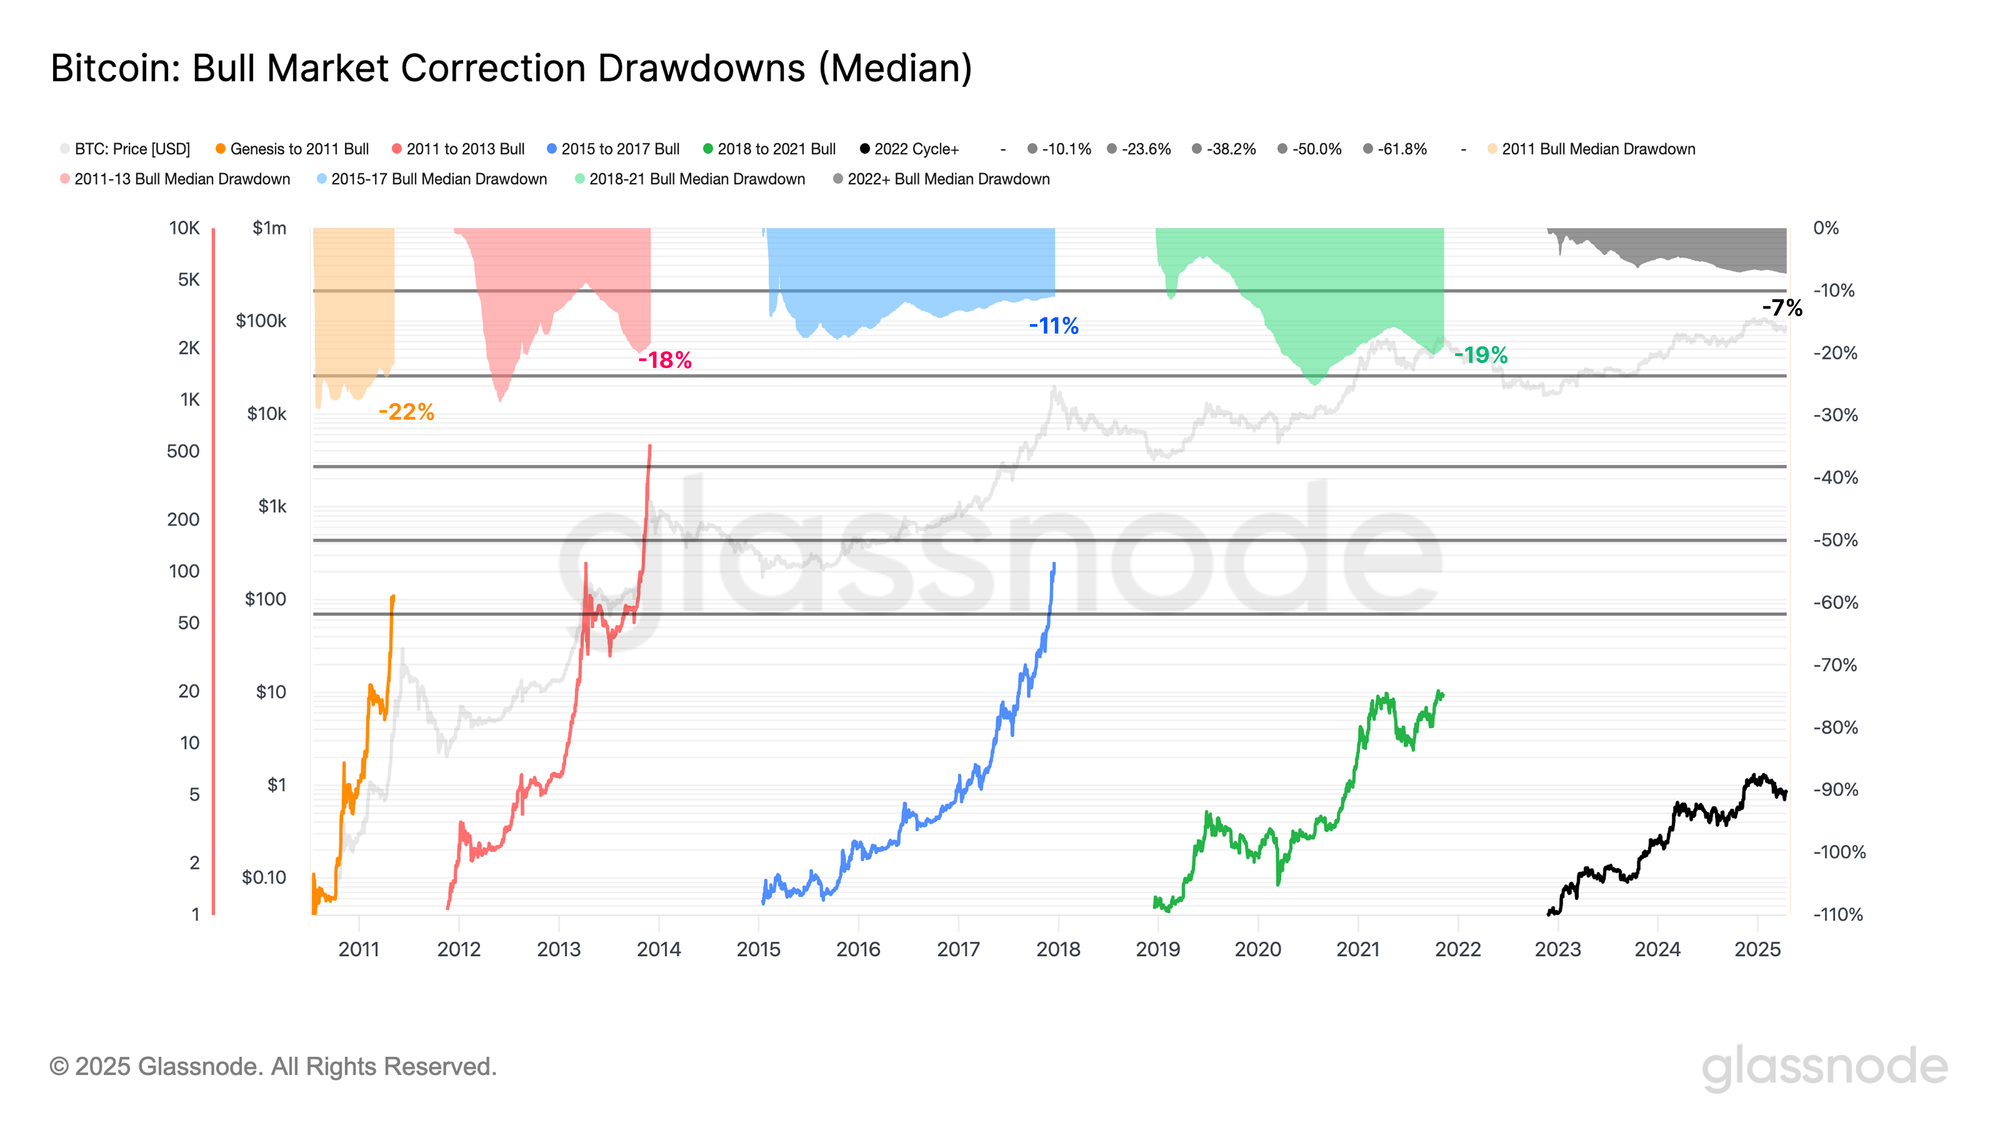
To quantify the resilience of the current cycle, we can assess the rolling median drawdown profile for all bull market structures.
- 2011: -22%
- 2011-13: -18%
- 2015-18: -11%
- 2018-21: -19%
- 2022+: -7%
The median drawdown for the current cycle is considerably shallower than all previous cases. Drawdowns since 2023 have been shallower and more controlled in nature, suggesting a more resilient demand profile, and that many Bitcoin investors are more willing to HODL through market turmoil.
Liquidity Continues to Contract
We can also assess how macro uncertainty has affected the liquidity profile of Bitcoin.
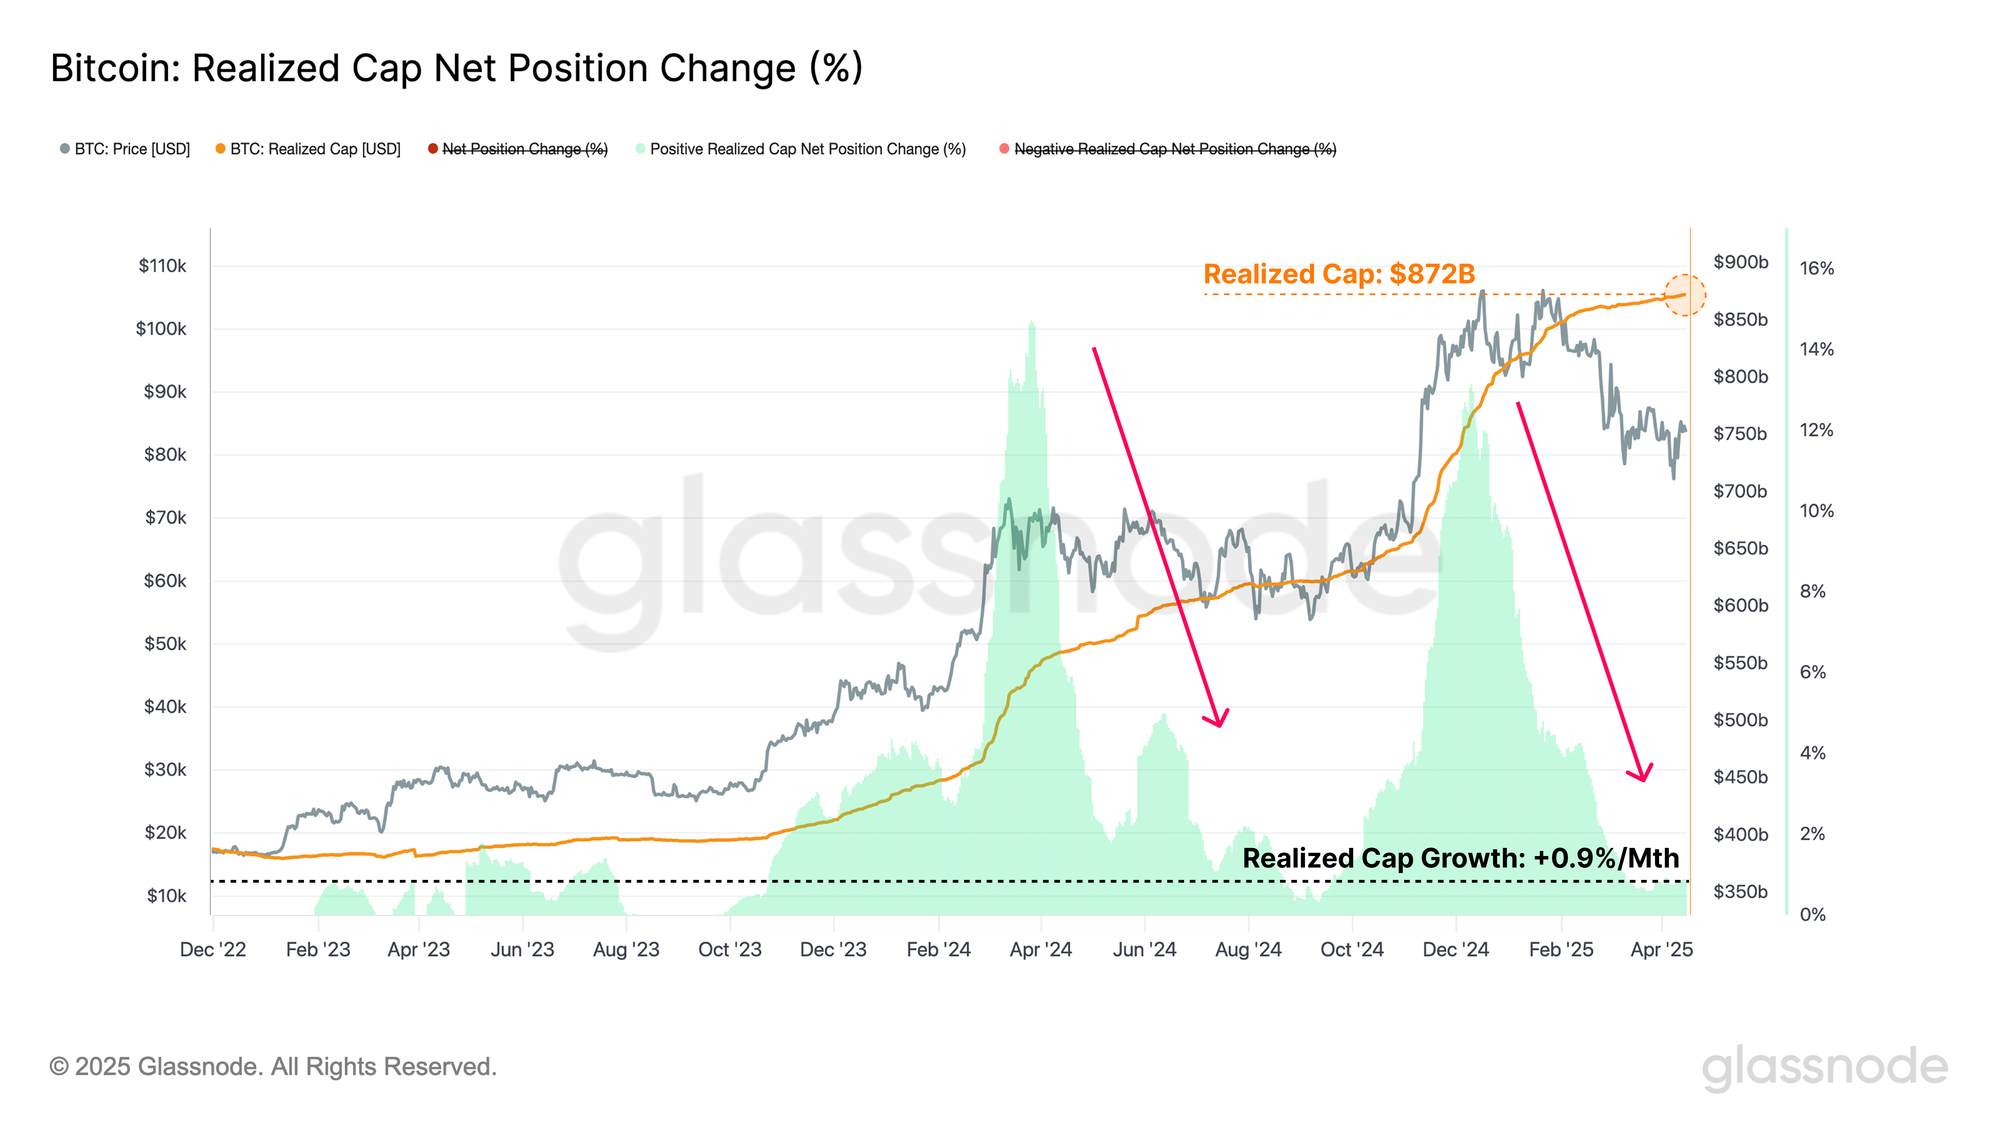
One way we can measure Bitcoins internal liquidity is via the realized cap metric, which calculates the cumulative netflow of capital into a digital asset. The realized cap is trading at an ATH value of $872B, however, the rate of capital growth has compressed to only +0.9% per month.
Amidst an extremely challenging market backdrop, it is impressive capital flows into the asset remain positive. Given the rate of fresh capital entering the asset is softening, it does also suggest that investors are currently less willing to allocate capital in the near-term, suggesting risk-off sentiment is likely to remain the default behavior for the time being.
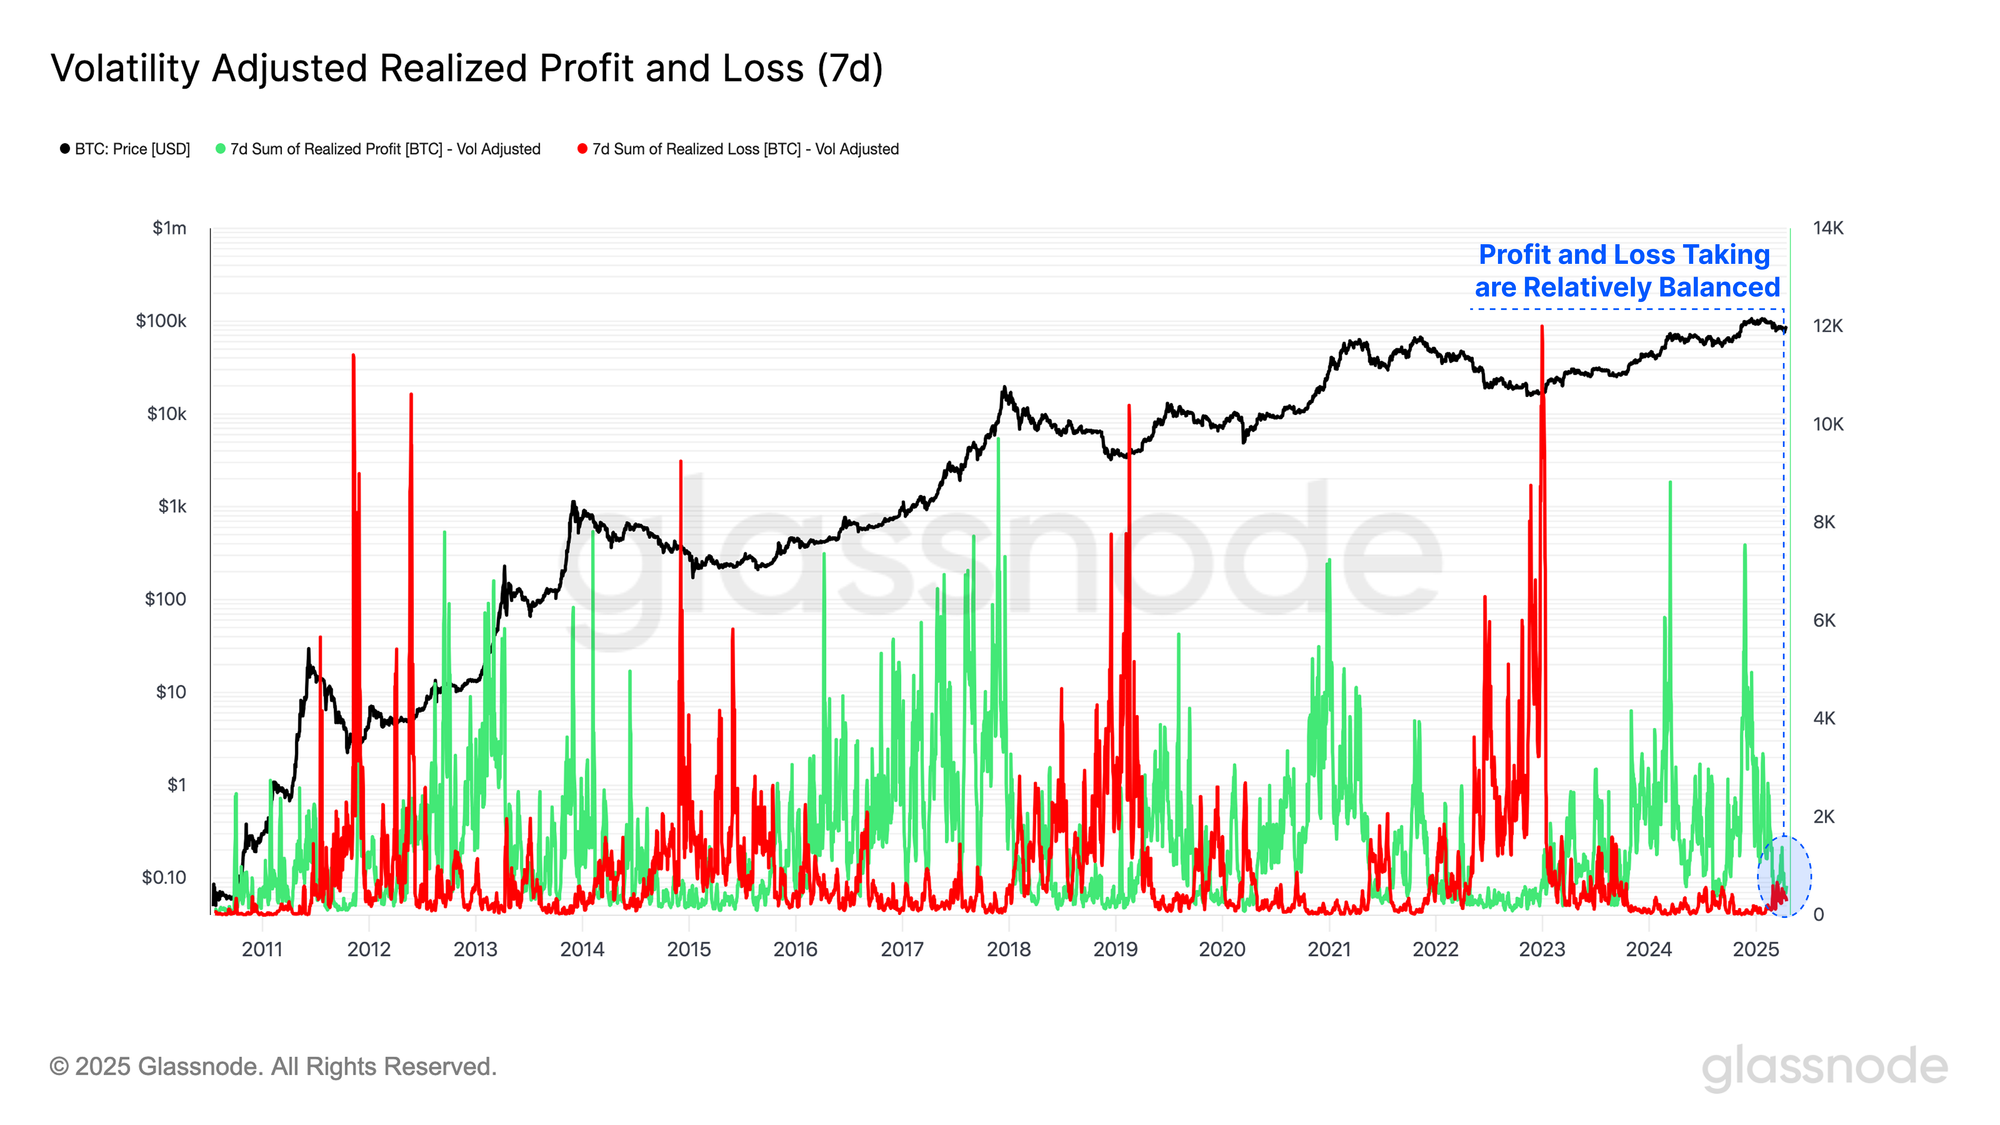
The Realized Profit and Loss metrics are the input components to the Realized Cap, enabling us to measure the difference between a coin’s acquisition price, and its value at the time it is spent on-chain.
- Coins spent above their acquisition price are considered to lock in Realized Profits.
- Coins spent below their acquisition price are considered to lock in Realized Losses.
By measuring Realized Profit and Loss in BTC terms, we can normalize all profit and loss-taking events relative to Bitcoin’s expanding market cap over cycles. Here, we introduce a new variant, which is further refined by adjusting for volatility (7-day realized volatility), helping to account for the diminishing returns and growth rate as Bitcoin matures over its 16-year history.
At the moment, profit and loss taking activities are relatively balanced, which results in the relatively neutral rate of capital inflow noted earlier. It could be argued that this reflects a saturation in investor activity within the current price range, and typically preempts a period of consolidation as the market tries to find a new equilibrium.
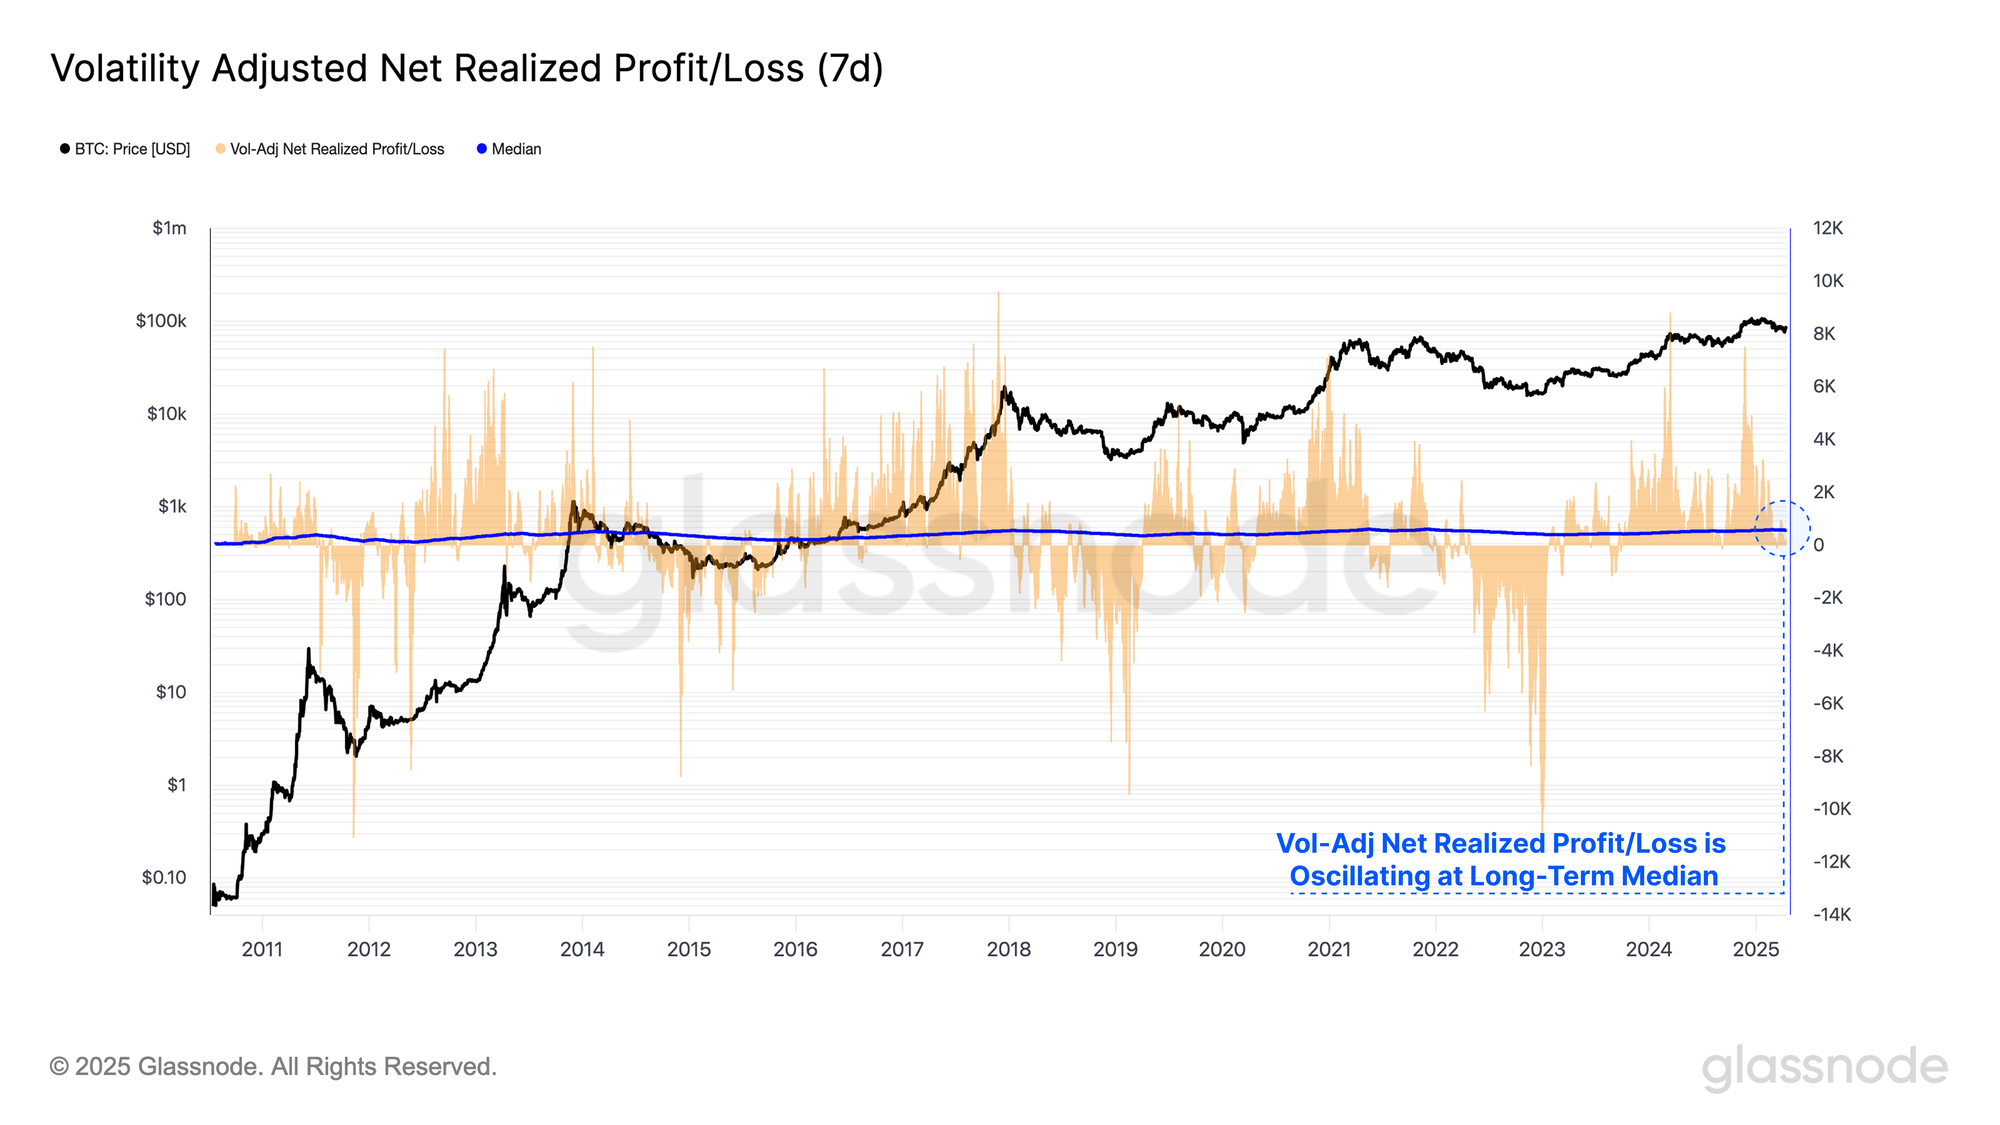
By calculating the difference between the Realized Profit and Realized Loss, we can produce the Net Realized Profit / Loss metric. This metric measures the directional dominance of value flowing in/out of the network.
Utilizing the volatility adjusted Net Realized Profit/Loss metric, we can compare it to the cumulative median, seeking to distinguish between two market regimes.
- Values consistently above the median typically signal a bull market, and net capital inflows.
- Sustained values below the cumulative median is typically considered a bear market, with Bitcoin experiencing net capital outflows.
Markets routinely drive investors to the brink of maximum pain, typically reaching a peak at the turning point between a bull and a bear cycle. We can see how the volatility-adjusted Net Realized Profit/Loss oscillates around its long-term median, acting as a mean reversion tool.
This metric has now reset back to its neutral median value, suggesting the Bitcoin market is now at a key decision point, and draws a line in the sand for the bulls to re-establish support in the current price range.
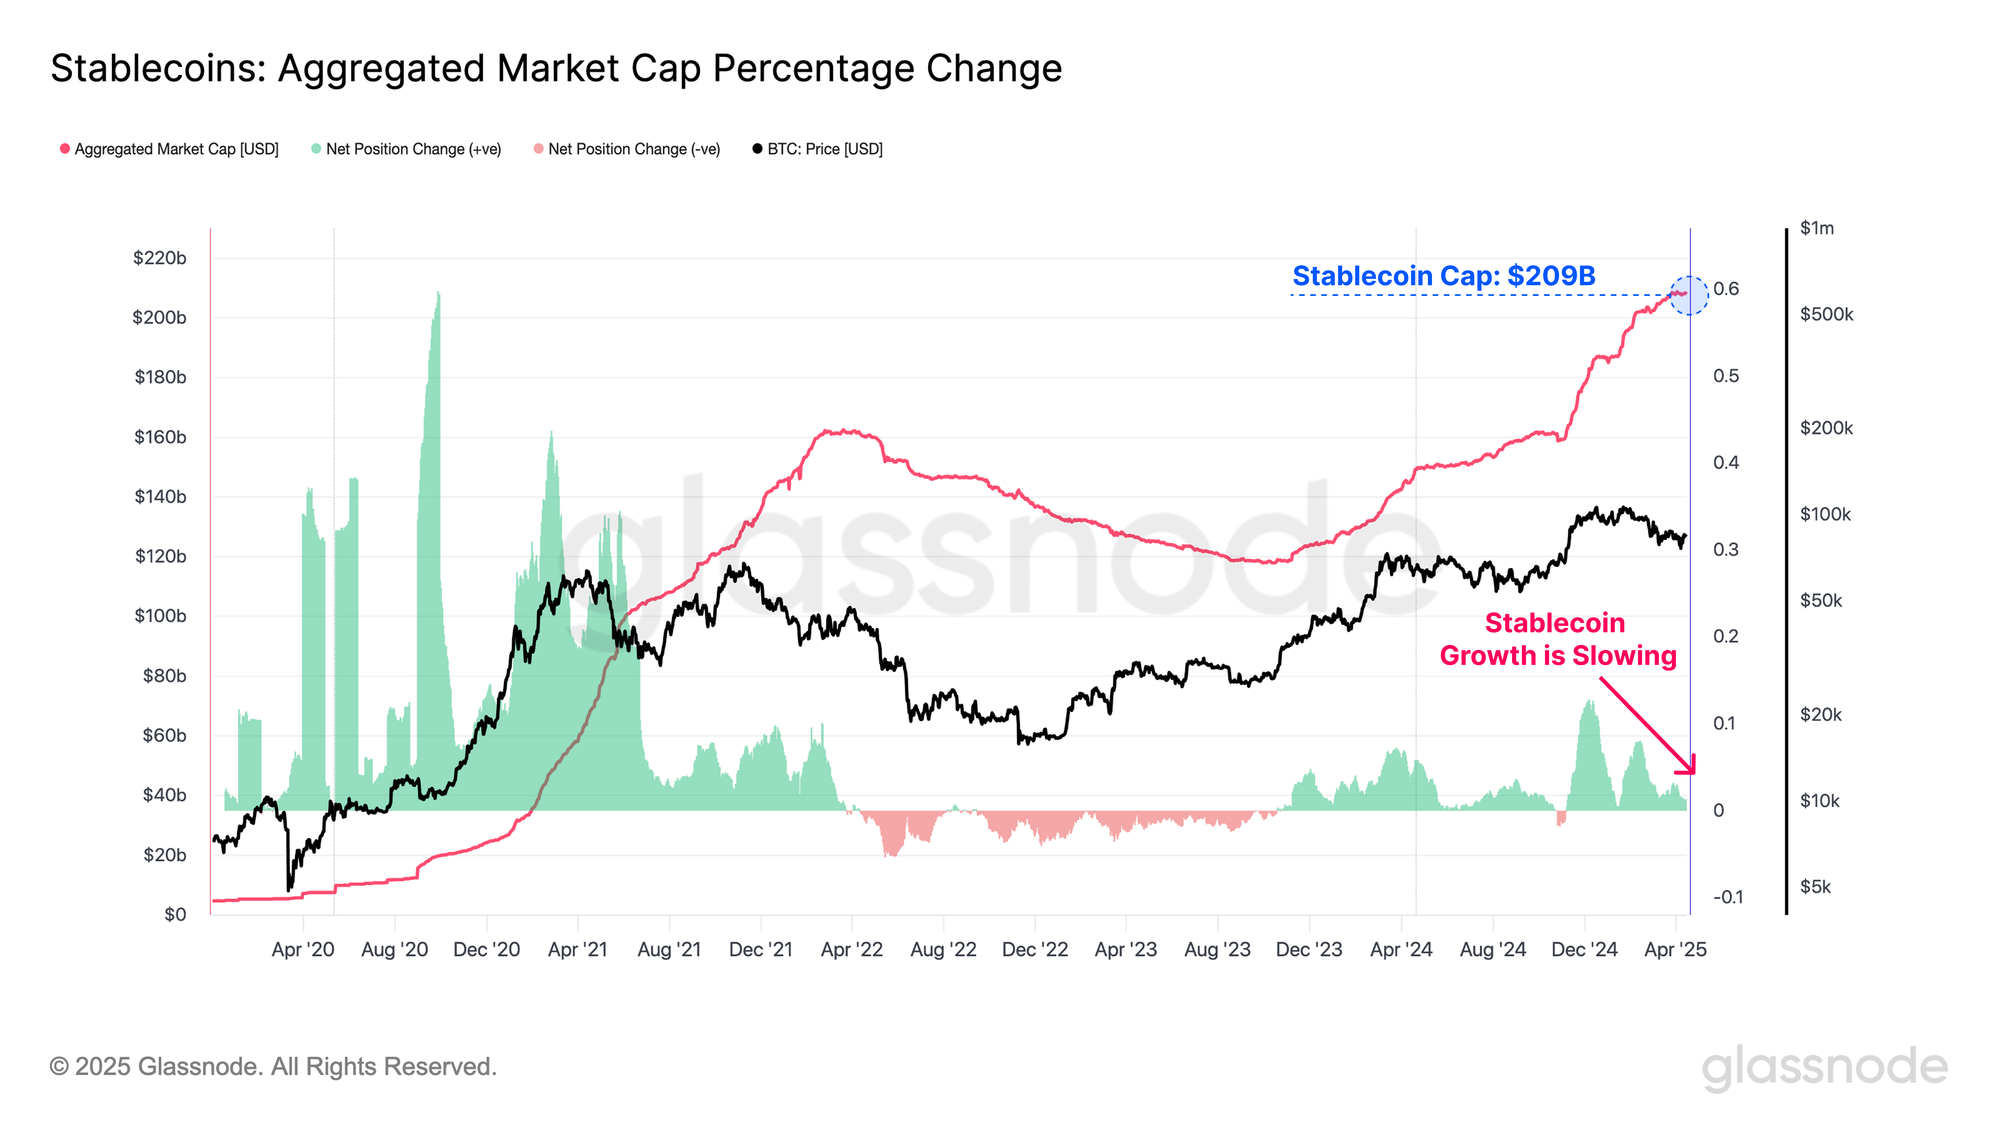
Stablecoins have become a foundational asset class within the digital asset ecosystem, acting as the quote asset for trading on both centralized, and decentralized trading venues. Assessing liquidity through the lens of stablecoins provides an additional dimension to our analysis, providing a holistic lens into the digital asset liquidity profile.
The growth of stablecoin supplies remains positive, but is softening in recent weeks. This provides an additional layer of confluence that there has been a contraction in broader digital asset liquidity, as measured via a softer demand for digitally native dollars.
Inspecting Investor Pressure
Amid ongoing market turbulence, it's important to evaluate the scale of unrealized losses currently held by Bitcoin investors.
When measuring the unrealized loss held by the market, we note that unrealized losses have reached a new ATH of $410B during the market decline to $75k. When we inspect the composition of unrealized losses, we can see that the majority of investors are holding drawdowns of up to -23.6%.
The total magnitude of unrealized losses are larger in magnitude when compared to the May 2021 sell-off and the 2022 bear market. However, it is worth noting that on an individual investor level, the market endured far steeper drawdowns of up to -61.8% and -78.6%, respectively.
Whilst the total unrealized losses are larger (given Bitcoin is a larger asset today), individual investors are less challenged today compared to prior bear market periods.

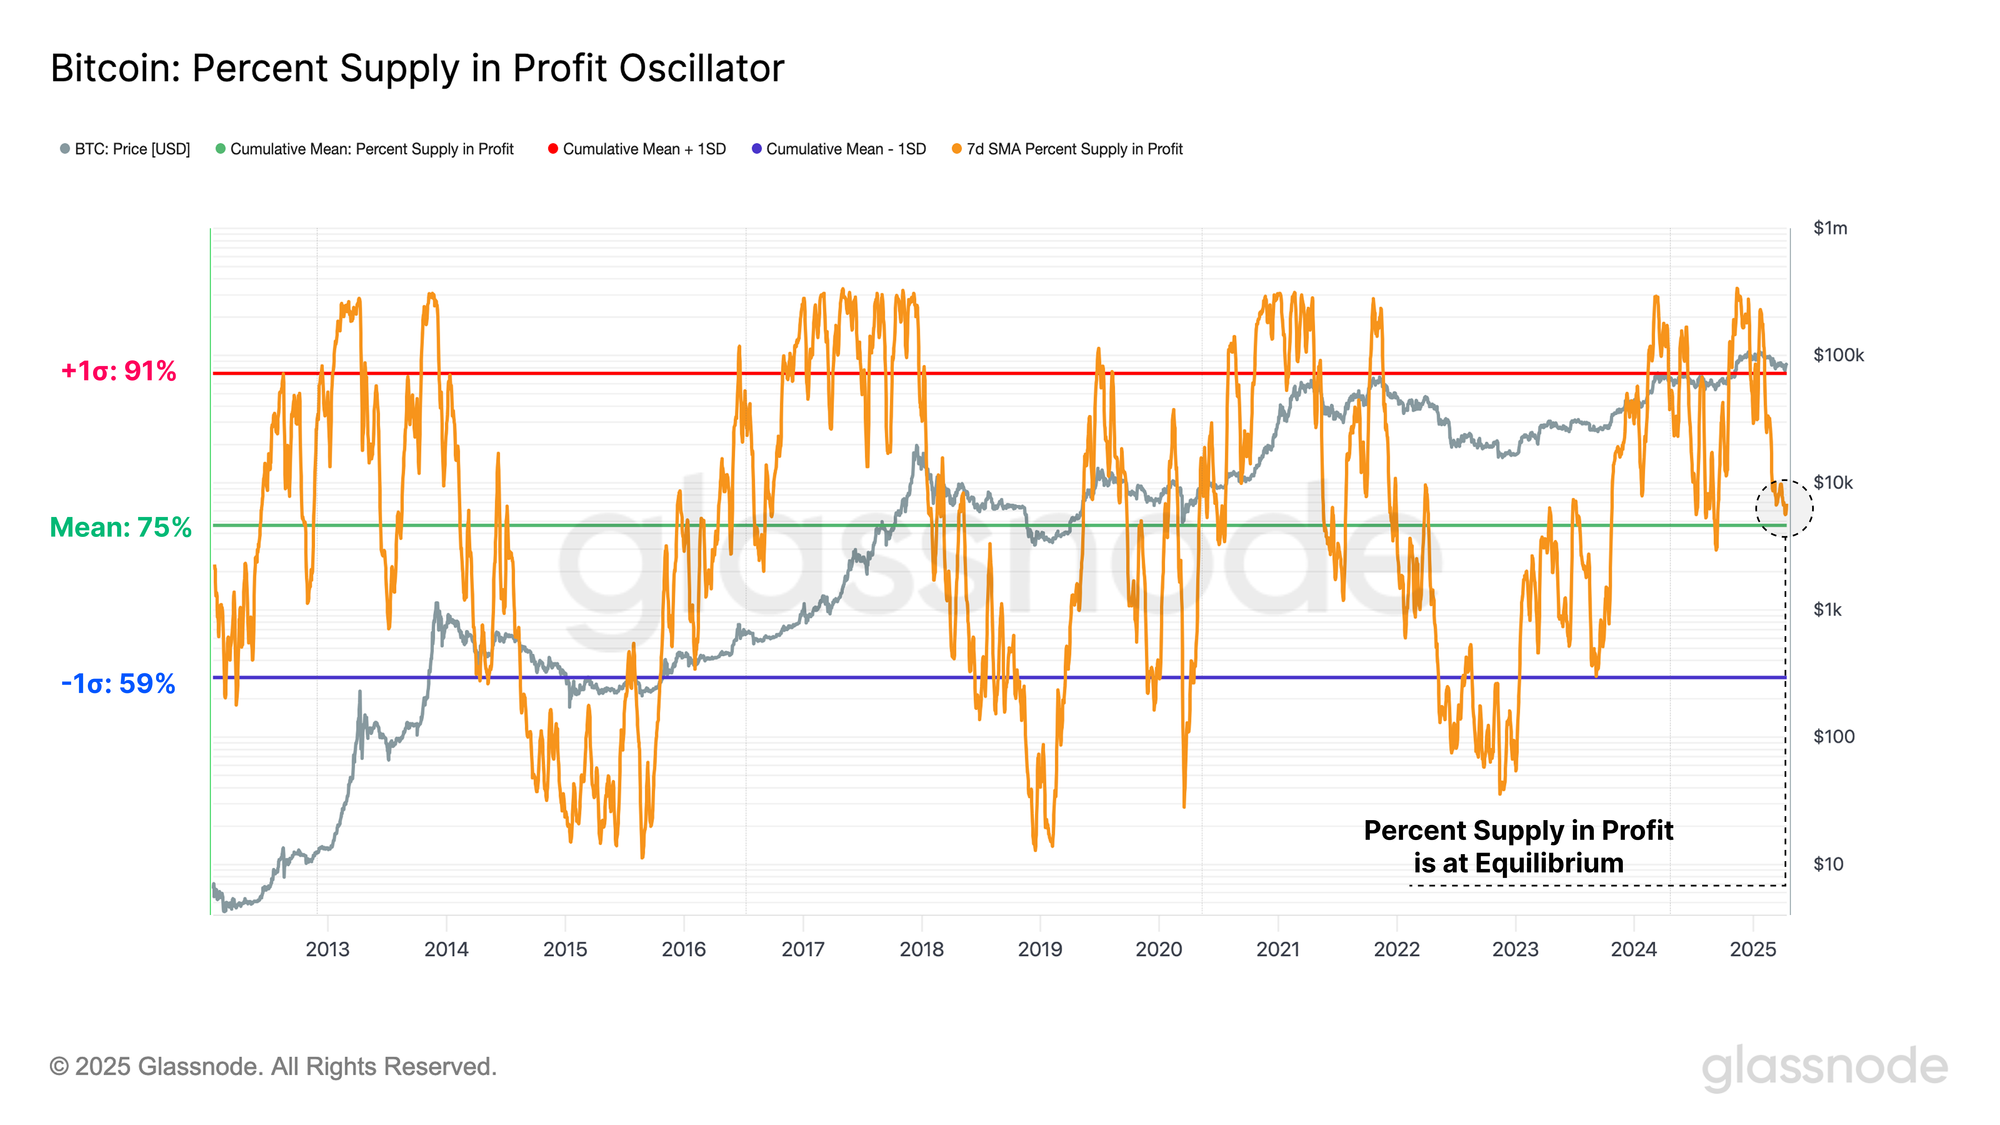
Despite the ATH in unrealized losses held, the percentage of the circulating supply held in a profitable position remains elevated at a value of 75%. This suggests the majority of underwater investors have been new buyers across the topping formation.
Of interest, the percent supply in profit is approaching its long-term mean. Historically, this this is a key area to defend before a super majority of coins fall into loss and a critical threshold between bull and bear market structures.
- Bull markets are typically characterized with the supply in profit above its long-term mean, routinely finding support at this level across the regime.
- Bear markets are historically punctuated with deep and sustained periods below the long-term mean, with frequent rejections at this level confirming the decline in profitability.
Similarly to the Net Realized Profit/Loss metric, a rebound off of the long-term average band would be a positive observation if defended.
As the market continues to contract, it's reasonable to expect the absolute size of unrealized losses to grow. To account for this and normalize across drawdowns of varying magnitudes, we introduce a new variant of the metric: Unrealized Loss per Percent Drawdown, which expresses losses held in BTC terms relative to the percentage decline from the all-time high.
Applying this metric to the Short-Term Holder cohort reveals that their unrealized losses, when adjusted for the depth of the drawdown, are already substantial and comparable to levels observed during prior bear market onsets.
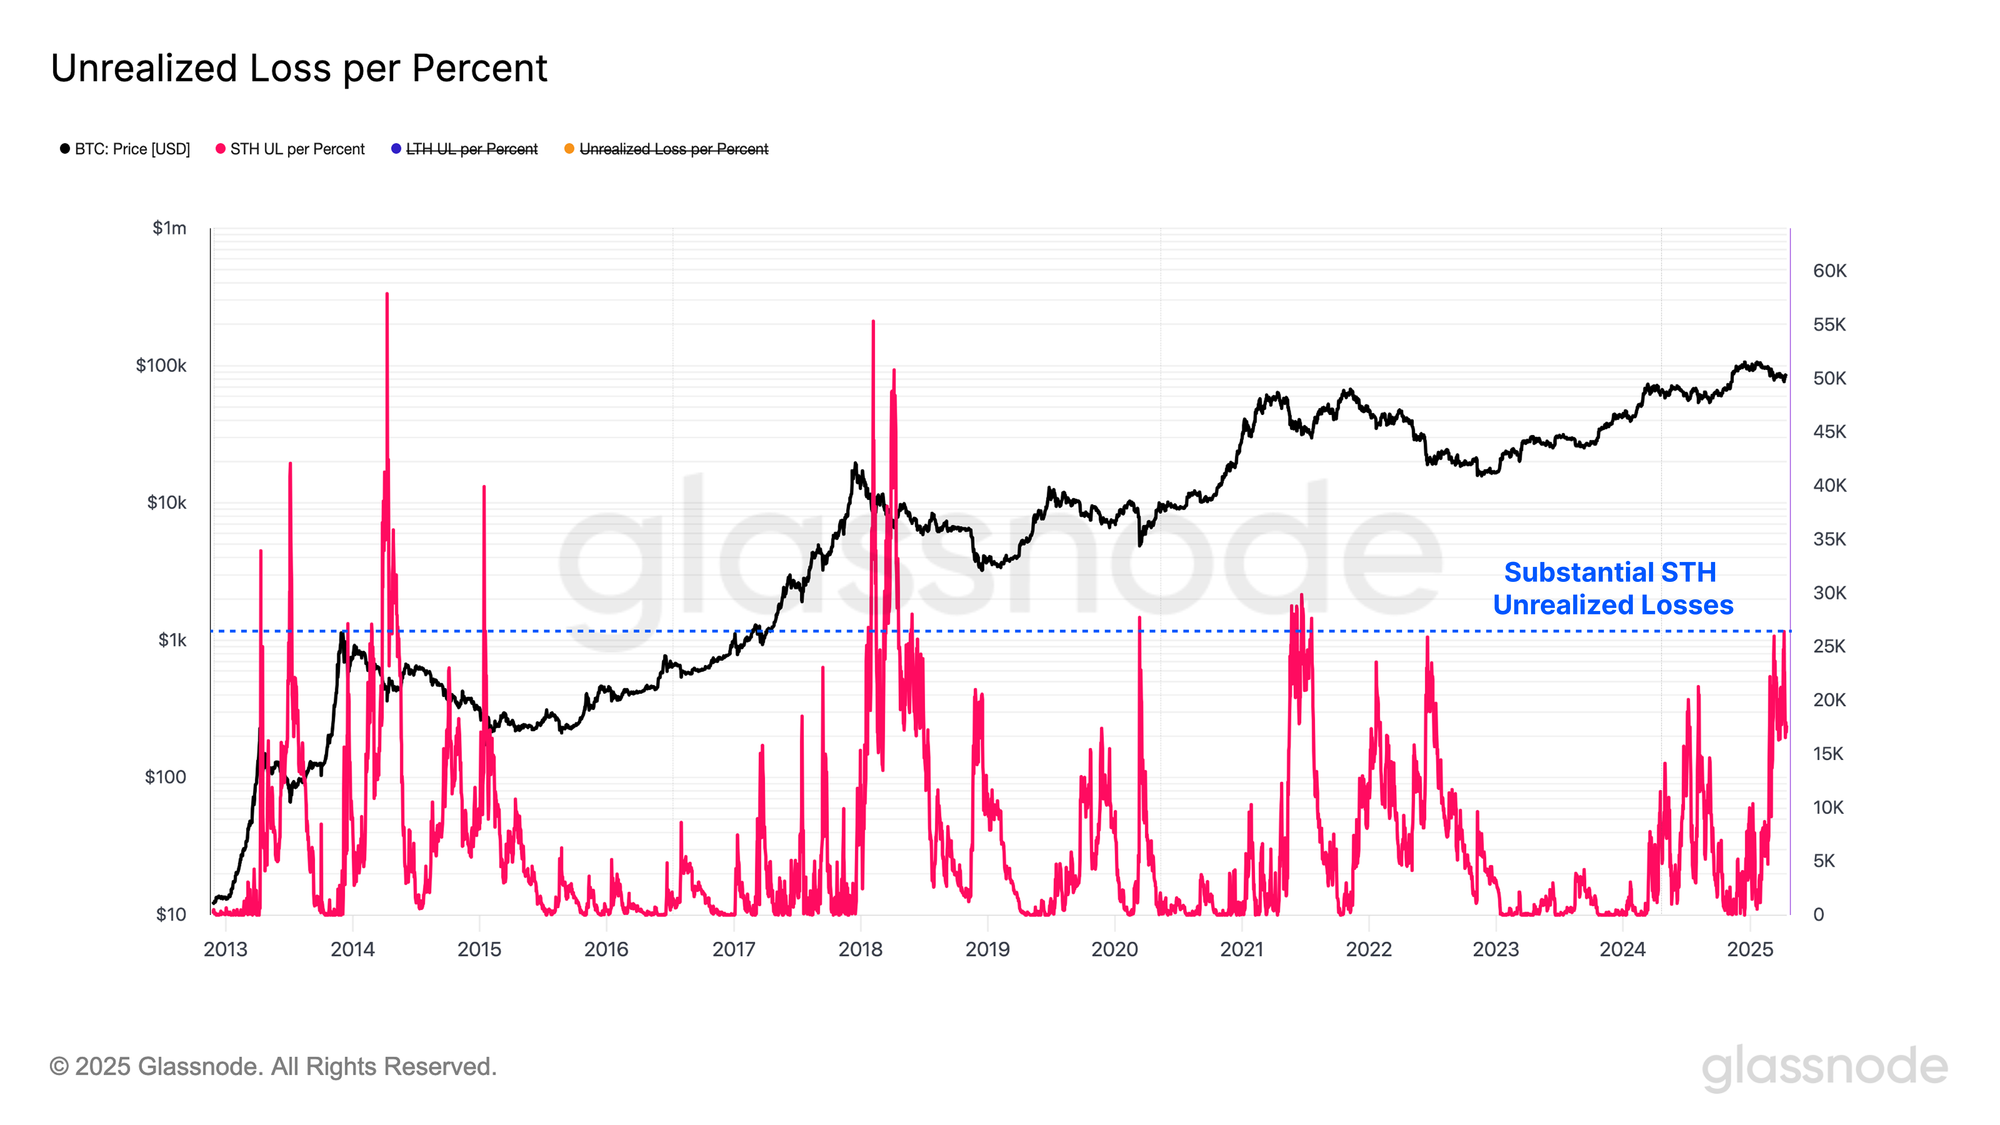
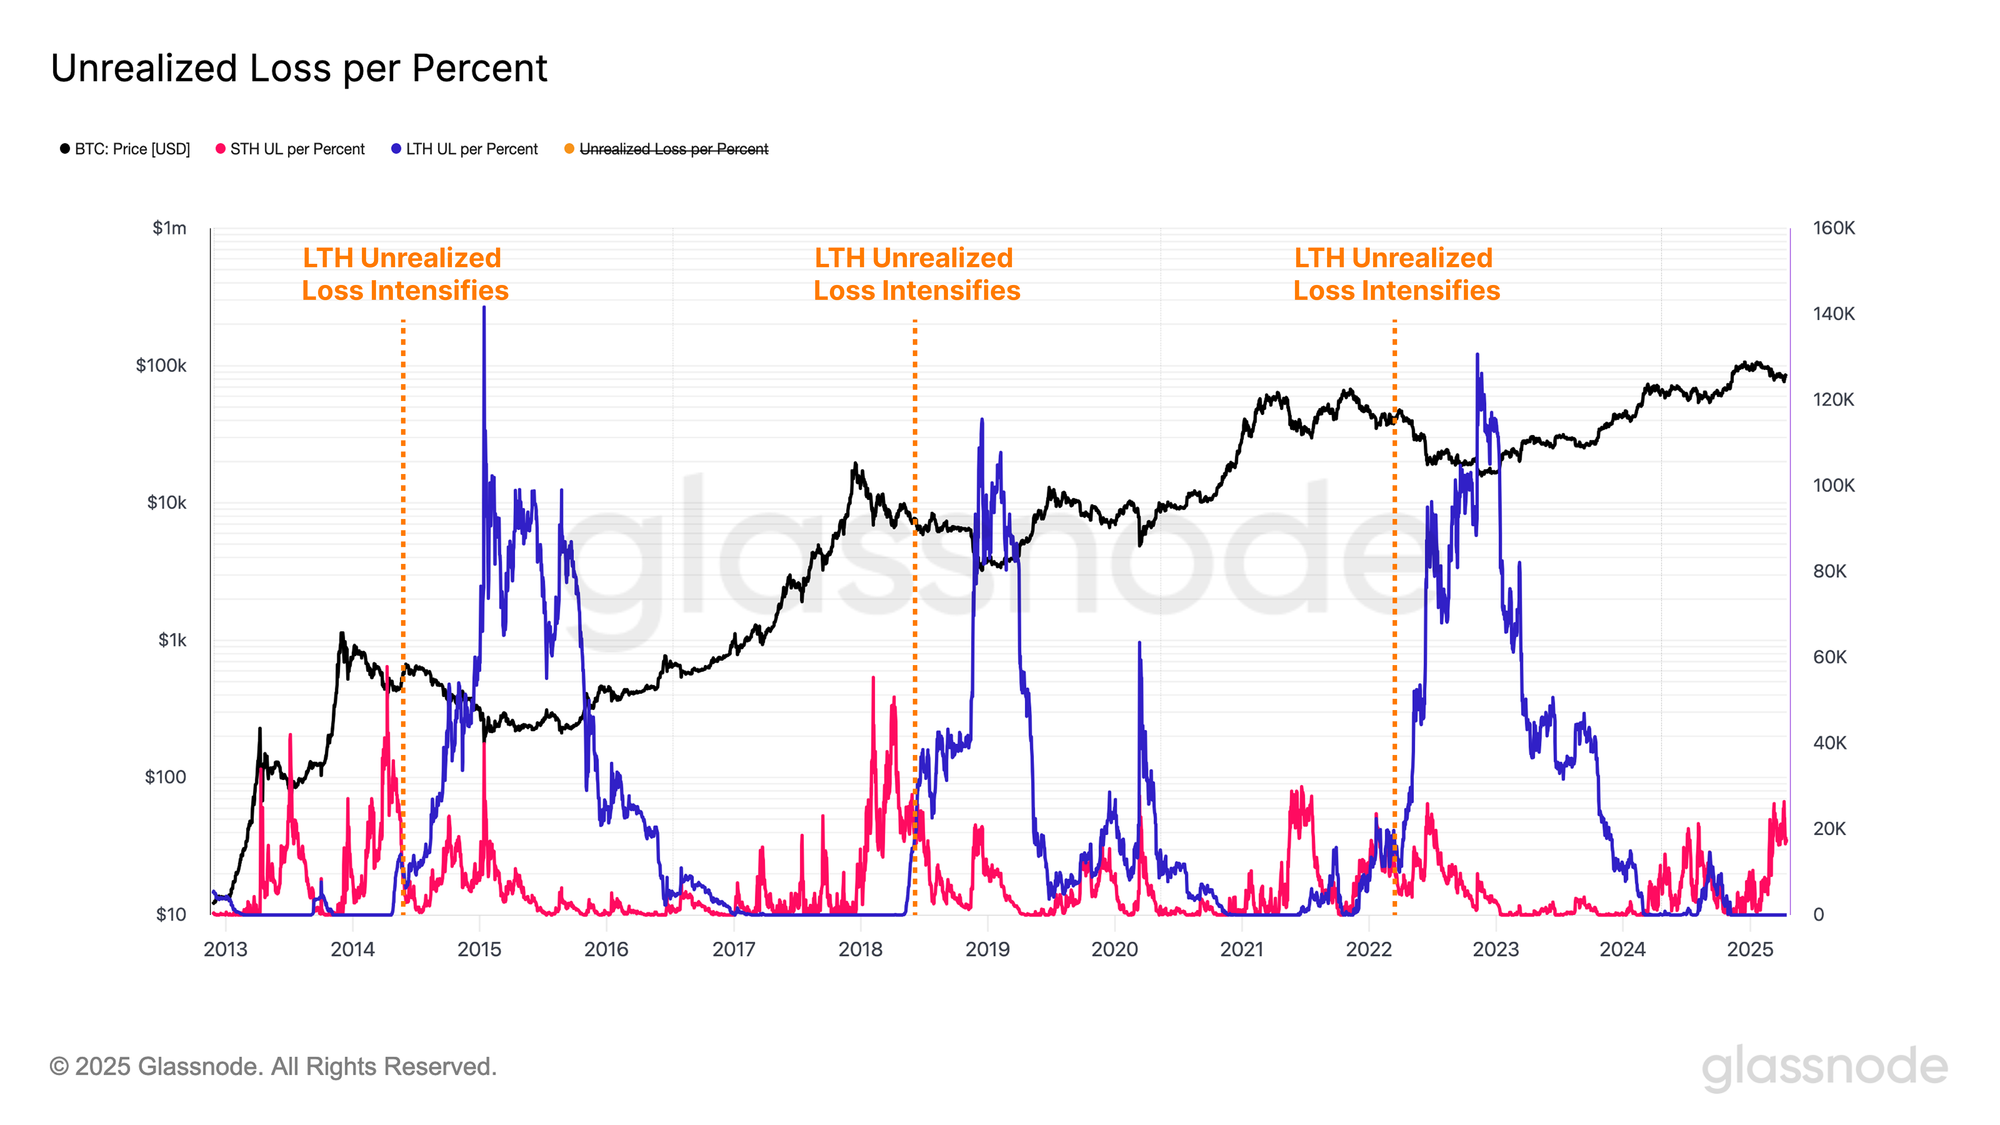
Nevertheless, current unrealized losses are largely concentrated among newer investors, while long-term holders remain in a position of unilateral profitability. However, an important nuance is emerging, as recent top buyers age into long-term holder status, as noted in WoC 12, the level of unrealized loss within this cohort is likely to increase.
Historically, substantial expansions in unrealized losses among long-term holders have often marked the confirmation of bear market conditions, albeit with a delay following the market peak. As of now, there is no clear evidence to suggest such a regime shift is underway.
Summary and Conclusion
The macroeconomic landscape remains uncertain, marked by ongoing shifts in global trade dynamics which have fueled substantial volatility across U.S Treasury and equity markets. Notably, the performance of both Bitcoin and Gold in particular have remained remarkably robust across this challenging period. One could consider this a fascinating signal as the foundations of the financial system enter a period of transition and change.
Despite Bitcoin’s noteworthy resilience, it has not been immune to the heightened volatility seen across global markets, marking its largest drawdown of the 2023–2025 cycle. This has greatly affected newer market participants, who now hold the lions share of market losses. However, from an individual investor perspective, the market has endured far more severe drawdowns in prior cycles, notably during the May 2021 and 2022 bear markets. In addition, mature and tenured investors remain unfazed by the ongoing economic stress, and reside in a position of near unilateral profitability.
Disclaimer: This report does not provide any investment advice. All data is provided for informational, and educational purposes only. No investment decision shall be based on the information provided here and you are solely responsible for your own investment decisions.
Exchange balances presented are derived from Glassnode’s comprehensive database of address labels, which are amassed through both officially published exchange information and proprietary clustering algorithms. While we strive to ensure the utmost accuracy in representing exchange balances, it is important to note that these figures might not always encapsulate the entirety of an exchange’s reserves, particularly when exchanges refrain from disclosing their official addresses. We urge users to exercise caution and discretion when utilizing these metrics. Glassnode shall not be held responsible for any discrepancies or potential inaccuracies.
Please read our Transparency Notice when using exchange data.
- Join our Telegram channel.
- For on-chain metrics, dashboards, and alerts, visit Glassnode Studio.