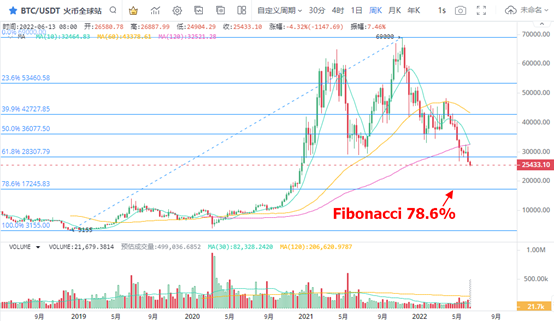
1、 BTC unilateral decline continued
After the closing price of BTC fell for the seventh consecutive trading day, the price is rapidly entering a new fluctuation range. The short-term retreat trend is clear, and BTC is experiencing a typical unilateral decline.
After BTC fell below USD 28307 corresponding to 61.8% of Fibonacci, the weekly price has been below the supporting price within one year. Therefore, the lower price range is opening. BTC is above the $17245 corresponding to 78.6% of Fibonacci. The lowest support frame in this period is $17245, which is the largest price range expected to be corrected.
In terms of trading volume, the weekly trading volume performance of BTC is relatively flat, and the overall trading volume level is lower than the weekly performance before the middle of 2021. The reduction in volume means that the turnover of BTC is relatively moderate, so the price may continue to decline for a long time.
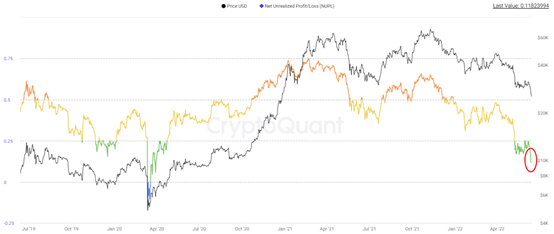
2. BTC's profit / loss ratio decreased significantly
The BTC price is currently running around us $25000. The ratio of unrealized gains to unrealized losses in the same period was 0.118 on June 12, which is lower than most trading days since 2020. At the same time, there is still a big gap compared with the lowest level -0.17 of nupl in march2020. In addition, the average value of nupl index in March, 2020 is also above 0. Therefore, in terms of absolute value, nupl index has been running at a low level. That is to say, under the background of a large number of growth of loss making investors, the failure to realize the growth of losses means that more loss making investors insist on holding money under the overall hold, indicating strong confidence in the market. At the same time, it means that this part of unrealized losses has the risk of low price flight, or will bring higher selling pressure on the BTC price.
3. Eth horizontal plate below pressure level
The weekly K-line chart shows that the ETH price is within the key low price range, and the USD 1106 corresponding to 78.6% of Fibonacci is the lowest point in this range. In terms of trading volume, after the fall of short-term eth volume, the weekly trading volume has a large expected growth space. In fact, whether eth can get the bottom signal during the unilateral decline depends on the buying energy of the bulls to undertake the selling pressure. At present, the weekly trading volume of eth still has nearly 100% growth space from the historical maximum. Therefore, the bottom confirmation process is relatively slow.
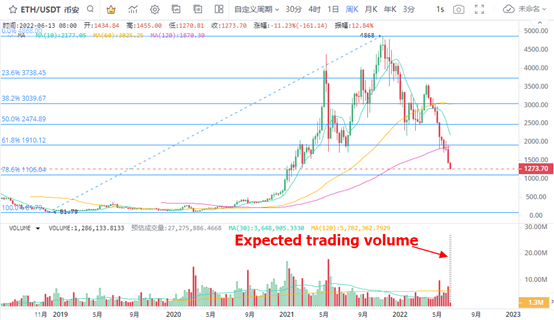
4. The main trading heat of eth is rising rapidly
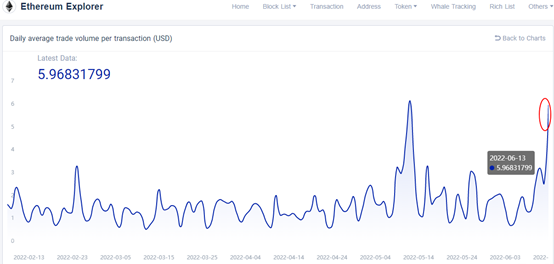
Judging from the average transaction volume of eth, the current value has reached a peak of $5.96, which means that the main short-term participation has been significantly increased. In the ETH price trend, it has experienced an unprecedented continuous and large-scale decline. At present, the main force may have taken the initiative to reduce the number of coins in the selling stage. Similar to May 12, the current turnover rate of eth funds per transaction is a recent high, which means that the short-term downward trend of eth has accelerated, and the market is expected to continue the strong earthquake.
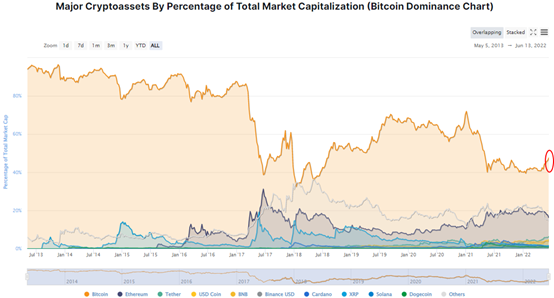
5. The market value of BTC accounts for 47.2%
With the continuation of the adjustment, the market value of BTC rose again, reaching 47.2% on June 13. In the same period, the market value of eth continued to retreat, and now it has dropped to 15.4%. Historically, BTC accounted for 55% of the market value in the bear market stage. For example, on december7,2018, the market value of BTC reached 55.2%. From this point of view, the overall market bear market still has a long way to go.