Here’s how the current Bitcoin rally stacks up against the previous ones in terms of the drawdowns it has experienced so far.
The Current Bitcoin Rally Has Seen A Peak Drawdown Of -18.6% So Far
In a recent tweet, the on-chain analytics firm Glassnode compared the latest Bitcoin rally with the ones seen throughout the entire history of the cryptocurrency.
Generally, rallies are compared using metrics like the percentage price uplifts recorded during them or the amount of time that they lasted (which may be measured in terms of the blocks produced, as is done when looking at cycles in terms of halvingsere, however, Glassnode has taken a different approach that provides a new perspective on these rallies.
The comparison basis between the price surges here is the drawdowns that each of them experienced across their spans. Note that these drawdowns aren’t to be confused with the cyclical drawdowns that are used to measure how the price has declined since the bull run top.
The drawdowns in question are the obstacles that the cryptocurrency encountered while the rallies were still ongoing, and are hence, those that the coin eventually managed to overcome.
Here is a chart that shows the degree of drawdowns that each of the historical bull markets experienced, and also where the current rally stands in comparison to them:
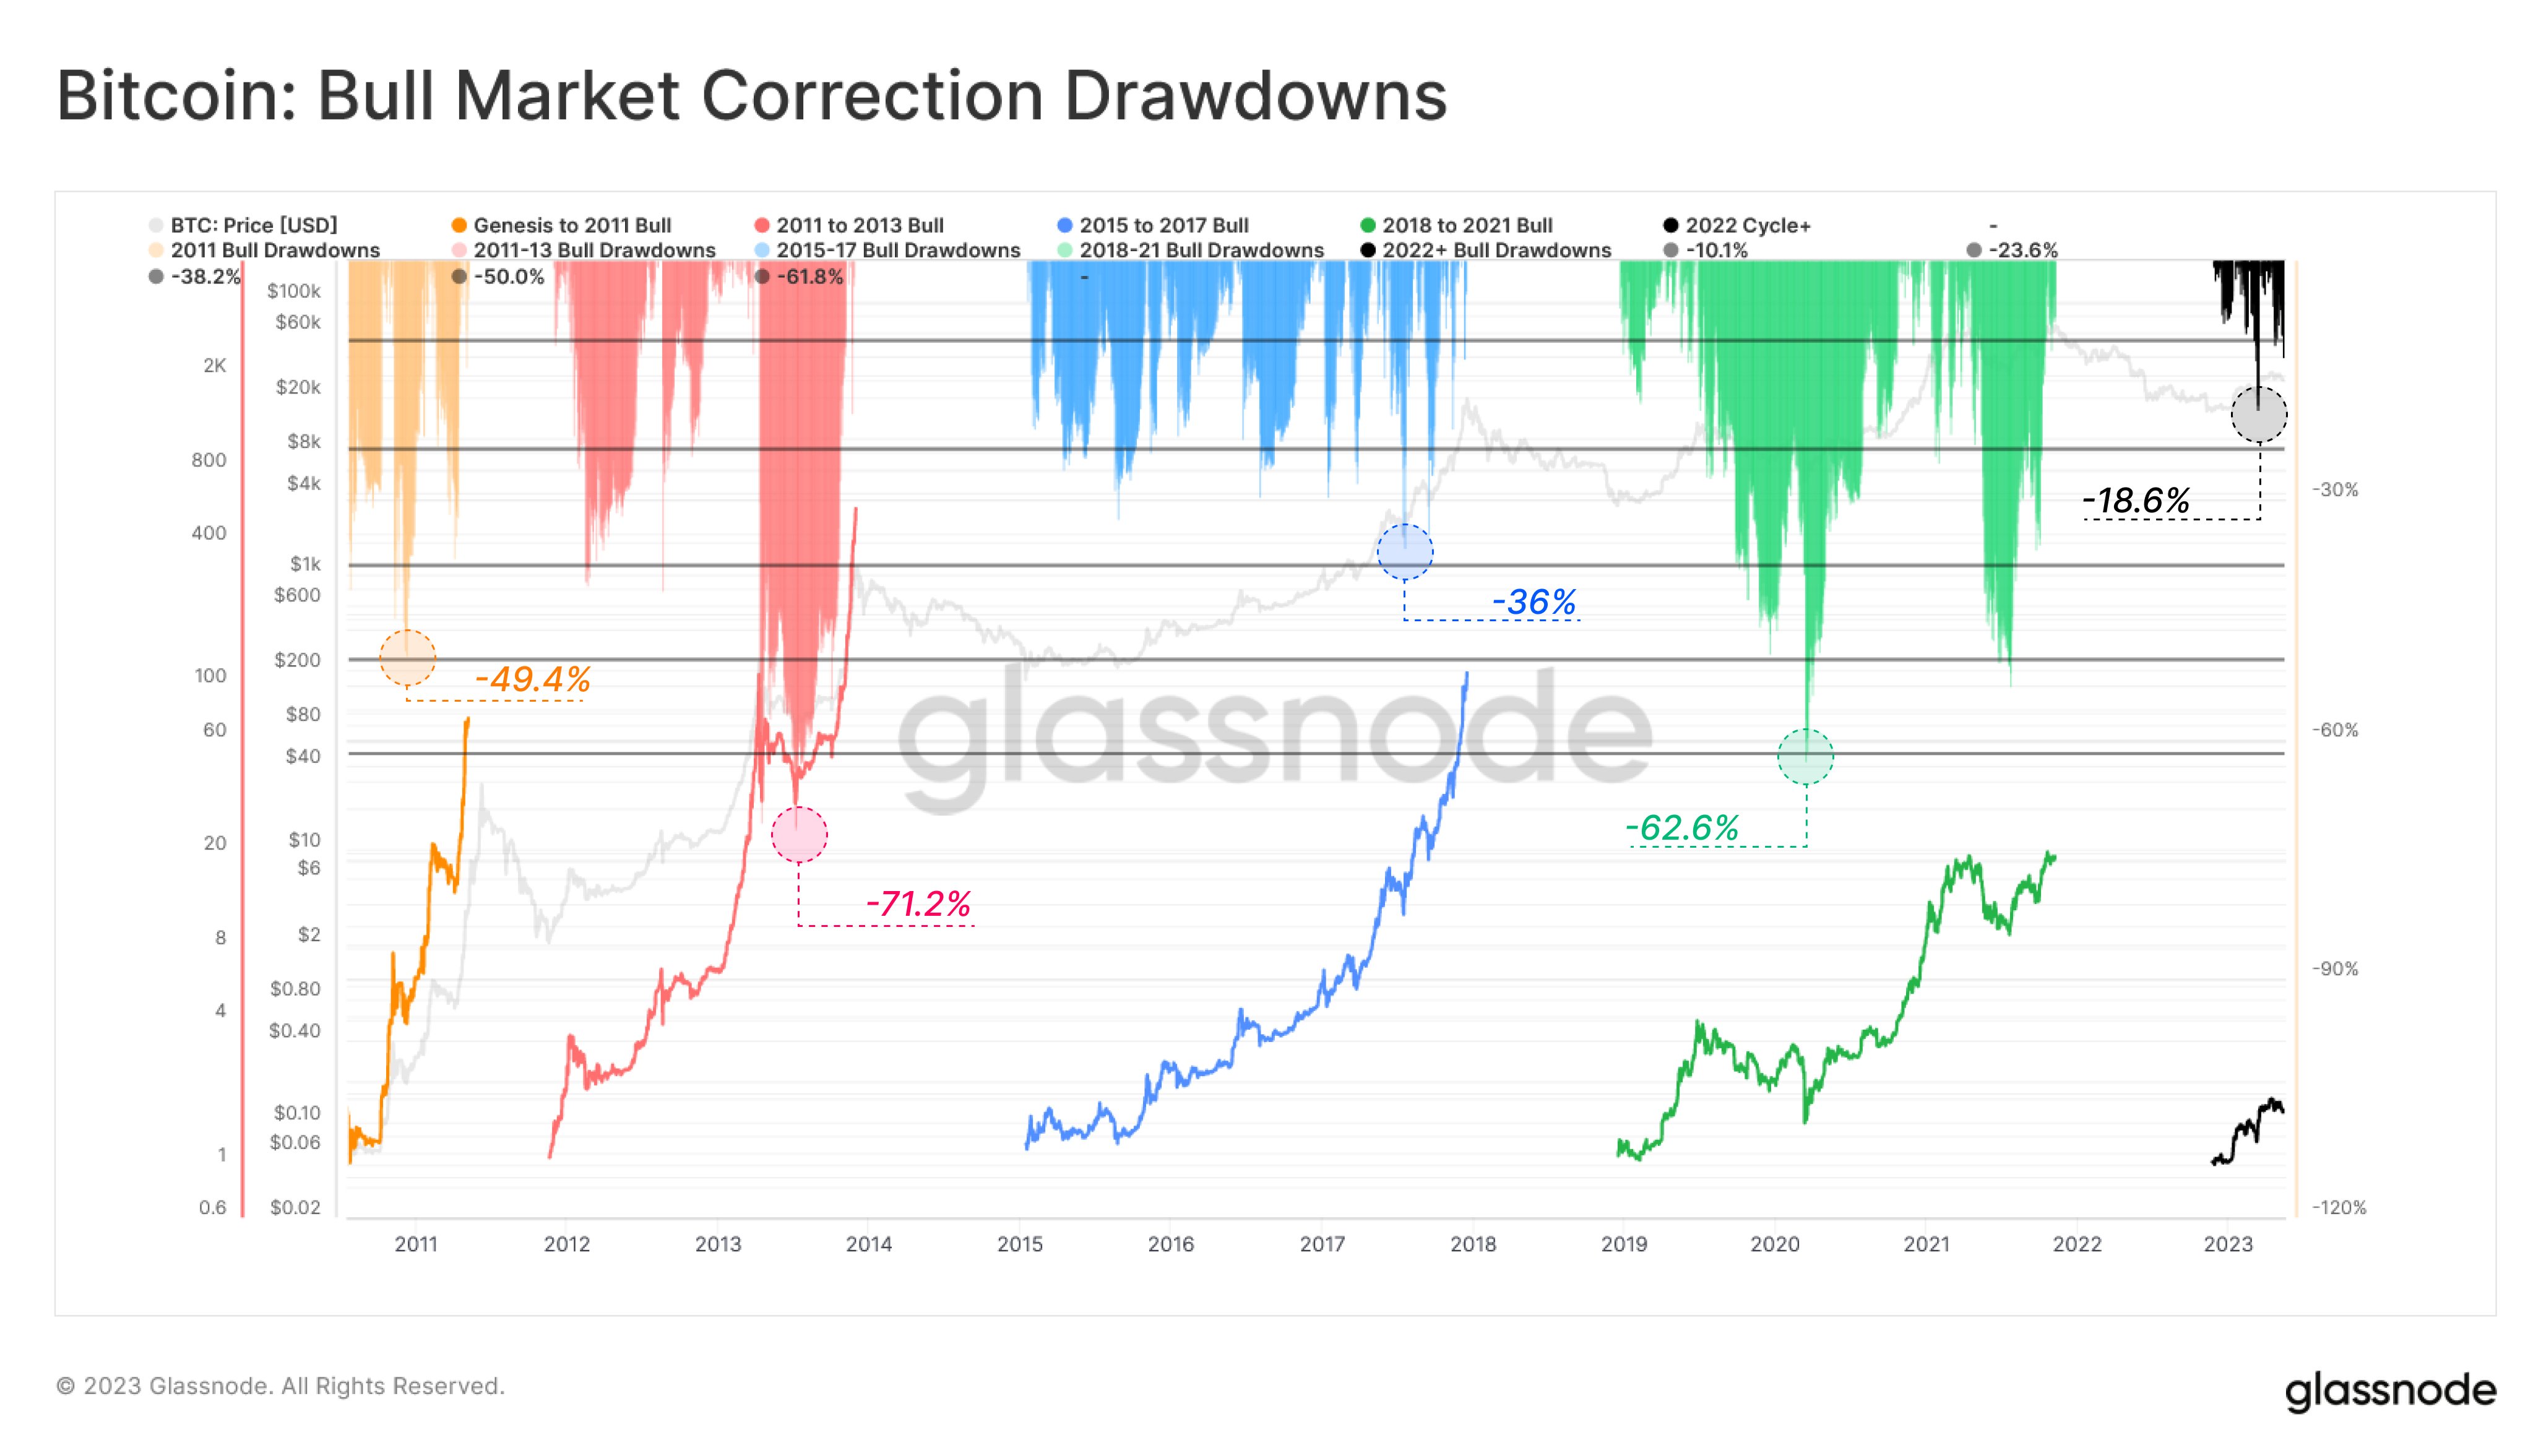
Looks like the value of the metric hasn't been too high for the latest rally so far | Source: Glassnode on Twitter
The five bull rallies here are as follows: genesis to 2011 (the very first rally), 2011-2013, 2015-2017, 2018-2021 (the last rally), and 2022 cycle+ (the ongoing one).
The analytics firm here has taken the bottom of each of the bear markets as the start of the next bull rallies. This means that parts of the cycle that some may not consider as part of the proper bull run are also included.
The main example of this would be the April 2019 rally, which is often considered its own thing but is clubbed with the last Bitcoin bull market in the above chart.
From the graph, it’s visible that the deepest drawdown that occurred during the first bull market measured around -49.4%. The next run, the 2011 to 2013 bull, experienced an even larger obstacle of a -71.2% plunge midway through it.
The next one (2015-2017) then only saw a drawdown of -36%, but the drawdown was again up at -62.6% for the run that followed it (that is, the latest bull market).
So far in the 2022+ Bitcoin bull market (which would only be considered a bull market at all if the November 2022 low was truly the cyclical bottom), the deepest drawdown observed so far is the March 2023 plunge of -18.6%.
Clearly, the drawdown seen in the current rally so far is significantly lesser than what the historical bull markets face. If the pattern of the past runs holds any weight at all, then this would mean that the current bull market should still have more potential to grow.
At the time of writing, Bitcoin is trading around $26,900, down 2% in the last week.
BTC has been moving sideways recently | Source: BTCUSD on TradingView
Featured image from iStock.com, charts from TradingView.com, Glassnode.com