Share
- Share
- Tweet
-
ambcrypto发布于2026-02-08更新于2026-02-08
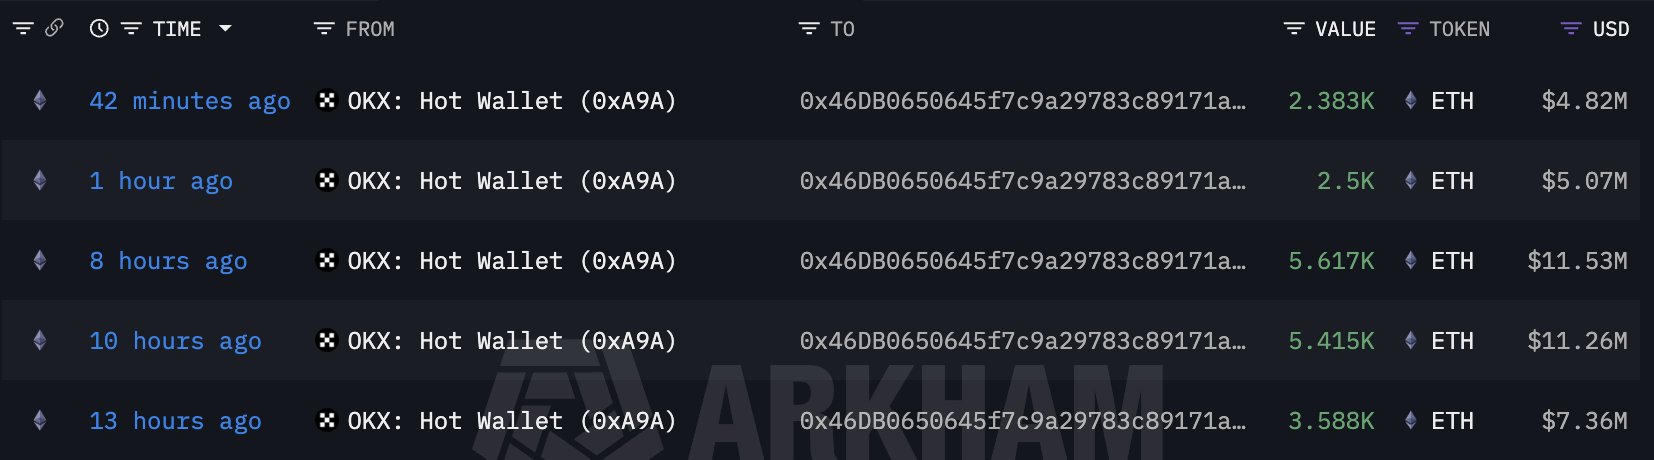
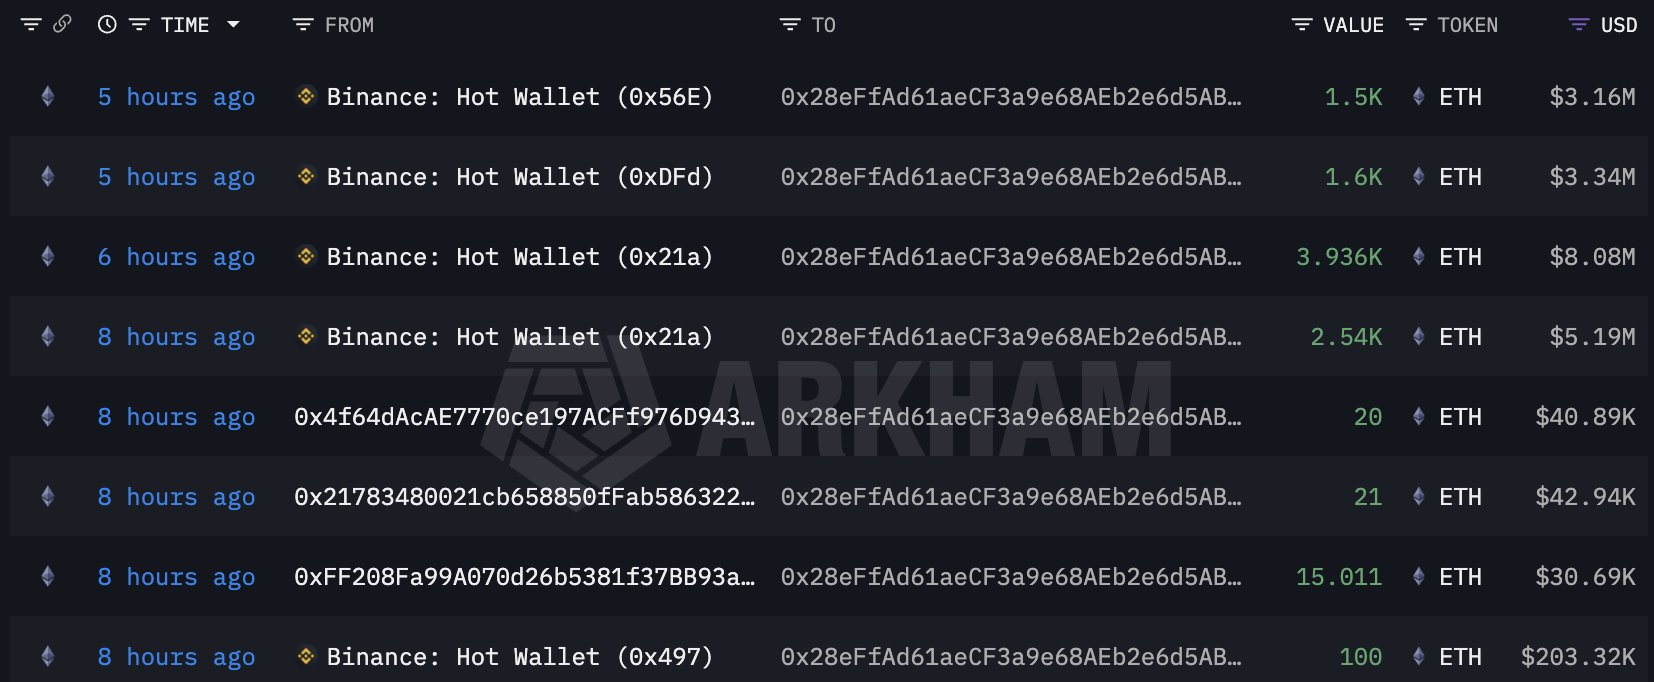
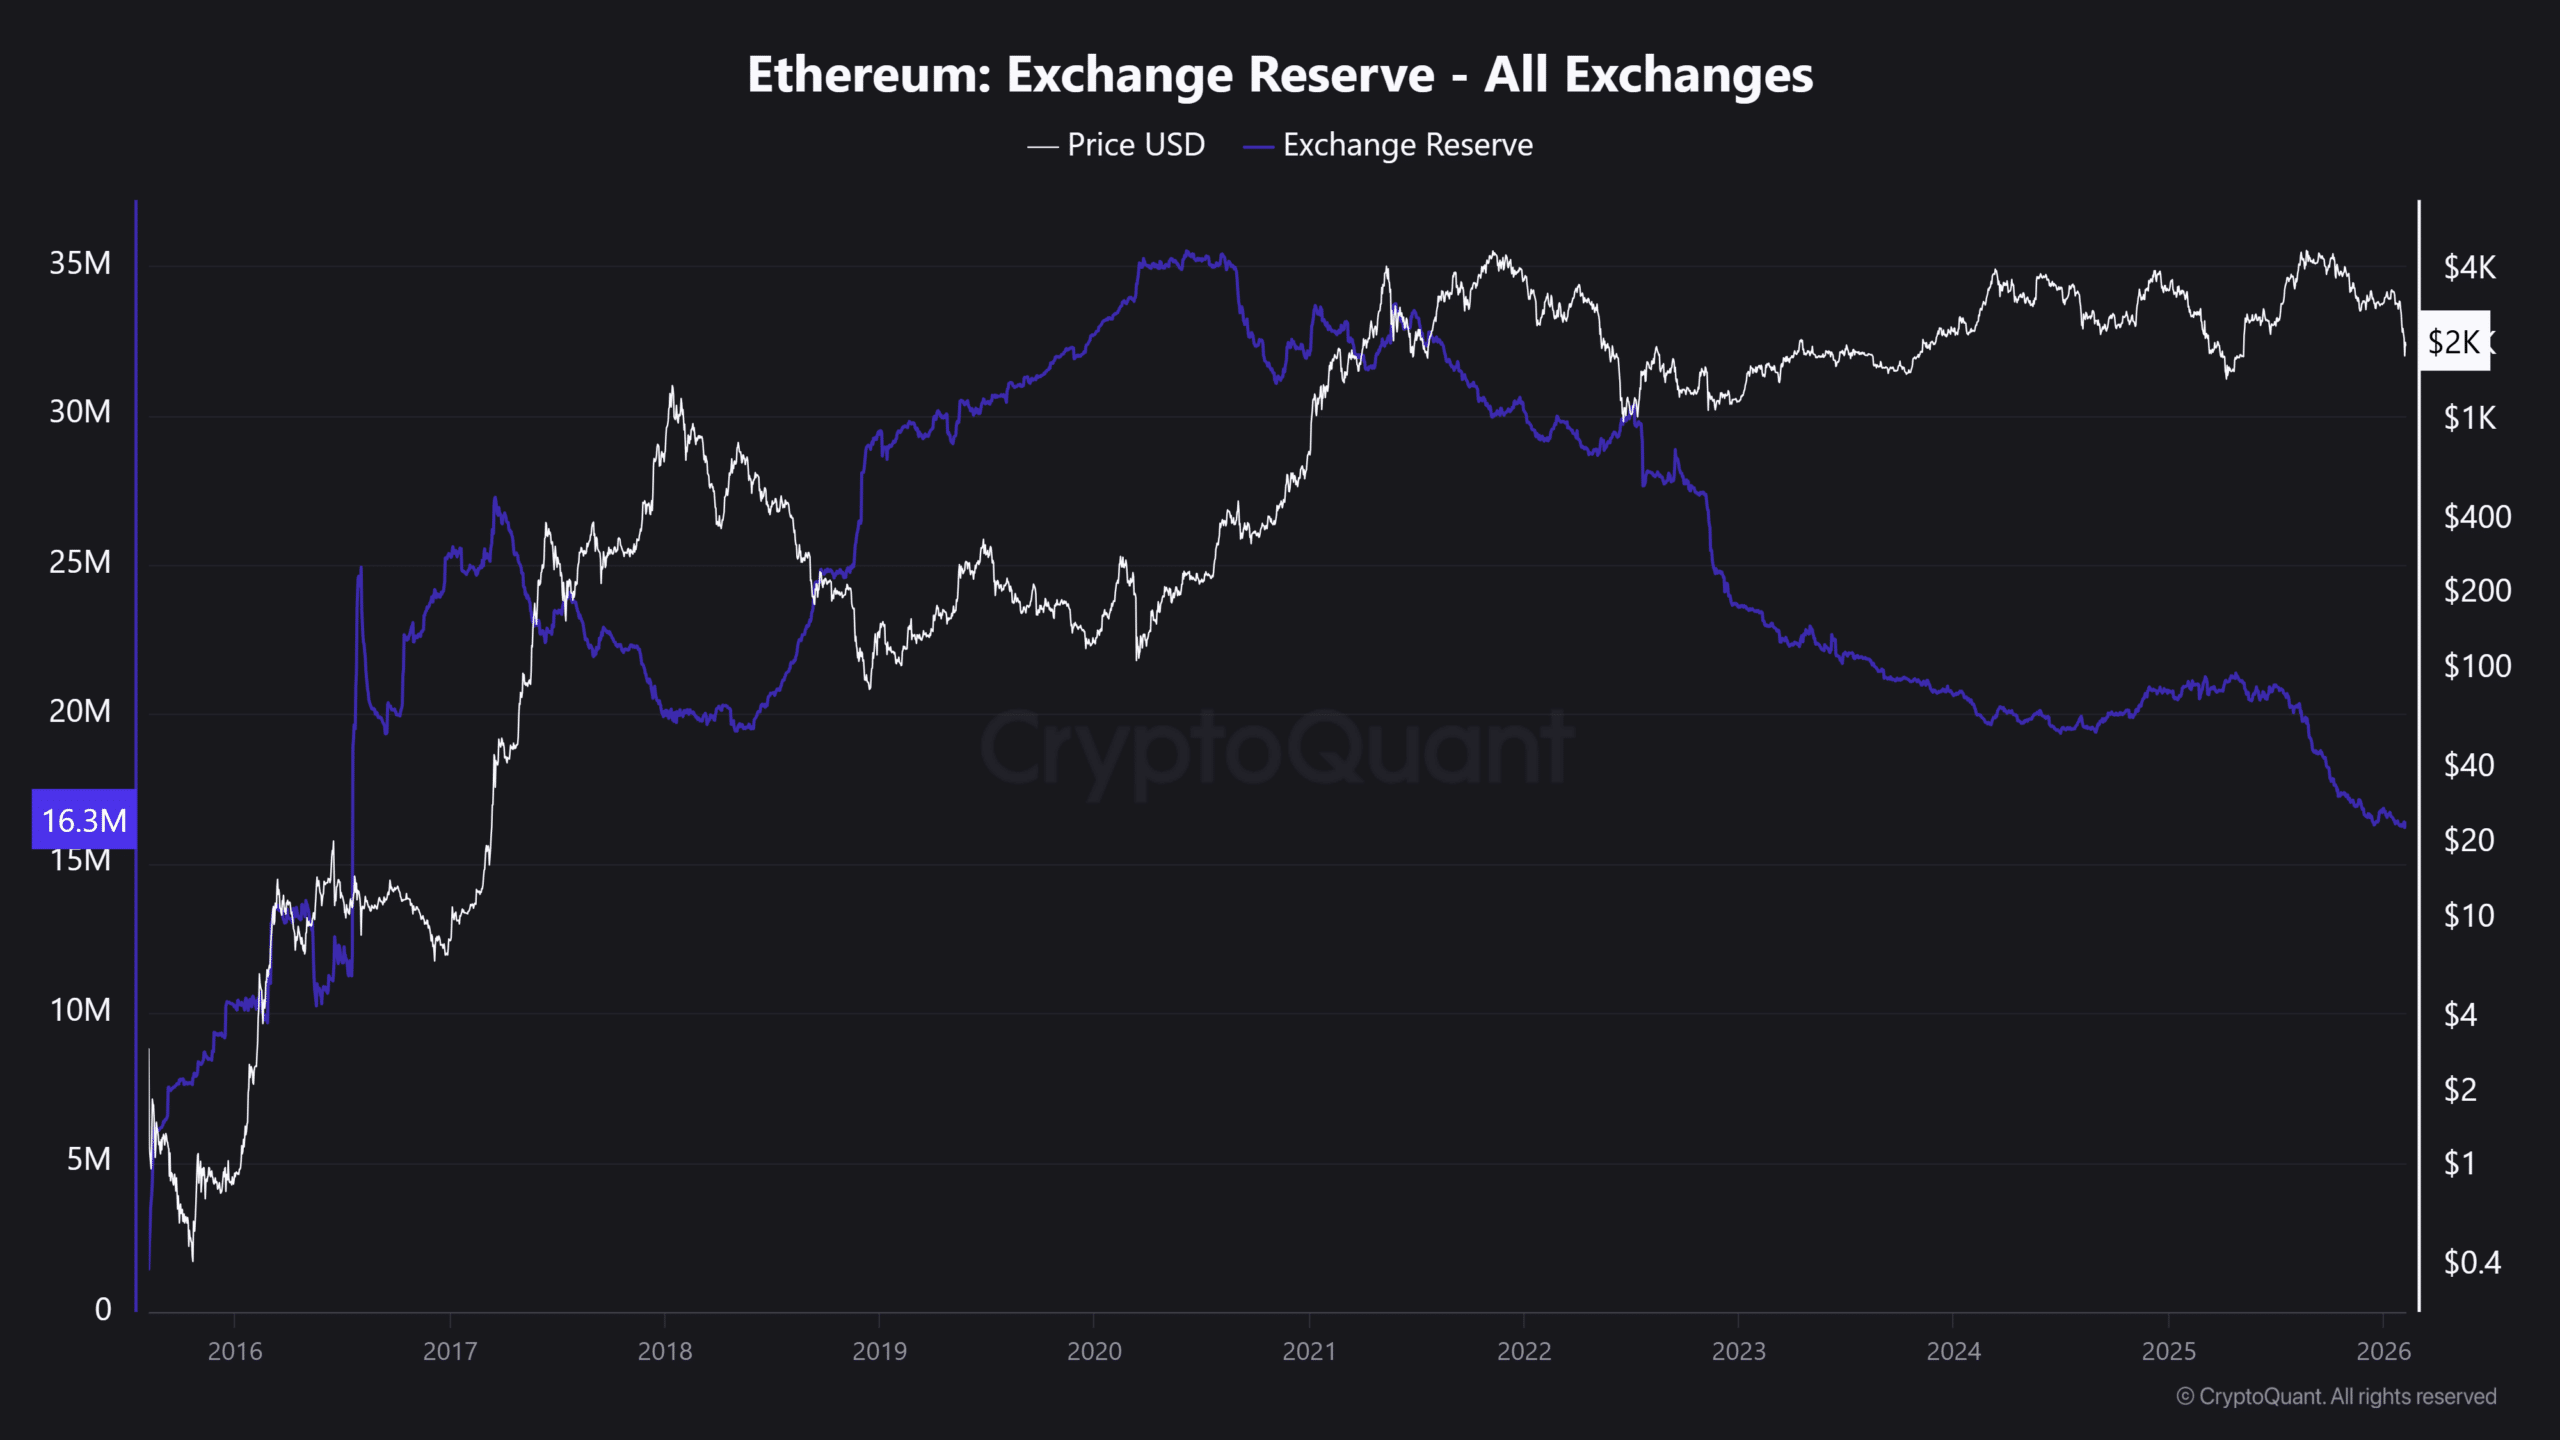
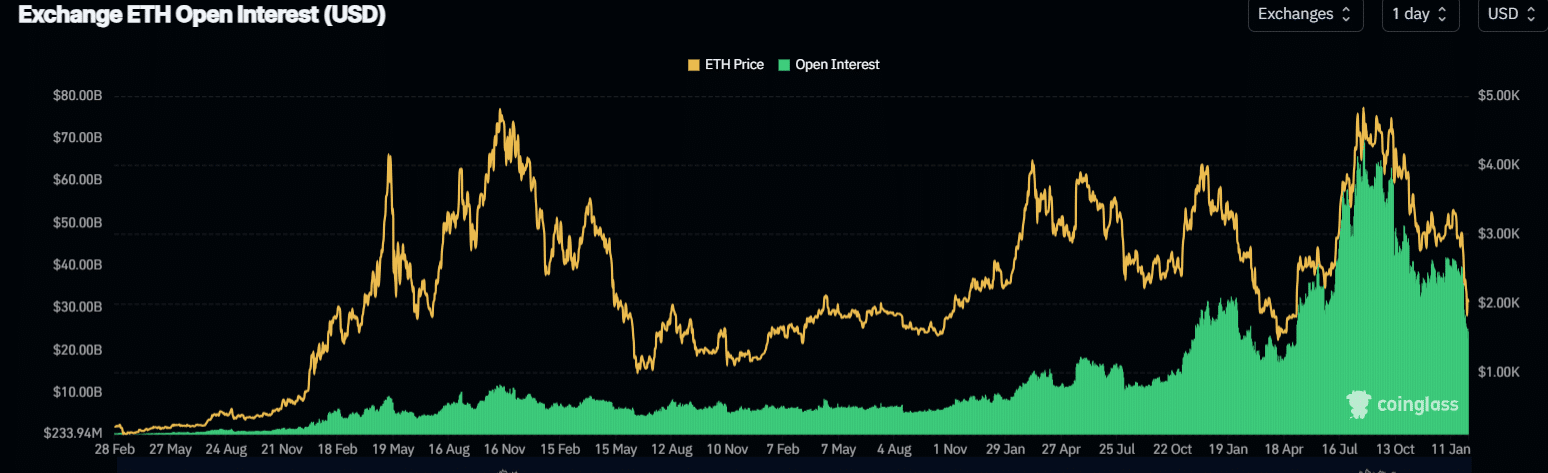
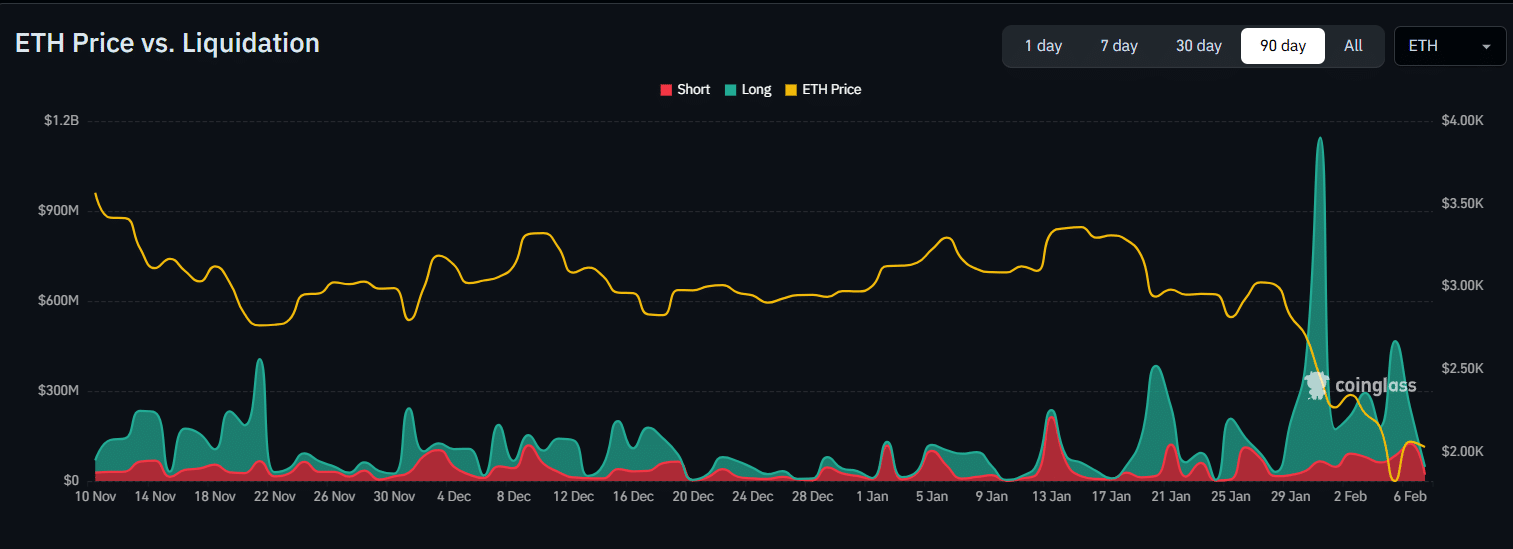
With Ethereum's exchange reserves hitting multi-year lows of 16.3 million ETH in early February 2026—levels not seen since 2016—the liquidity landscape is undergoing a structural shift. Large-scale withdrawals from exchanges like OKX and Binance suggest strategic accumulation by whales, likely capitalizing on ETH's dip near $2,050. This reduction in sell-side supply is easing selling pressure and may precede potential price rallies. Meanwhile, derivatives market reflects risk reduction rather than expansion, with open interest declining to the $24 billion–$36 billion range, negative rates, and over $1 billion in long liquidations during the crash. These factors, combined with growing institutional adoption post-ETF and increased staking activity, indicate a tightening circulating supply and reduced leverage, setting the stage for stronger recoveries once demand improves.
QWhat is the current state of Ethereum's exchange reserves as of early February 2026, and why is this significant?
AEthereum's exchange reserves hit 16.3 million ETH in early February 2026, marking multi-year lows last seen in 2016. This is significant because it indicates a structural tightening of tradable supply, which reduces immediate sell pressure and has historically preceded stronger price recoveries when demand conditions improve.
QHow did whale activity contribute to the shift in Ethereum's liquidity landscape?
AWhales initiated large Ethereum withdrawals from exchanges like OKX and Binance, capitalizing on ETH's dip near $2,050. This coordinated off-exchange migration suggests deliberate accumulation rather than routine transfers, absorbing supply while sentiment weakened and easing selling pressure.
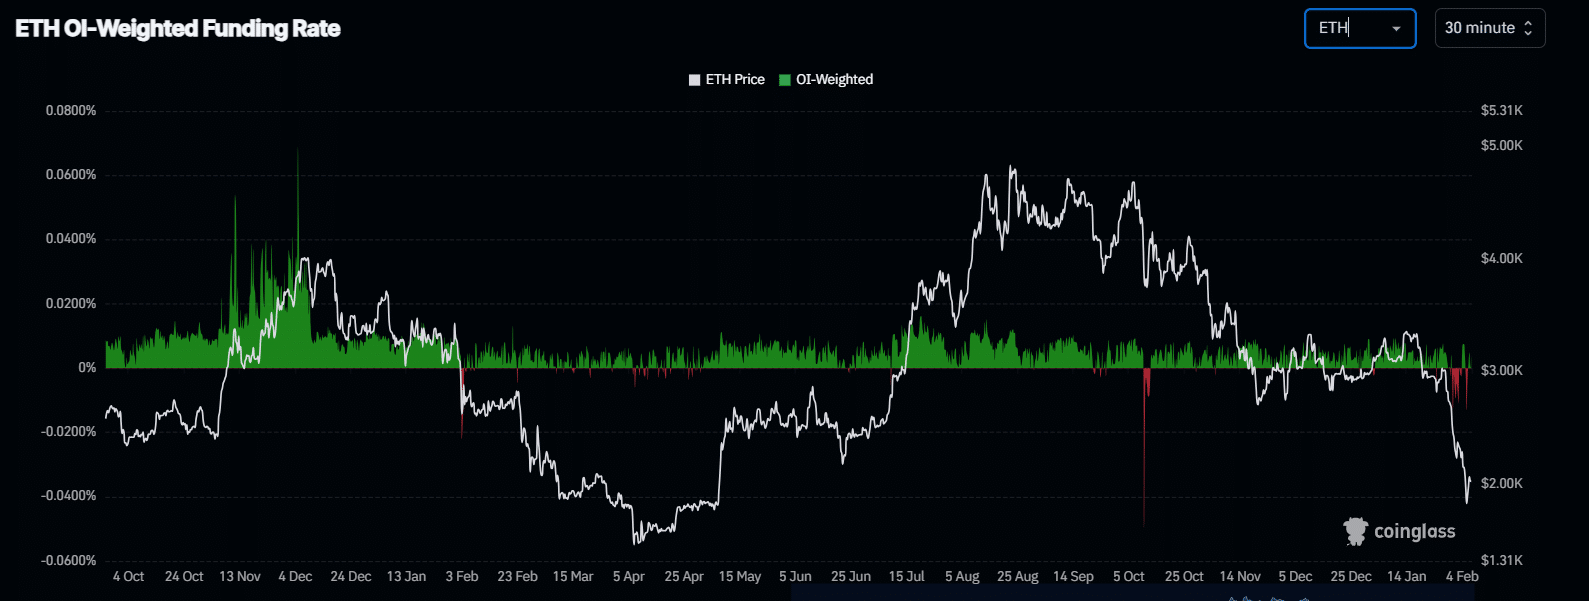
QWhat does the decline in Ethereum's derivatives market metrics, such as Open Interest and Funding Rates, indicate?
AThe decline in Open Interest (falling to the $24 billion–$36 billion range) and persistently negative Funding Rates (near -0.003%) reflect active deleveraging and dominant bearish positioning. This confirms that leverage has not offset spot compression, reinforcing medium-term squeeze potential despite near-term volatility.
QHow have staking and institutional adoption impacted Ethereum's circulating supply?
AStaking and off-exchange custody, accelerated by post-ETF institutional adoption in 2026, have absorbed ETH supply, tightening circulating inventory. This reduces tradable liquidity and anticipates deeper DeFi deployment, further compounding the supply contraction.
QWhat historical context is provided for Ethereum's exchange reserves, and how has the trend evolved?
AETH Exchange reserves expanded from 5–10 million ETH in 2016–2017 to a peak of nearly 35 million ETH during the 2020–2021 DeFi and NFT boom. A structural drawdown began in 2024–2025, intensifying as staking and off-exchange solutions gained dominance, leading to the multi-year lows in early 2026.
欢迎来到HTX.com!我们已经让购买Sonic(S)变得简单而便捷。跟随我们的逐步指南,放心开始您的加密货币之旅。第一步:创建您的HTX账户使用您的电子邮件、手机号码注册一个免费账户在HTX上。体验无忧的注册过程并解锁所有平台功能。立即注册第二步:前往买币页面,选择您的支付方式信用卡/借记卡购买:使用您的Visa或Mastercard即时购买Sonic(S)。余额购买:使用您HTX账户余额中的资金进行无缝交易。第三方购买:探索诸如Google Pay或Apple Pay等流行支付方法以增加便利性。C2C购买:在HTX平台上直接与其他用户交易。HTX场外交易台(OTC)购买:为大量交易者提供个性化服务和竞争性汇率。第三步:存储您的Sonic(S)购买完您的Sonic(S)后,将其存储在您的HTX账户钱包中。您也可以通过区块链转账将其发送到其他地方或者用于交易其他加密货币。第四步:交易Sonic(S)在HTX的现货市场轻松交易Sonic(S)。访问您的账户,选择您的交易对,执行您的交易,并实时监控。HTX为初学者和经验丰富的交易者提供了友好的用户体验。
608人学过发布于 2025.01.15更新于 2025.03.21
Sonic TVL逆势上涨,生态多元化发展,其中颇具代表的项目包括:FlyingTulip、Derps、SHADOW 。
7.2k人学过发布于 2025.03.21更新于 2025.04.09
HTX Learn致力于挖掘具备潜力的热门项目,特别推出热门项目学习与交易活动,本期学习项目为“Sonic“。
6.2k人学过发布于 2025.04.10更新于 2025.04.10