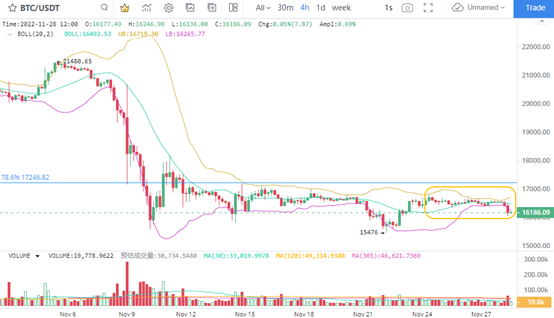
1. BTC's small break
During BTC horizontal consolidation, the fluctuation space of the 4-hour K chart is extremely low. In terms of the intraday price fluctuation intensity, BTC's volatility has been lower than 2% for four consecutive trading days. On November 28, the BTC price fell slightly, and the trend was still weak, which further verified the price decline. At present, BTC has failed to change the weak situation. The price of the 4-hour K line chart has slightly broken down. The recent support is still not strong enough, and the downward trend continues.
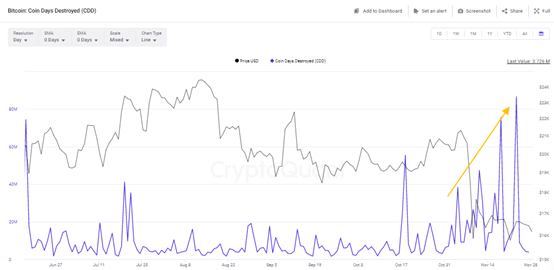
2. BTC long-term investors speed up their turnover
At present, the BTC daily destruction index has reached a new high for four consecutive trading days, reaching the highest value of 86.63 million on November 23. Next, the number of destroyed currency days was low, and the BTC price also increased its decline during the downturn. According to this judgment, BTC prices tend to change downward after the main force recently dumped the growth. The number of destroyed currency days reflects the increased willingness of long-term investors to adjust their positions. Recently, the indicator has been continuously verified and sold heavily, so there is room for market callback.
3. DOGE maintains upward momentum
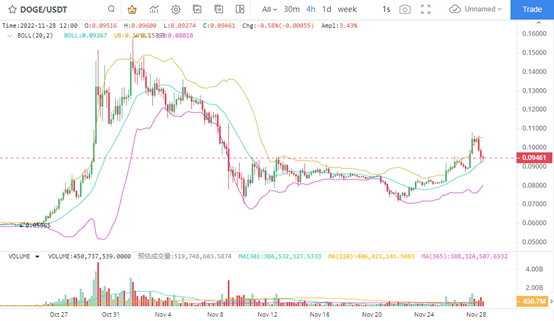
The short-term trading volume of DOGE rebounded slightly, and the price rose by nearly 0.1 US dollars. The signs of rebound continued. After DOGE started to strengthen on October 27, the recent signs are clear. The 4-hour K line chart shows that DOGE has recently completed two bottom patterns near $0.073. If the support is effective, the double bottom neckline position of $0.094 will usher in a low suction opportunity.
The short-term rise of DOGE may be due to the launch of Twitter 2.0 by Musk. Although the plan has not yet shown the hours used to pay for DOGE, DOGE's performance is still strong. Next, we can continue to pay attention to the impact of Musk's remarks on DOGE prices.
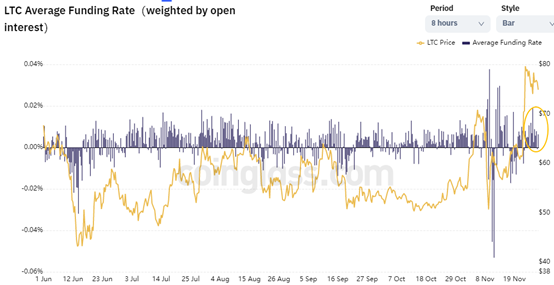
4. LTC financing interest rate remains strong
Recently, the LTC price is still operating at a short-term high. Thanks to the strong financing interest rate, the LTC price is still expected to continue its rebound momentum. Usually, after the price spike and fall back, the trading volume shrinks to the low level near the isoline, and the buying signal will be verified. However, in the current LTC daily K line chart, the trading volume is as low as the 100 day equivalent line, so we can focus on the low absorption opportunities of LTC near $70.
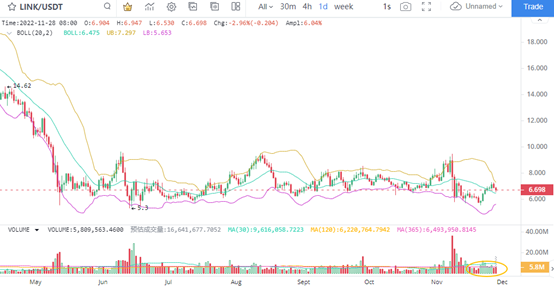
5. LINK price performance is strong
The daily K line chart of LINK shows that the price is still running in the horizontal area since May, and the lowest price has not fallen below $5.3. Most trading days are still above $6. Even considering the impact of recent price adjustment, LINK prices remain strong. After rebounding by 24%, the price retreated slightly, attracting low attention to buying points near $6.