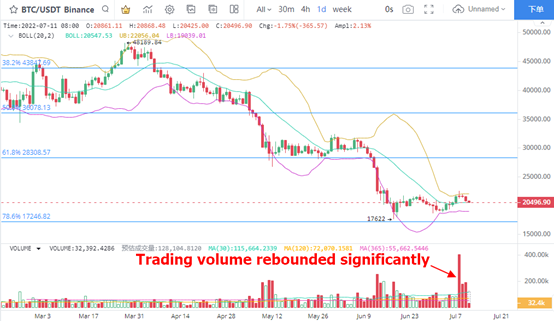
1、 BTC volume fallback
BTC's daily line operated in large volume for 3 trading days, and the cumulative trading volume rebounded significantly during the expansion of the decline. The trading volume in the recent three trading days has been running at a high level, and there is no sign that the contraction signal has continued. According to this judgment, bulls are continuously selling BTC, which makes the market have the possibility of a sharp decline.
Morphologically, the fluctuation space of BTC in the past month is relatively limited after it fell back from the rail position on the brin line. Considering the further strengthening of price decline in the short term, the possibility of a new low closing price cannot be ruled out. In terms of support, 78.6% of Fibonacci's corresponding $17246 is still valid. On June 19, during the BTC pullback period, the minimum reached $17622. Next, we can continue to pay attention to the rebound opportunity above $17000.
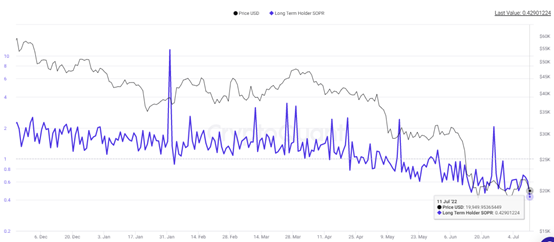
2. Main loss escape signal
With the continuation of BTC adjustment trend, the trading trend of long-term investors deserves attention, especially the profit and loss performance of investors who have traded, indicating the main trading intention. The data shows that the SOPR proportion of long-term investors has been as low as 0.429 on July 11, the lowest performance in history. Judging from this, the average trading loss of long-term investors reached 57.1%. In other words, investors dumped BTC around $20000 to $21000 at the BTC point. After the completion of loss trading, it indicates that there is a large room for expected adjustment, and the possibility of falling below the recent low price of $17622 is enhanced.
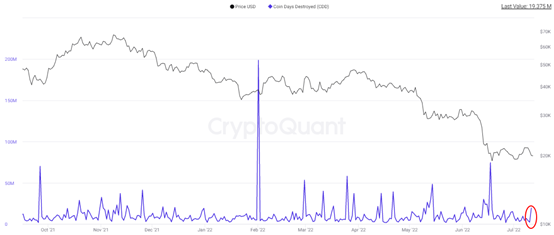
3. The number of BTC coins destroyed per day rebounded
BTC is used to measure the trading trend of long-term investors. The rebound of this index means that long-term investors begin to adjust their positions, and BTC prices will also be affected. The number of BTC coins destroyed per day reached three times the recent average on July 11, indicating that long-term investors began to accelerate transactions, and the increase in transfers indicates that the selling pressure continues. At the point, BTC increased from 1170 to 1091 dollars on July 11
4. Eth continued to decline
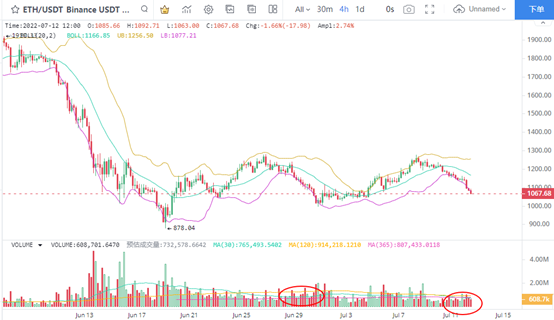
In the 4-hour K-line chart, the decline in eth prices has continued to expand, and has now reached below $1100. Compared with the price drop before and after June 29, this eth trading volume is smaller, and the unilateral downward trend shows an accelerated trend. Eth not only easily fell below the brin line, but also continued to expand its decline along the brin line. At present, the integer price support of $1000 is still valid, and we should pay attention to the further performance opportunities of eth at this point.
If the rebound around $1000 cannot be sustained, the recent trading volume is lower than the equivalent line, and the price has fallen below the previous expectations. In the early stage, ETH reached a minimum of $878. After a month of volatility, it basically digested the short-term long-term bottom hunting funds. Therefore, the signs of short-term eth seeking unilateral decline are strengthened.
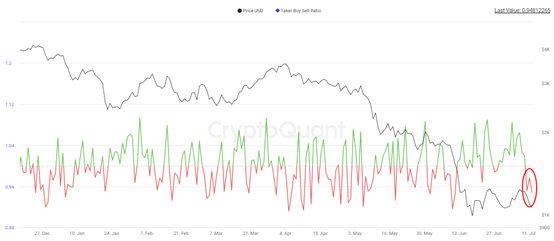
5. Eth contract long short ratio pullback
The long short ratio of eth has continued to fall significantly, falling to around 0.948 after falling below 0 in the short term, which means that bears have taken advantage. Since June 11, the contract long short ratio of eth has always maintained a strong position, with no less than 0 on most trading days. When the long short ratio of eth fell significantly below 0 for the first time, investors' bearish sentiment has increased. Eth recently traded sideways between $1000 and $1200. Next, once it falls below this range, its decline will soon expand.