Bitcoin volatility is dropping to historic lows due to macroeconomic instability and low market Liquidity . However, on-chain data and options markets signal volatility in June.
Used to measure daily price volatility, the Bitcoin Volatility Index shows a 30-day price movement of 1.52%, less than half of the historical annual average. (usually above 4%).
According to Glassnode, the bullish volatility prediction is a “reasonable conclusion” based on the fact that low volatility has only occurred in 19.3% of Bitcoin’s price history.
The latest weekly update from the on-chain analytics firm shows that Glassnode's monthly logical volatility metric for Bitcoin has slipped below the historic Bollinger Band lower limit, implying volatility is about to increase.
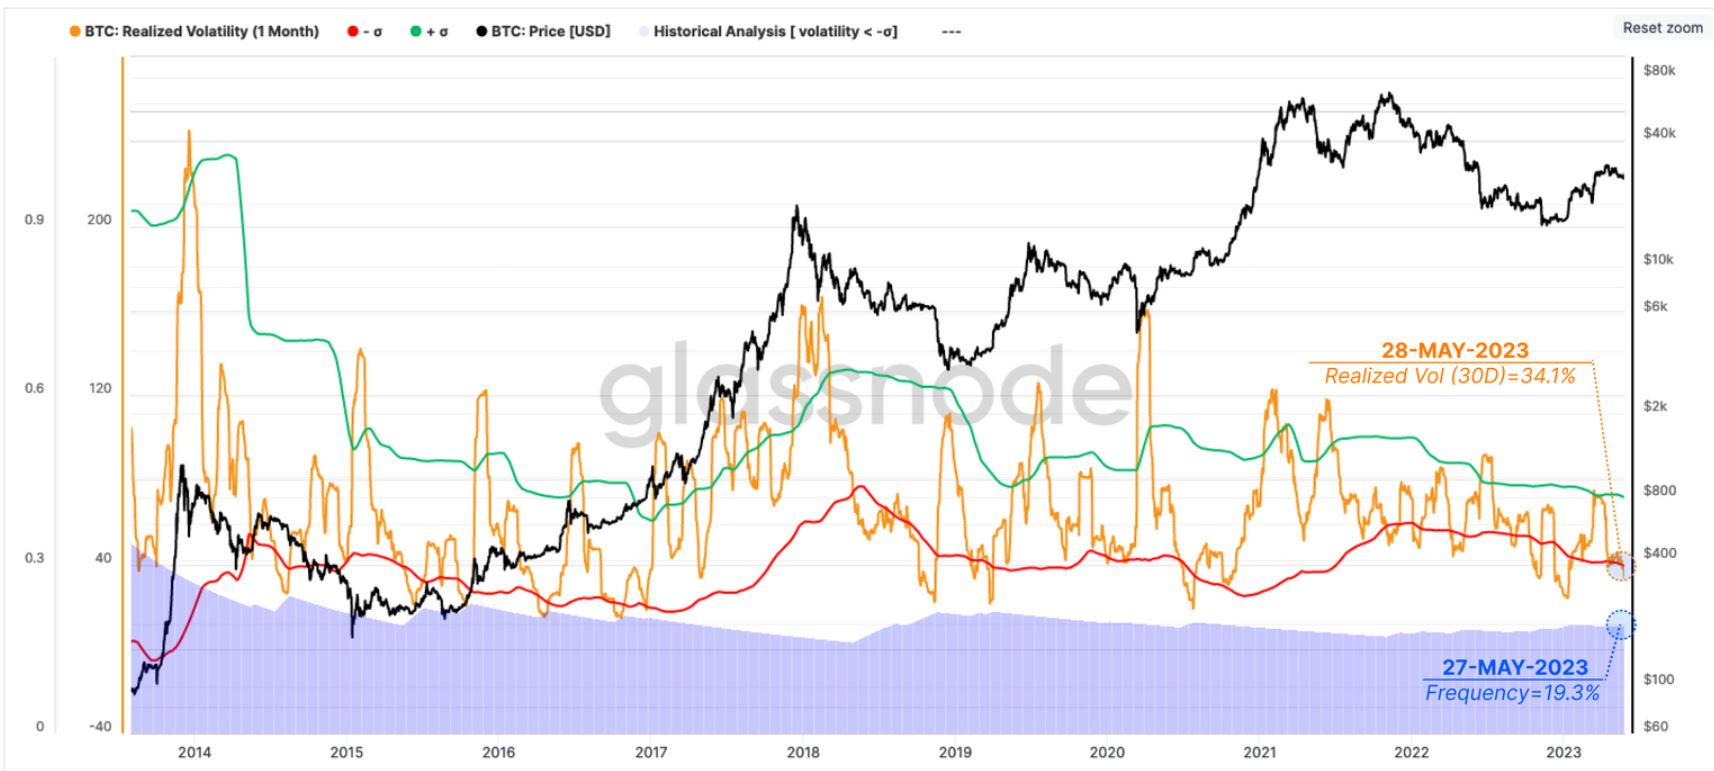
Bolinger Bands for Bitcoin Monthly Reasonable Volatility | Source: Glassnode
Bitcoin on-chain transfer volumes on exchanges have dropped to historic lows. According to the report, the price is also trading in favor of the short-term holders, indicating the “equilibrium position between gains and losses for new investors” who bought during and after the 2021-2022 bull cycle. Currently, only 50% of investors make a profit, the rest lose.
However, while short-term holders have reached equilibrium, long-term holders have moved in the recent correction, reinforcing the volatility argument.
Glassnode classifies coins that hold more than 155 days in a wallet as a long-term holder supply.
The gray bars in the image below show the long-term holders (LTH) binary spending indicator, which tracks whether LTH's average spend over the past 7 days is enough to reduce their total holdings. .
The chart shows previous instances where LTH spending has increased, often with increased volatility.
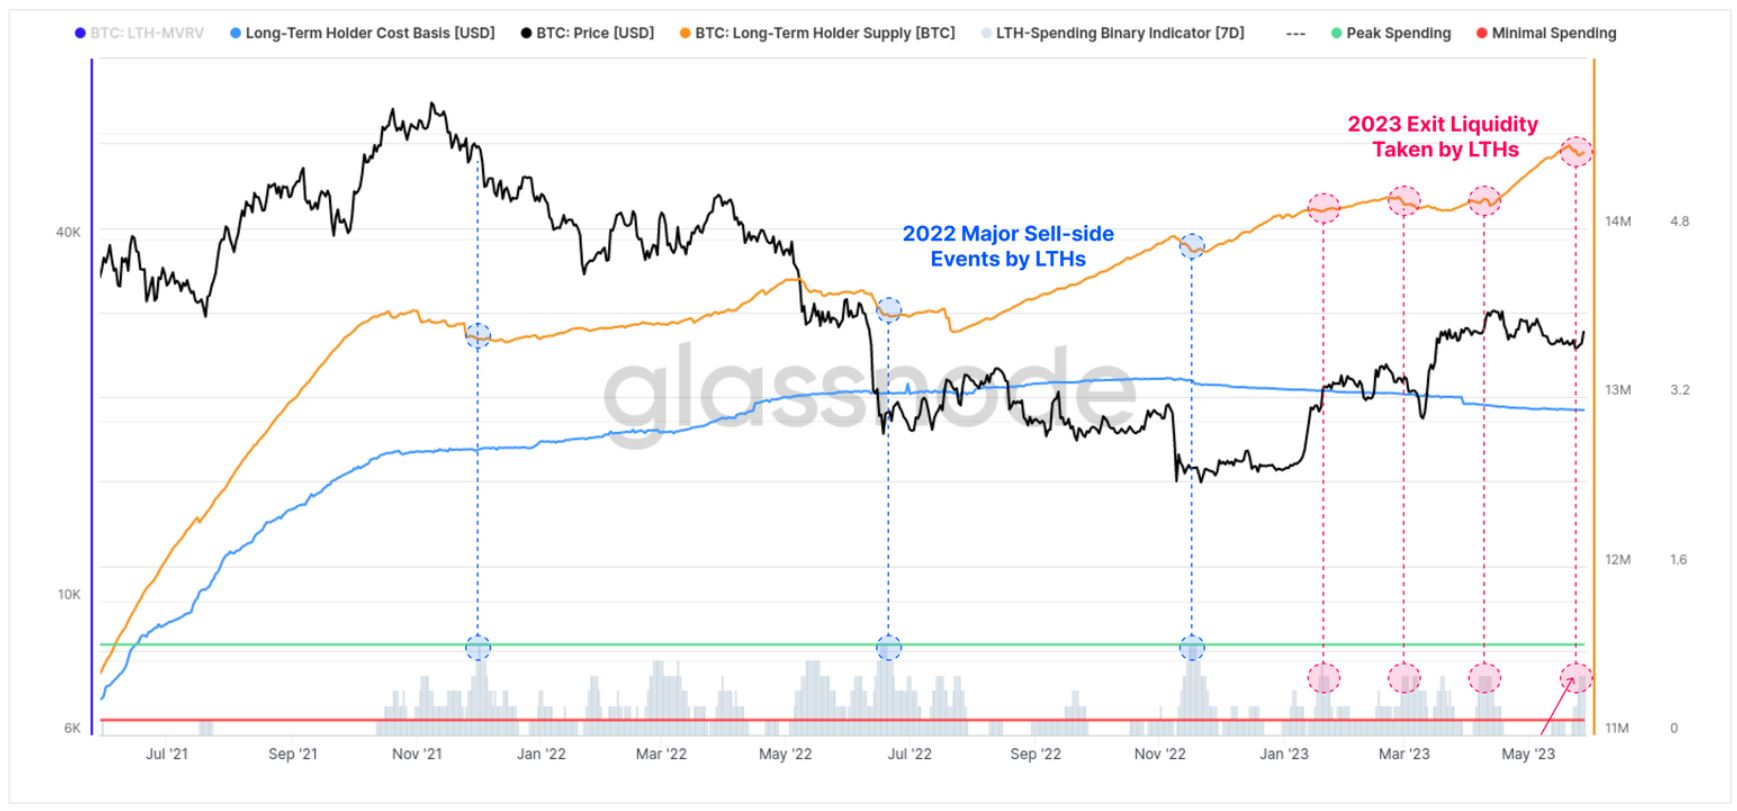
Long Term Holder Spending Binary Indicator | Source: Glassnode
Bitcoin’s recent price correction caused the indicator to drop slightly, “showing 4 out of 7 days of net divestment of LTH, which is similar to the Liquidity exit events so far this year.”
Analysts expect a wave of volatility to reach an equilibrium, where the market moves primarily due to accumulation or distribution of long-term holders' supply.
Options market data points to a similar theory of impending volatility.
The options market's latest expiration in May turned out to be a dull event, despite its nominal value of $2.3 billion. However, prolonged volatility compression could build momentum for an upcoming major price move.
Bitfinex's latest Alpha report shows that the DVOL index (which represents the market's expectations of Bitcoin's potential volatility over the next 30 days) has dropped to 45 from 50 just before expiration, representing a low annual.
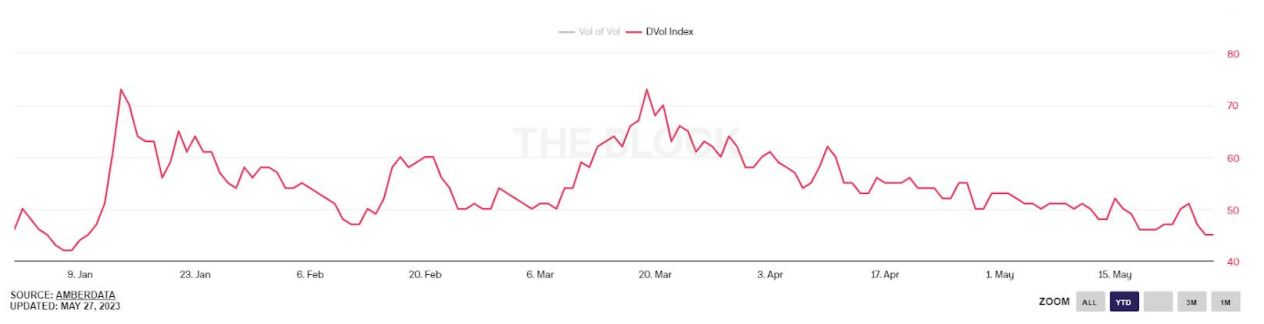
DVOL Index for Bitcoin Options | Source: Bitfinex
Implied volatility in options contracts refers to the market's expectation of an asset's future volatility, as reflected in the options' prices.
Bitfinex analysts said expectations of low volatility could be attributed to "coming events that are expected to change the market" or "uncertainty or market participants' increased risk aversion." ".
Right now, options traders are showing risk aversion and increasing their bearish positions as the month of May approaches the end of June.
Bitcoin put-to-call ratio increased from 0.38 to 0.5. A higher weighted put option shows that traders are slowly turning bearish.
Analysts at Bitfinex are currently anticipating “short-term market turbulence and price volatility risks” in June, especially with near-term expiration at the end of the month.
Potential price levels that could act as a magnet according to the options market positioning are the maximum pain at expiration in May and June of $27,000 and $24,000 respectively.
Maximum pain (also known as option pain) is a concept used in options trading and refers to the price at which the buyer must bear the maximum loss.