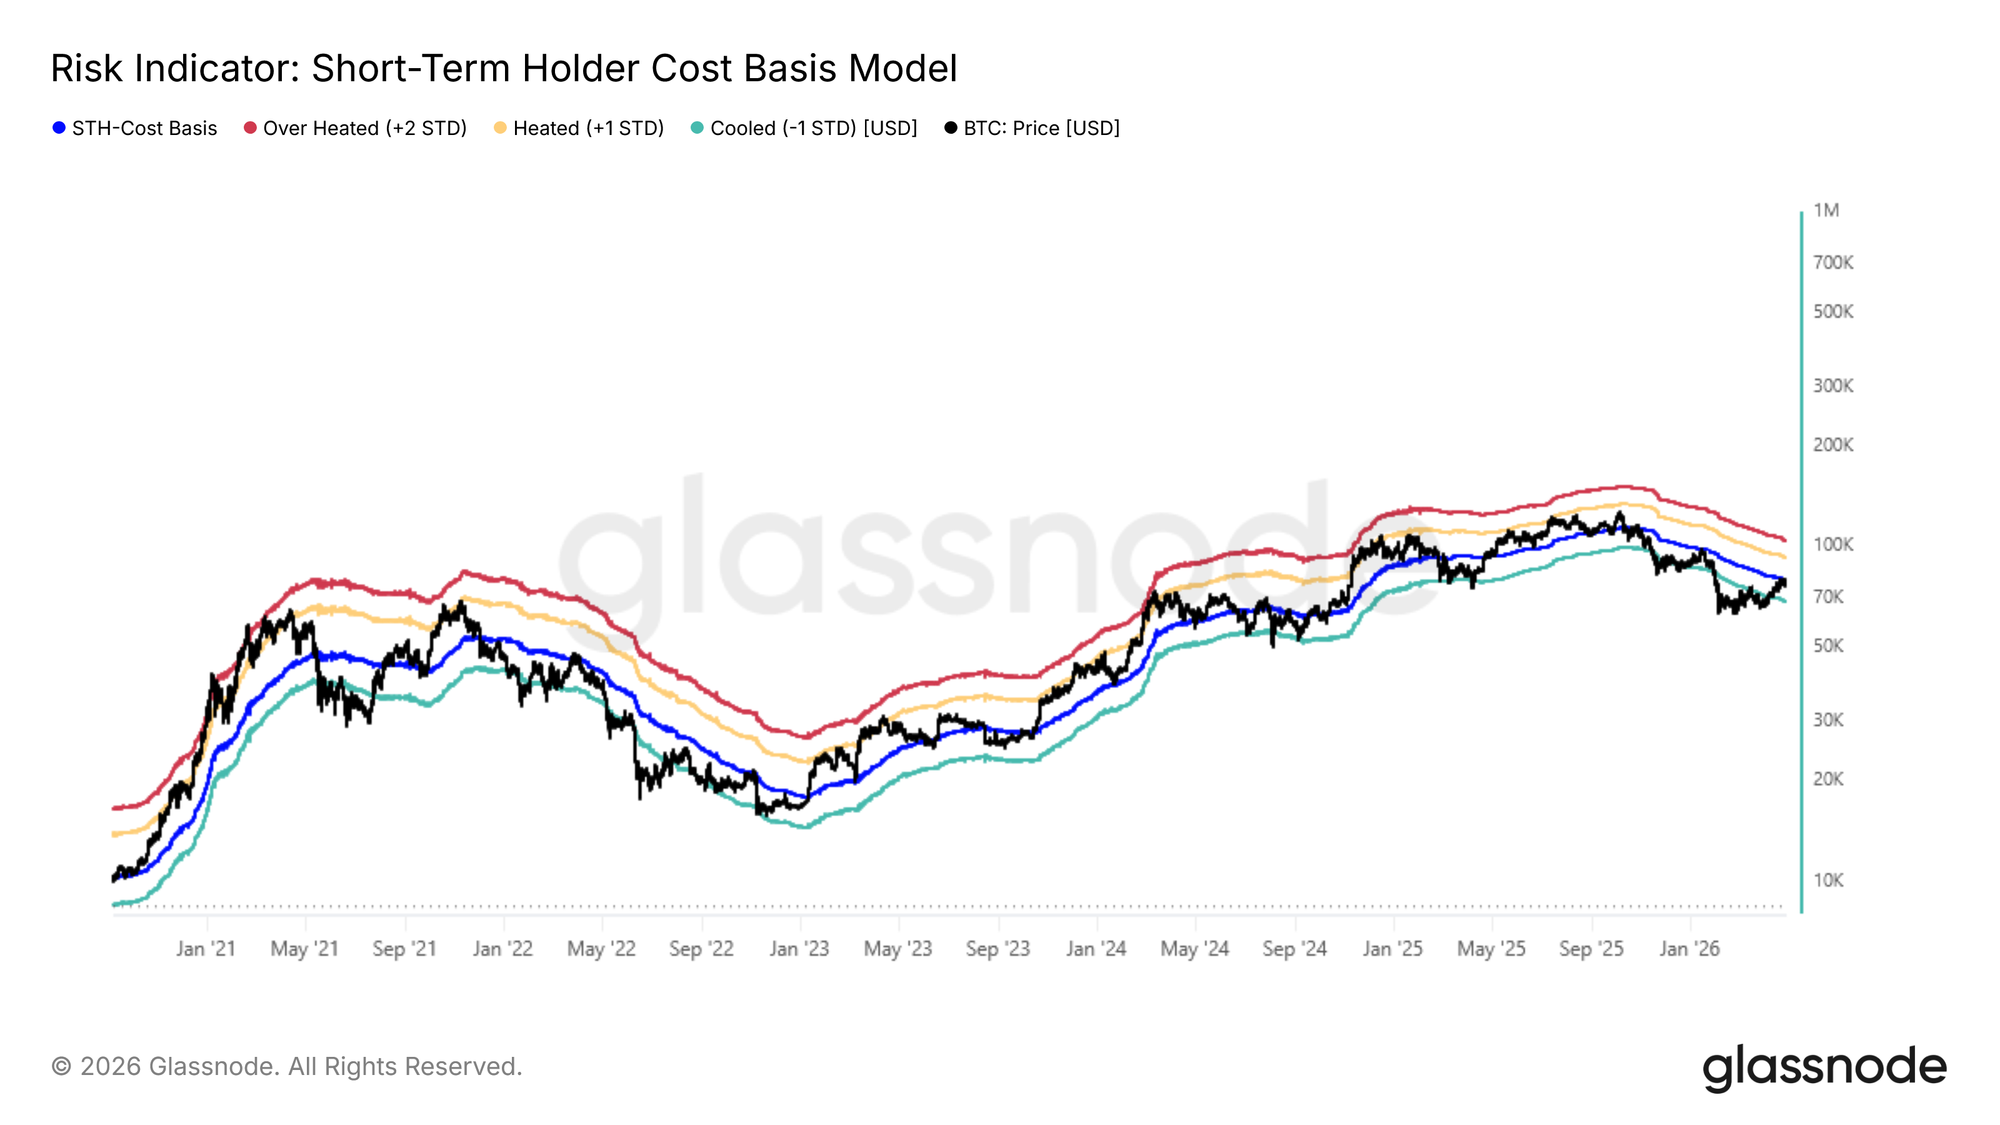
Last week, this report flagged the Short-Term Holder Cost Basis and the True Market Mean as the most probable resistance zone for the ongoing bear market rally, with profit realization by recent buyers already spiking to levels historically consistent with local top formation. Price subsequently found rejection precisely within this zone, failing to sustain above the True Market Mean at $78k and the Short-Term Holder Cost Basis at $79k. This behavior is a textbook pattern in bear markets, where price approaches the breakeven level of the most price-sensitive cohort, the incentive to exit positions overwhelms incoming demand, exhausting upside momentum.
With this rejection confirming overhead resistance, the mid-term bias tilts toward further downward pressure, and attention now shifts to the -1 standard deviation band near $68k as the most immediate structural support level to monitor.
Anatomy of the Rejection
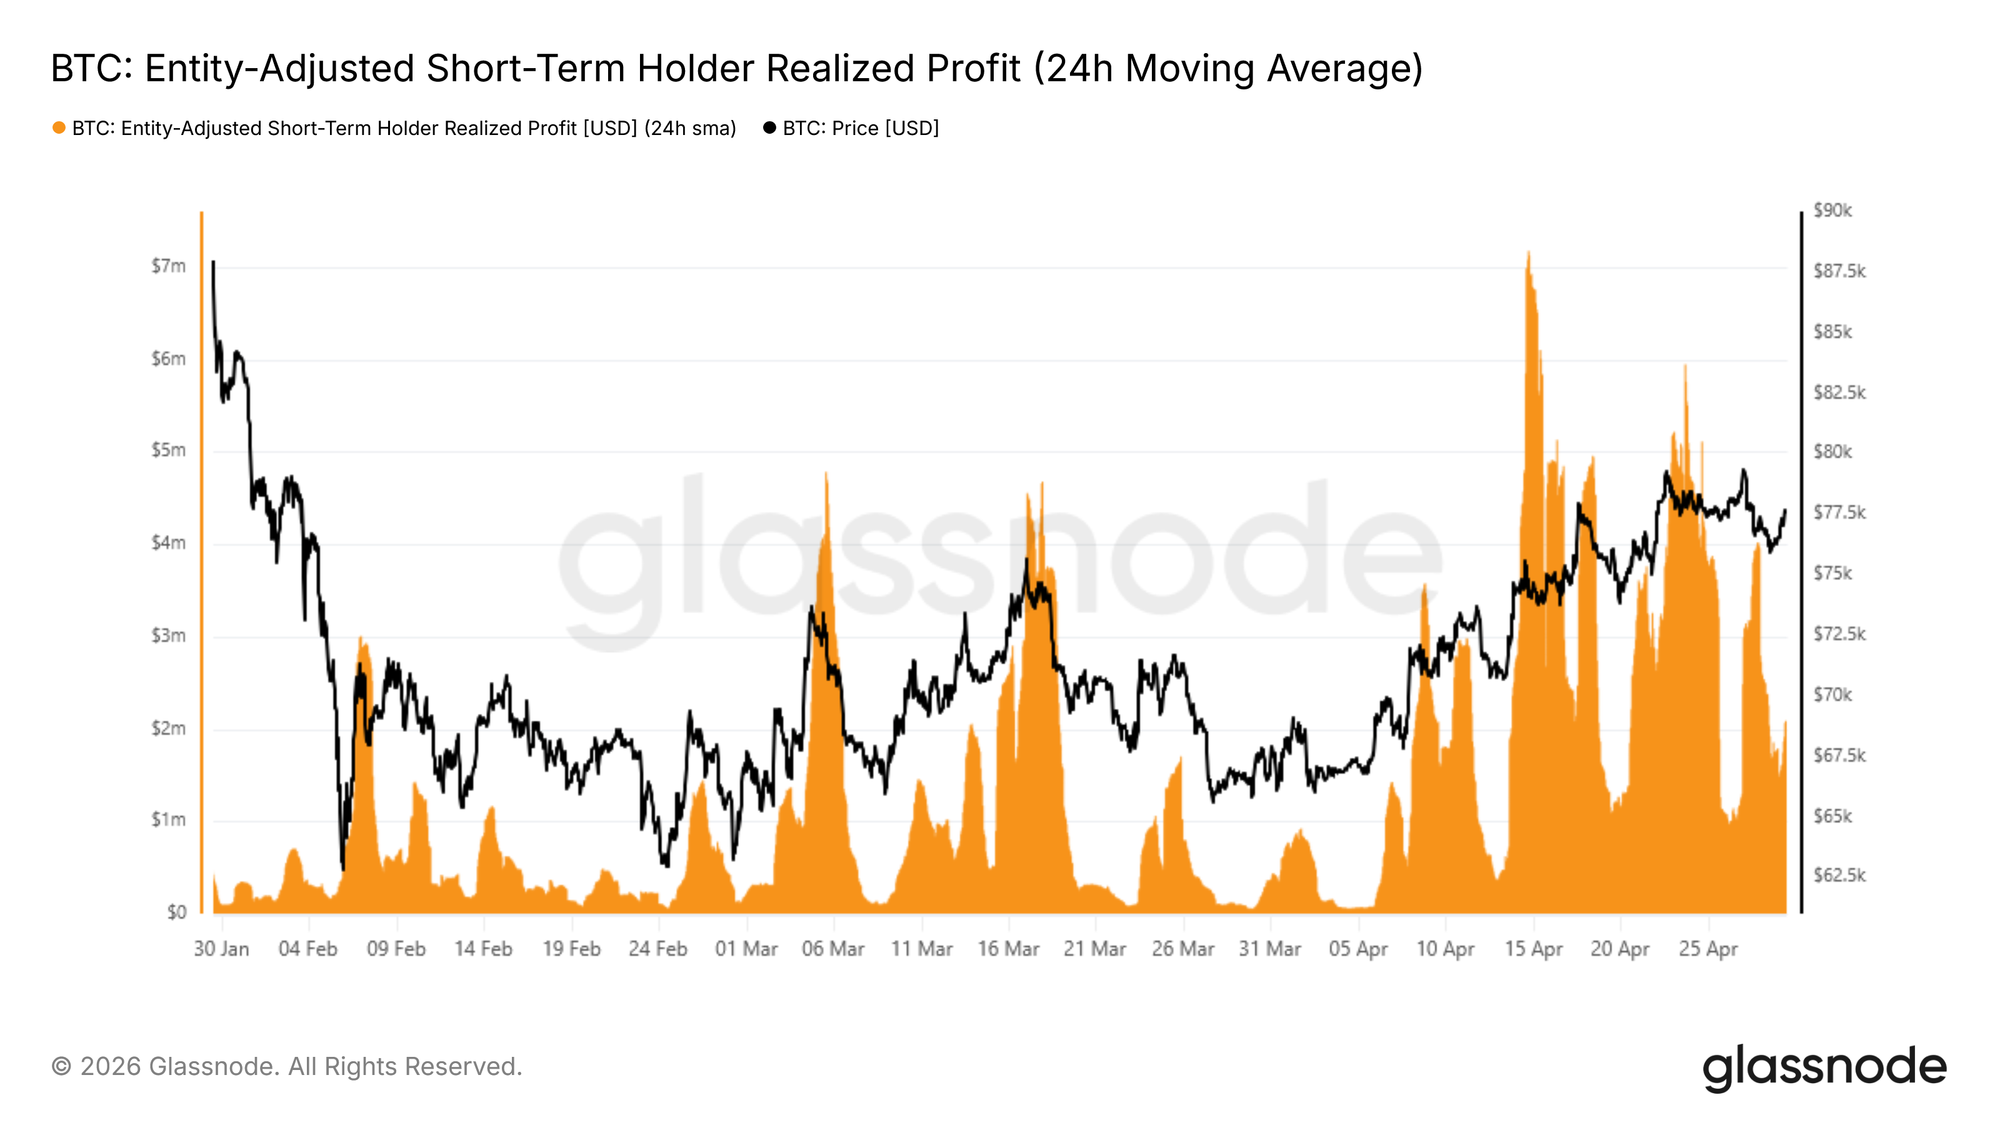
The rejection at the Short-Term Holder Cost Basis was not merely a price observation; on-chain spending data captures precisely how it unfolded. The 24-hour SMA of Short-Term Holder Realized Profit serves as a real-time gauge of how aggressively recent buyers are converting unrealized gains into exits.
As price approached $80k, this metric ramped to approximately $4M per hour, roughly four times the base level that had established itself since mid-April, confirming that short-term holders seized the rally as a distribution opportunity. The buy side simply lacked sufficient liquidity to absorb this wave of profit realization, capping momentum and triggering the subsequent rejection.
This metric is most useful when analyzed across two dimensions simultaneously: the baseline, which acts as a proxy for the broader trajectory of buy-side liquidity, and the peaks, which have consistently served as reliable local top indicators throughout the current bear market cycle.
Two Scenarios, One Cluster
The rejection at the True Market Mean and Short-Term Holder Cost Basis zone reinforces the broader structural weakness that has characterized this bear market. However, the picture is not unambiguously bearish.
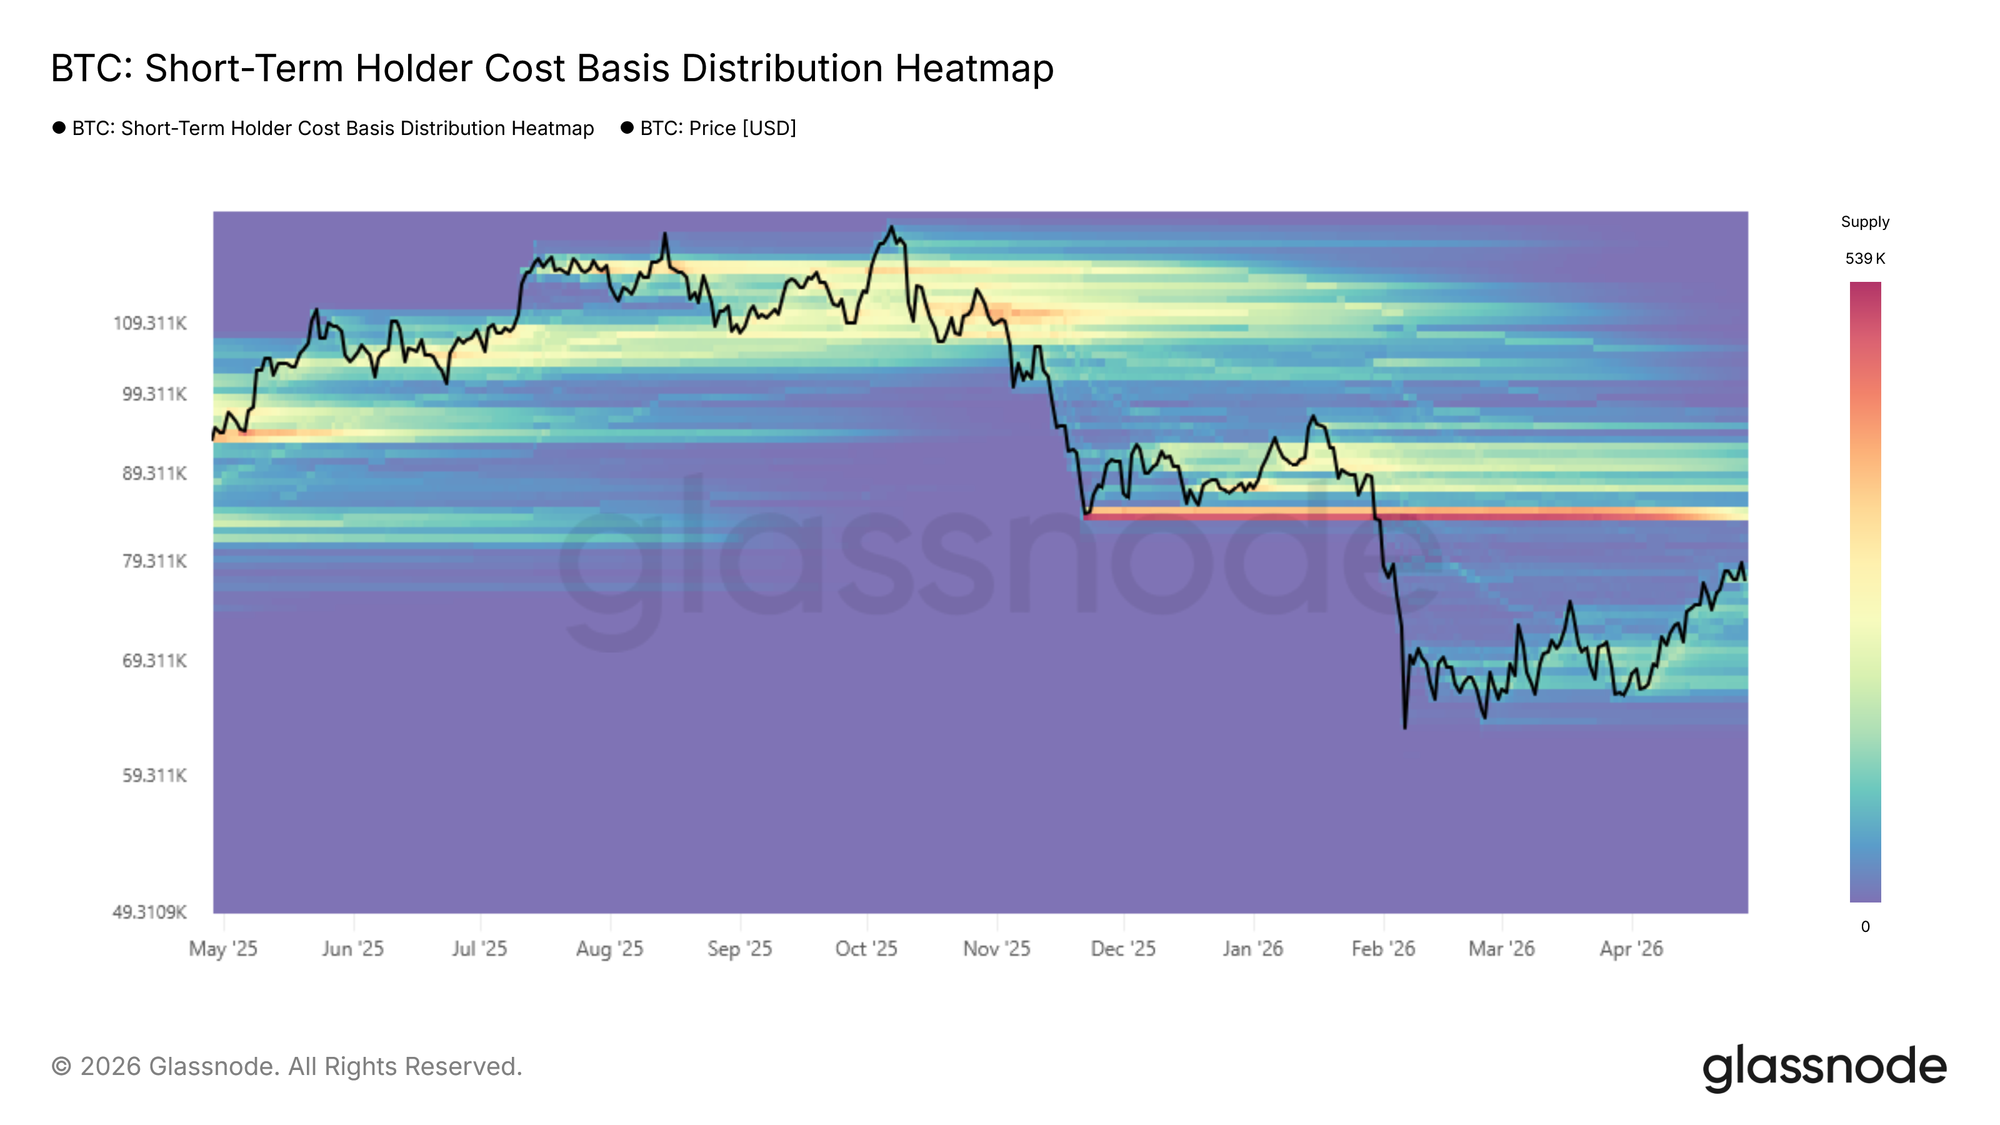
A dense accumulation cluster built over the past two months between $65k and $70k reflects a meaningful degree of buyer conviction at these levels, providing a foundation that could support a short-term bounce toward the lower band of the overhead supply cluster near $84k.
Conversely, should the market fail to absorb the persistent sell pressure emanating from the True Market Mean zone, this same $65k–$70k accumulation cluster, and more specifically the -1 standard deviation band of the Short-Term Holder Cost Basis near $68k, would serve as the primary support reference in the short to mid-term. The path forward therefore hinges on whether buyers within this range can sustain enough conviction to overcome the overhead distribution pressure.
Off-Chain Insights
Selling Pressure Eases, Buyers Re-Emerge
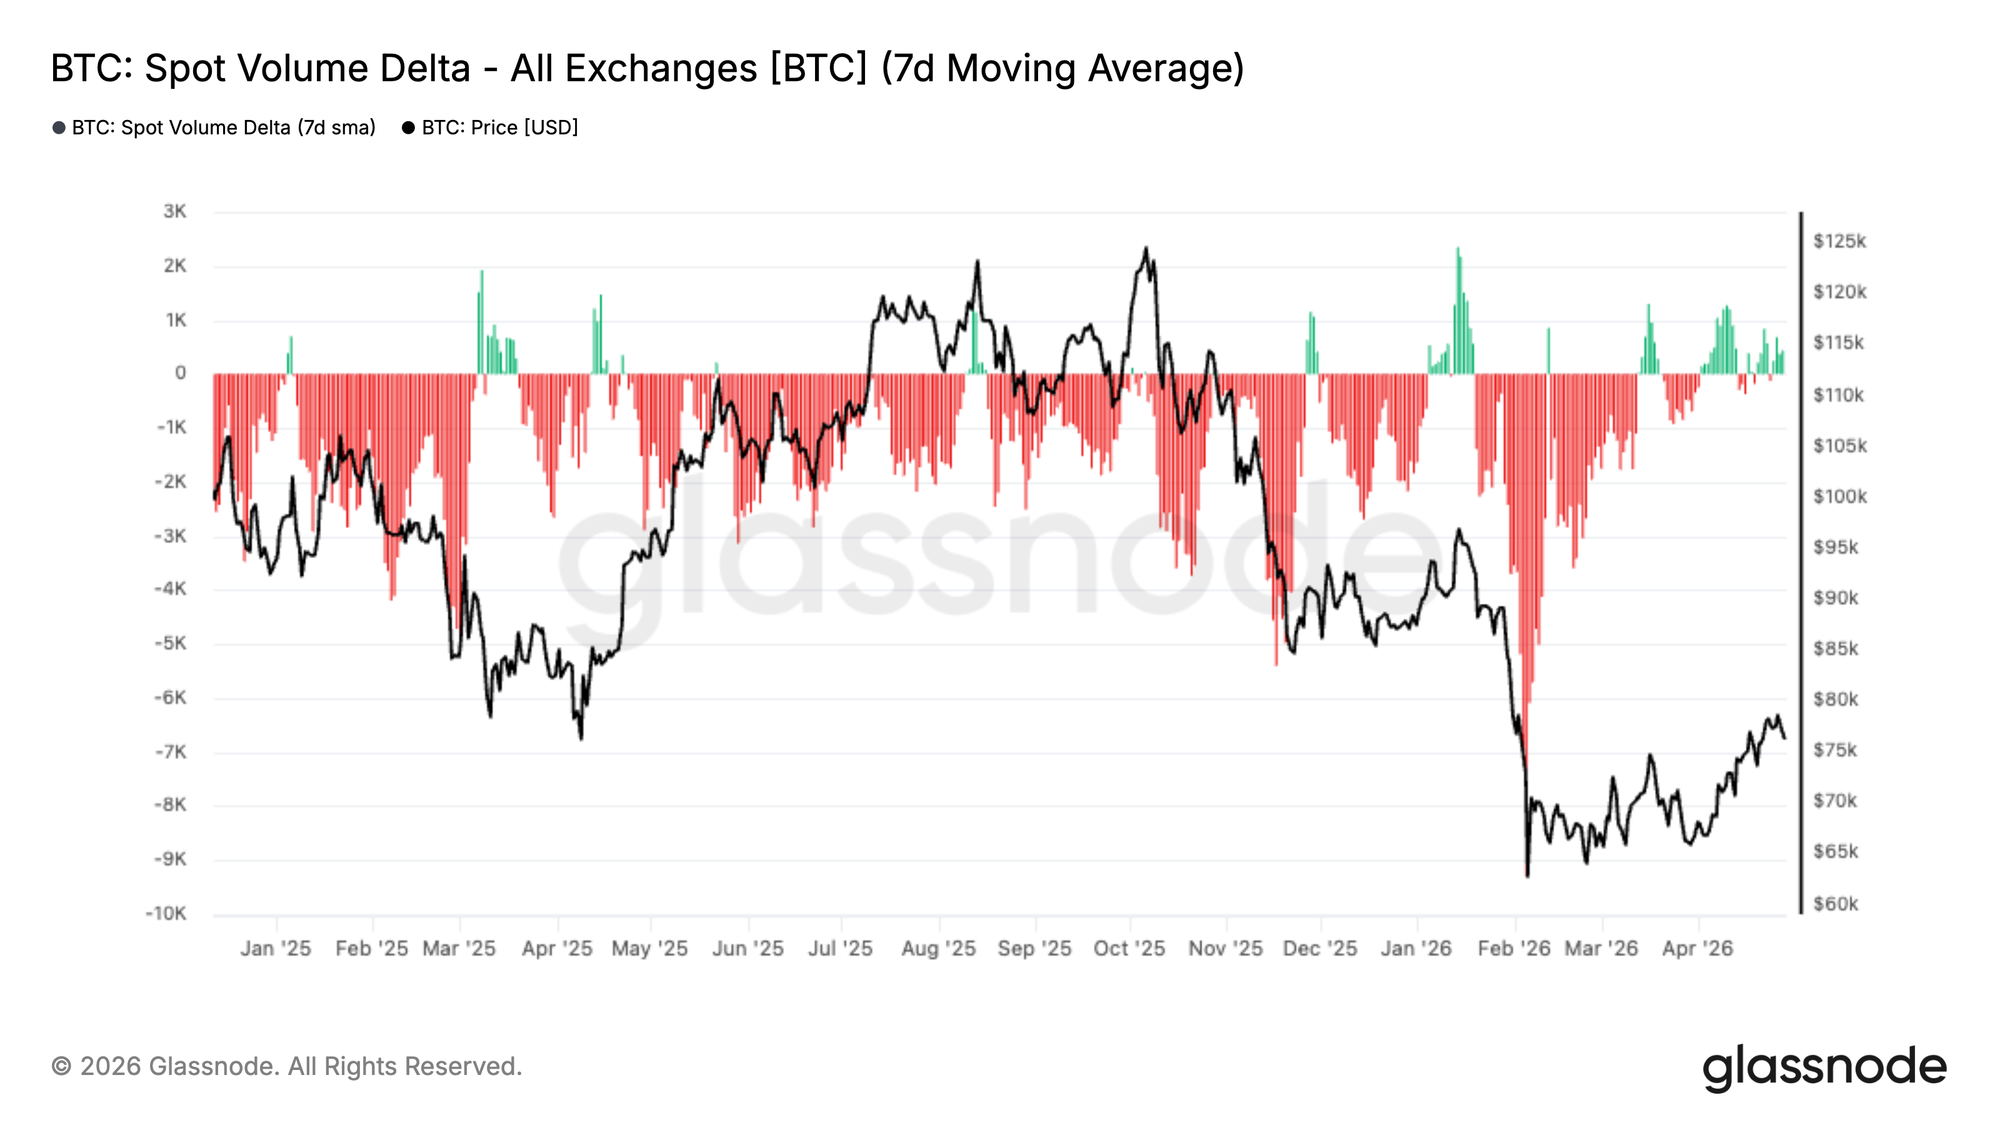
Spot Volume Delta has spent much of the past few months in deeply negative territory, reflecting sustained net selling pressure across exchanges. This persistent sell-side dominance aligned with the broader correction, particularly during the sharp drawdown into the ~$60–70K range.
However, recent data shows a clear shift. The 7-day average is now recovering toward neutral, with intermittent bursts of positive delta beginning to appear. This suggests that sell pressure is easing, while buyers are starting to step back in at current levels.
From a market structure perspective, this transition is important. While not yet indicative of strong accumulation, the move toward balance signals improving spot demand and reduced urgency from sellers. For a more durable recovery, continued expansion into positive territory will be required, confirming that buyers are regaining control of the tape.
Institutional Flows Rebuild
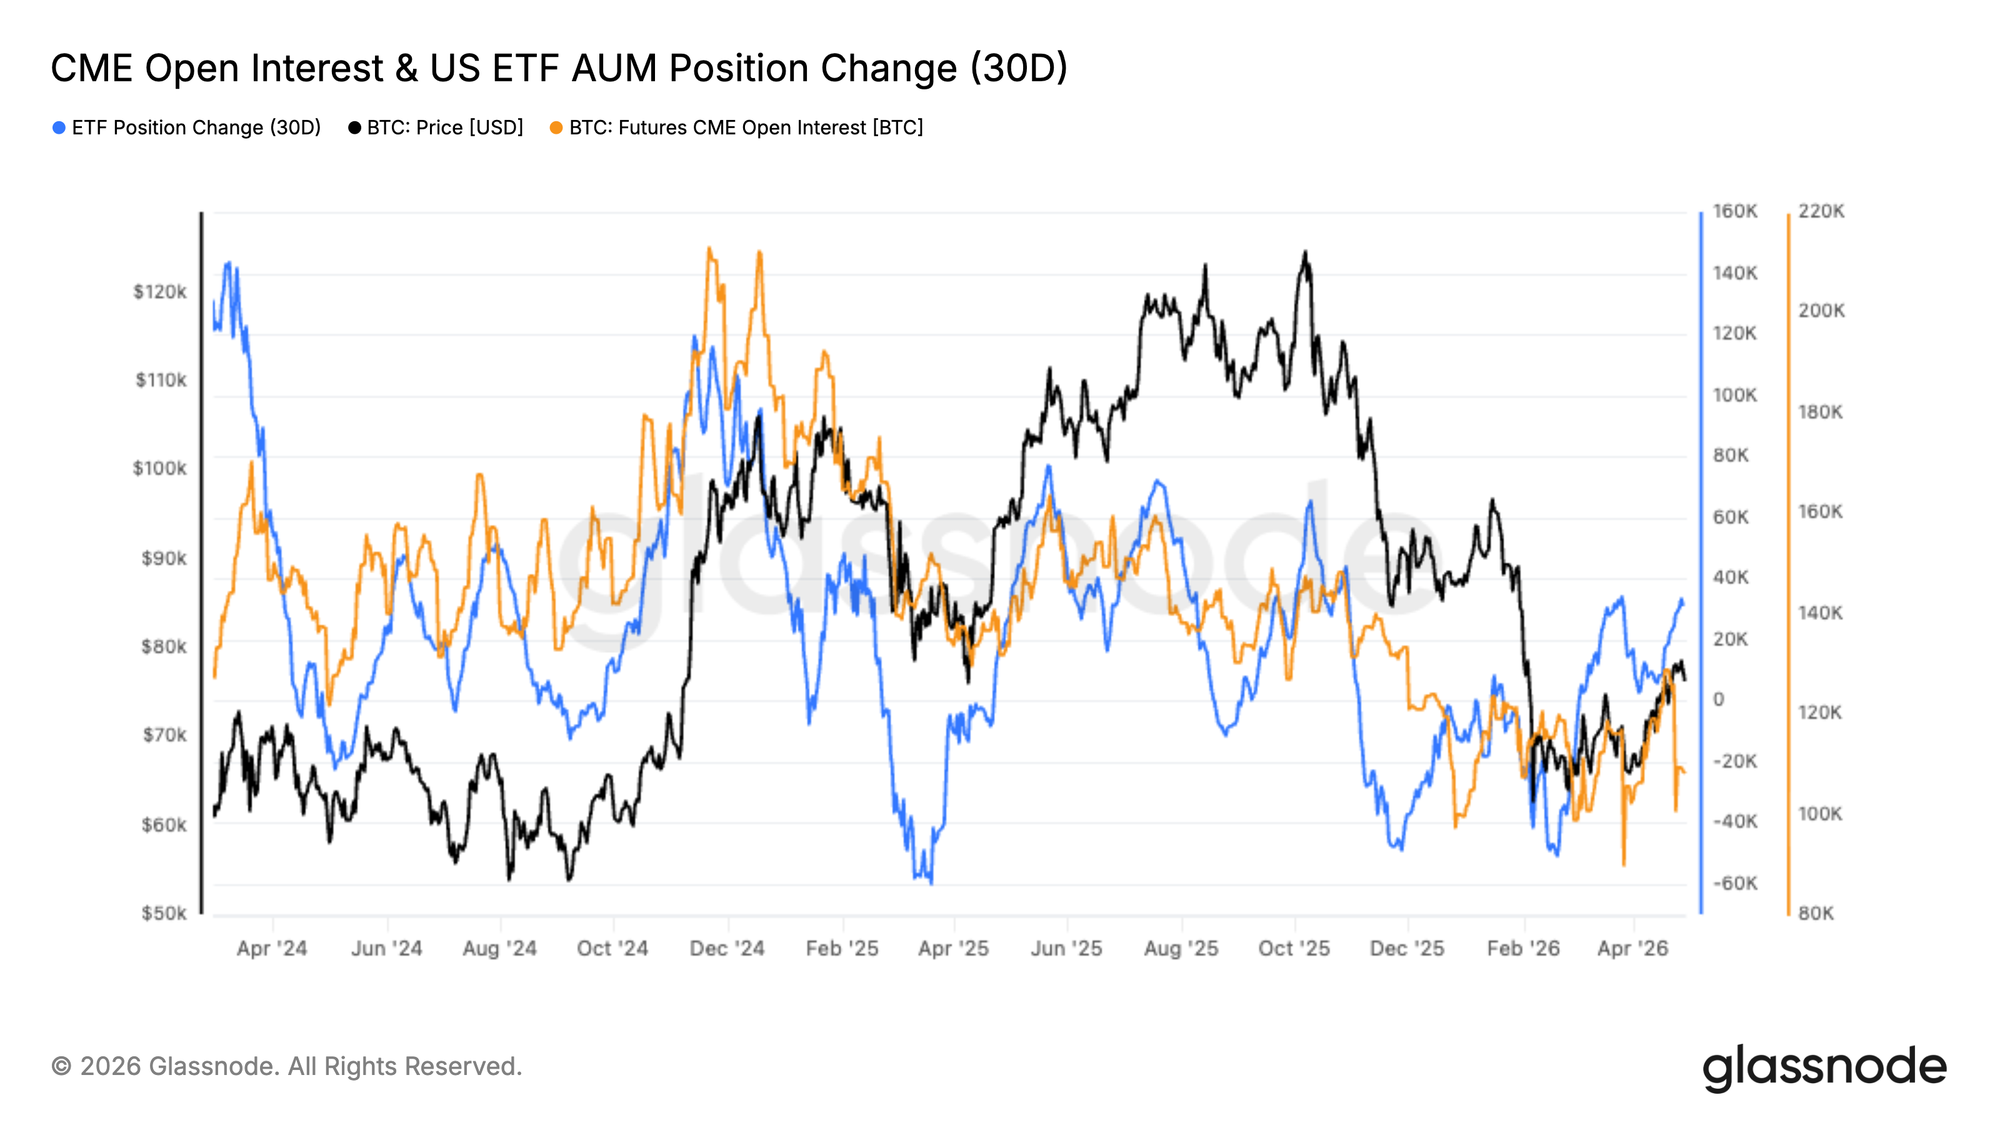
Institutional positioning is beginning to stabilise, with both CME Open Interest and US Spot ETF AUM showing early signs of recovery after a period of outflows. ETF position change has rebounded from deeply negative levels, while CME open interest appears to be basing, suggesting early re-engagement.
Earlier declines reflected broad risk-off positioning, with capital exiting both futures and ETF channels during the correction. The recent uptick points to a shift toward cautious re-accumulation, rather than aggressive positioning.
Sustained inflows will be needed to support a stronger trend. For now, the data signals early-stage institutional re-entry, but not yet full conviction.
Deepest Short Bias on Record
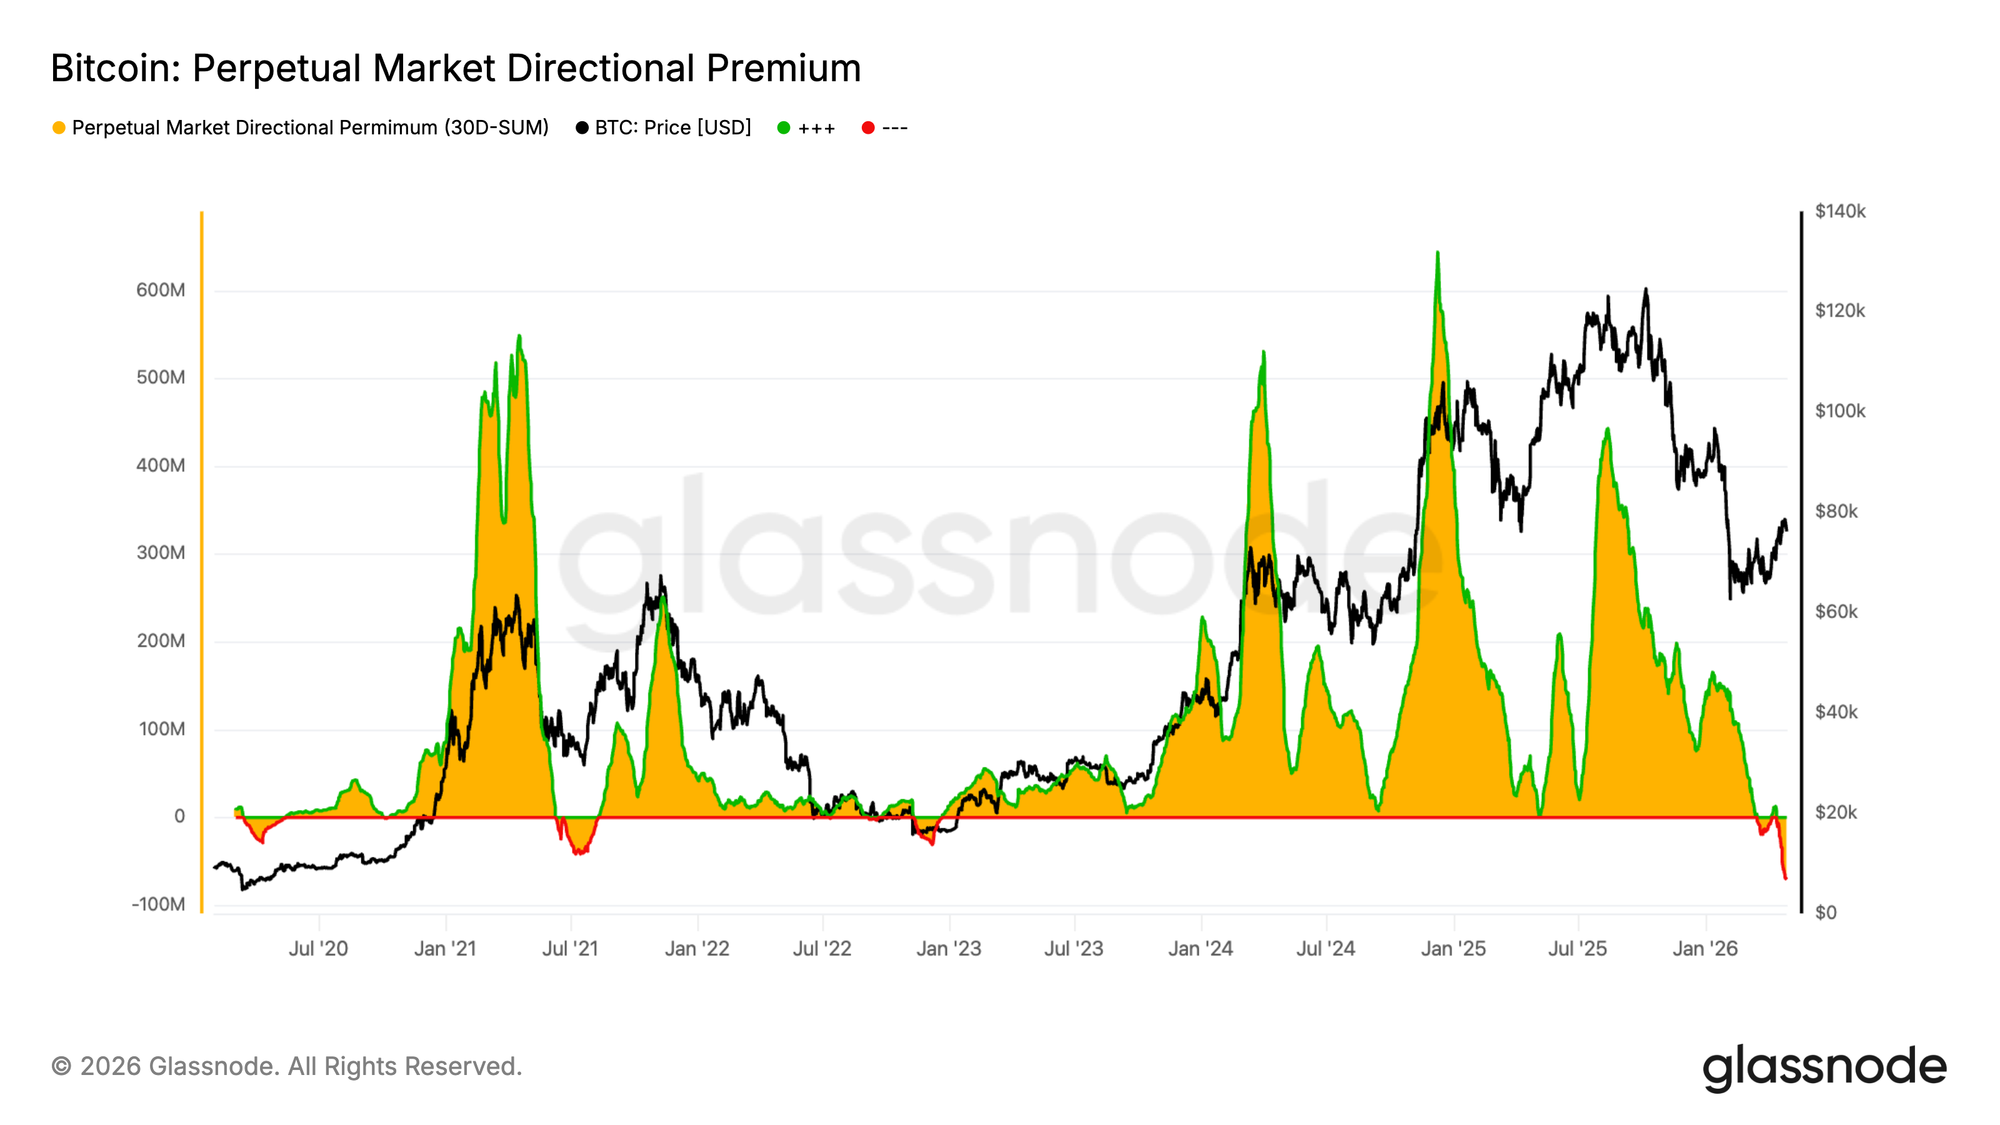
The Perpetual Market Directional Premium has dropped to its most negative level on record, marking the deepest sustained short bias in this dataset. Unlike prior cycles, where dips below zero were brief and tied to capitulation, this move reflects a more persistent defensive stance.
The extreme discount is driven by a combination of factors. Recent price weakness has triggered increased hedging and outright shorting in perp markets, while the unwind of previously crowded longs has accelerated the move via liquidations. At the same time, muted spot demand and softer ETF flows have reduced the natural bid, allowing derivatives to dominate short-term price action.
Historically, such extremes emerge during periods of elevated uncertainty and often precede inflection points. While near-term uncertainty remains, the market is increasingly positioned for a squeeze should sentiment or spot demand improve.
Implied Volatility Drifts Lower Across the Curve
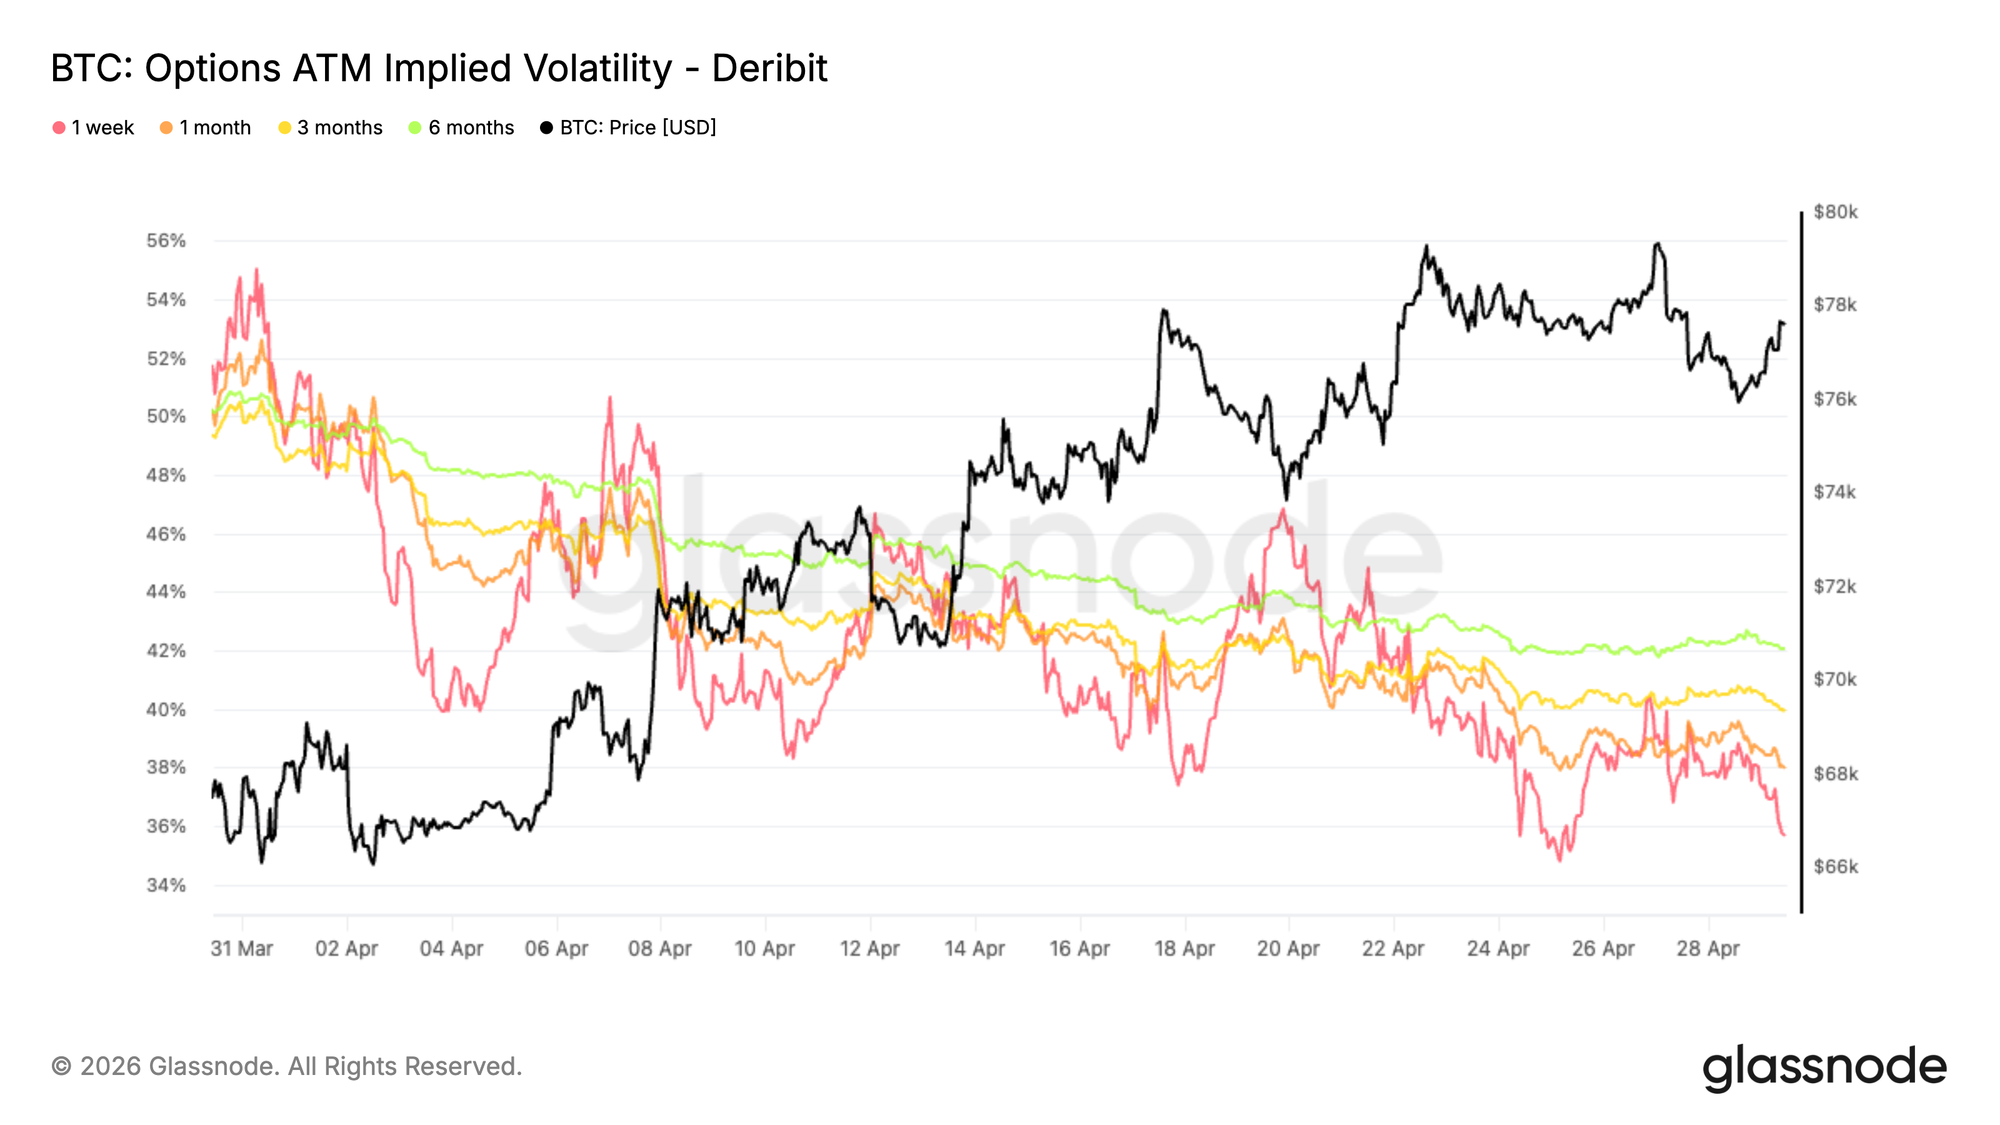
Looking back on April, starting with implied volatility, the dominant move has been a broad compression across maturities.
Volatility has declined by around 16 percentage points on the 1 week at the money, and roughly 8 points on the 6 month tenor. Other maturities sit within that range, with an average decline of about 10 volatility points.
The curve remains in contango, meaning longer dated options still trade at a premium to short dated ones, but at a lower level. This reflects a market pricing in a more stable environment ahead.
Lower implied volatility reduces the cost of optionality, particularly on the upside. At the same time, demand for protection appears to have eased. Traders are no longer willing to pay elevated premiums for volatility exposure, aligning with the recent price recovery and pointing to a normalization in expectations rather than a build up of conviction.
25 Delta Skew Trends Lower but Protection Persists
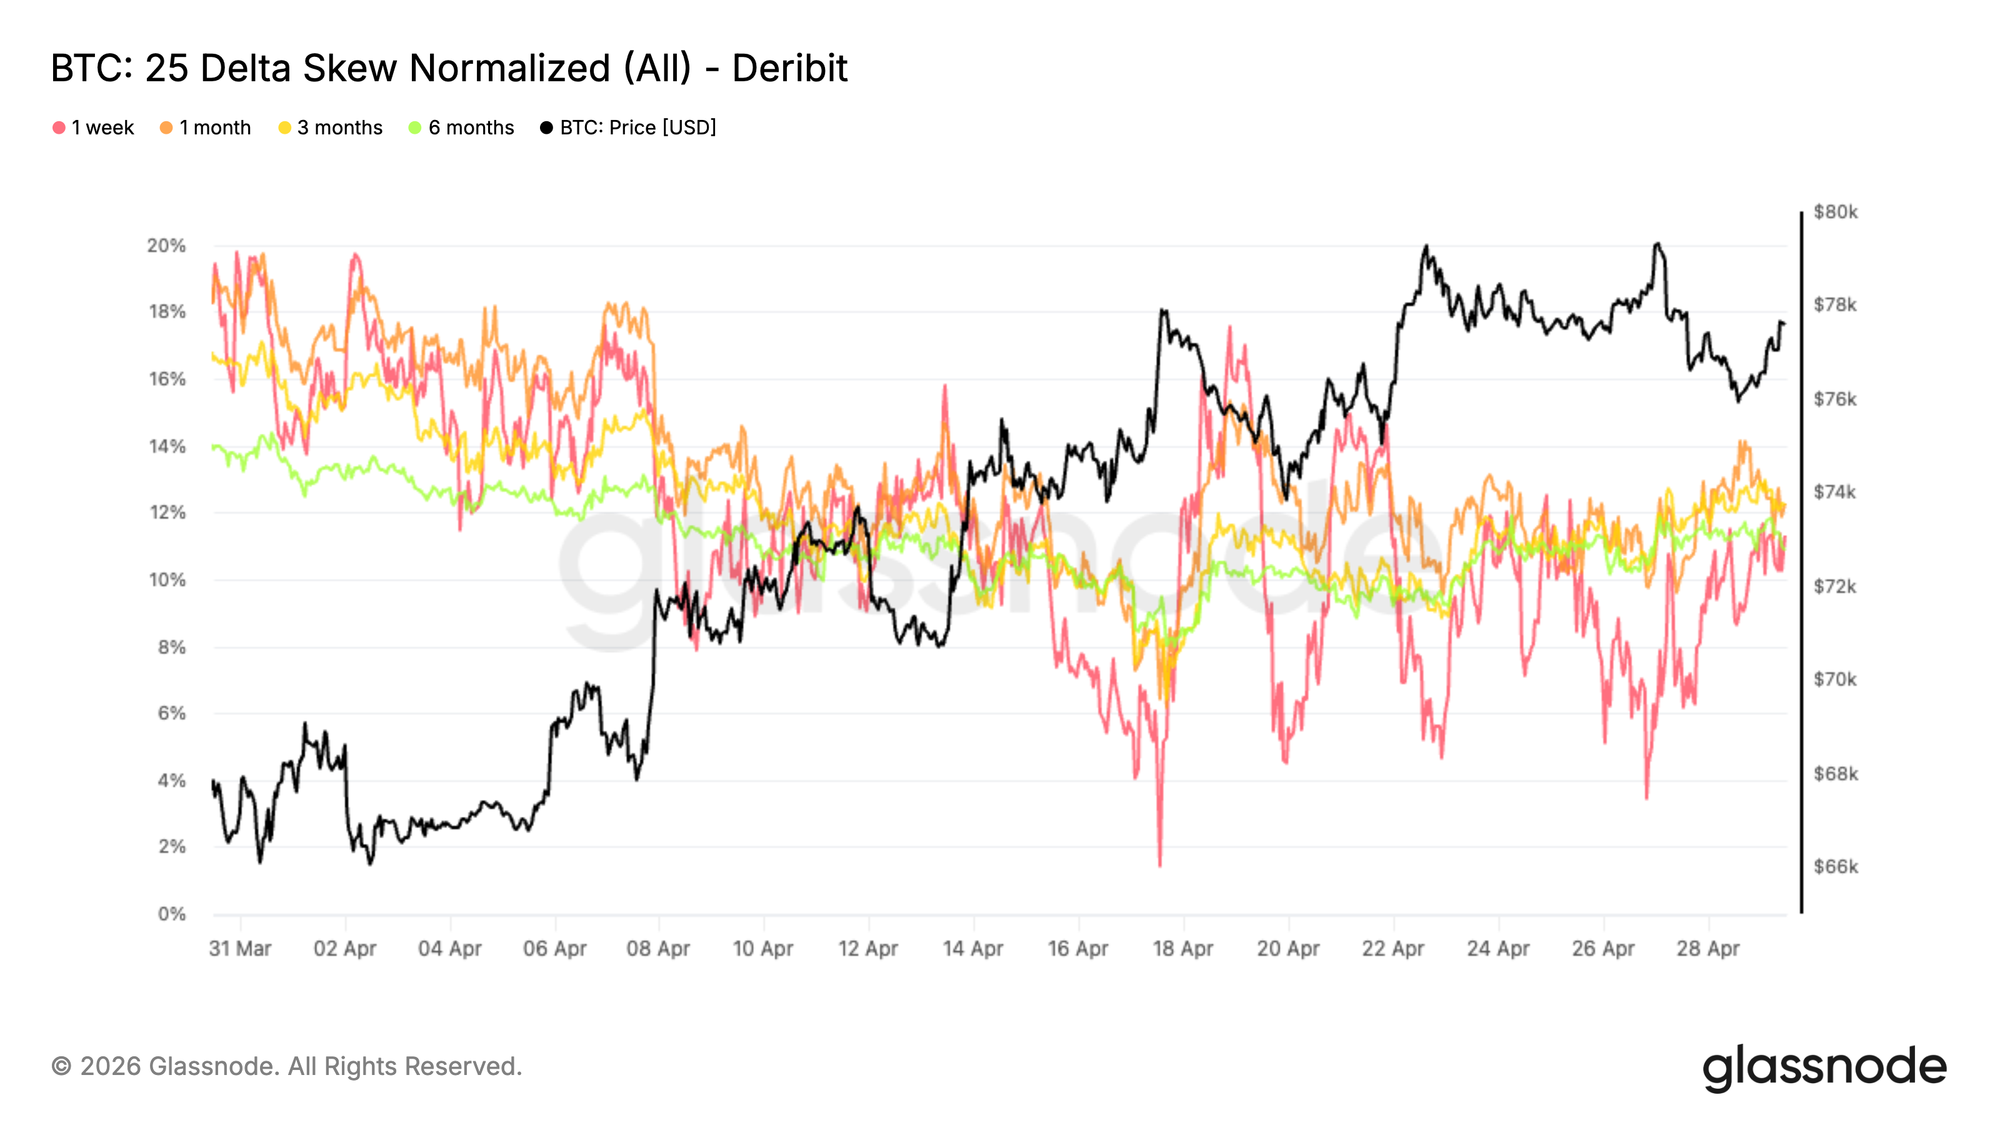
Following the compression in implied volatility, skew shows how demand evolved through April. The broader trend has been a steady decline in put premium, with the 1 month skew moving from around 18 percent to 12 percent. This reflects a clear reduction in demand for downside protection as conditions stabilized.
On the short end, the 1 week skew has been more reactive, with several spikes toward neutrality between 2 and 4 percent at multiple points throughout April. These moves were largely tactical, as pullbacks were used to buy calls and sell downside, temporarily flattening the skew.
More recently, as price approaches the 80K resistance, put demand has picked up again, pushing skew back toward the 11 to 12 percent range across maturities. Protection remains in place, with the market adjusting tactically in the short term while maintaining a cautious stance further out the curve.
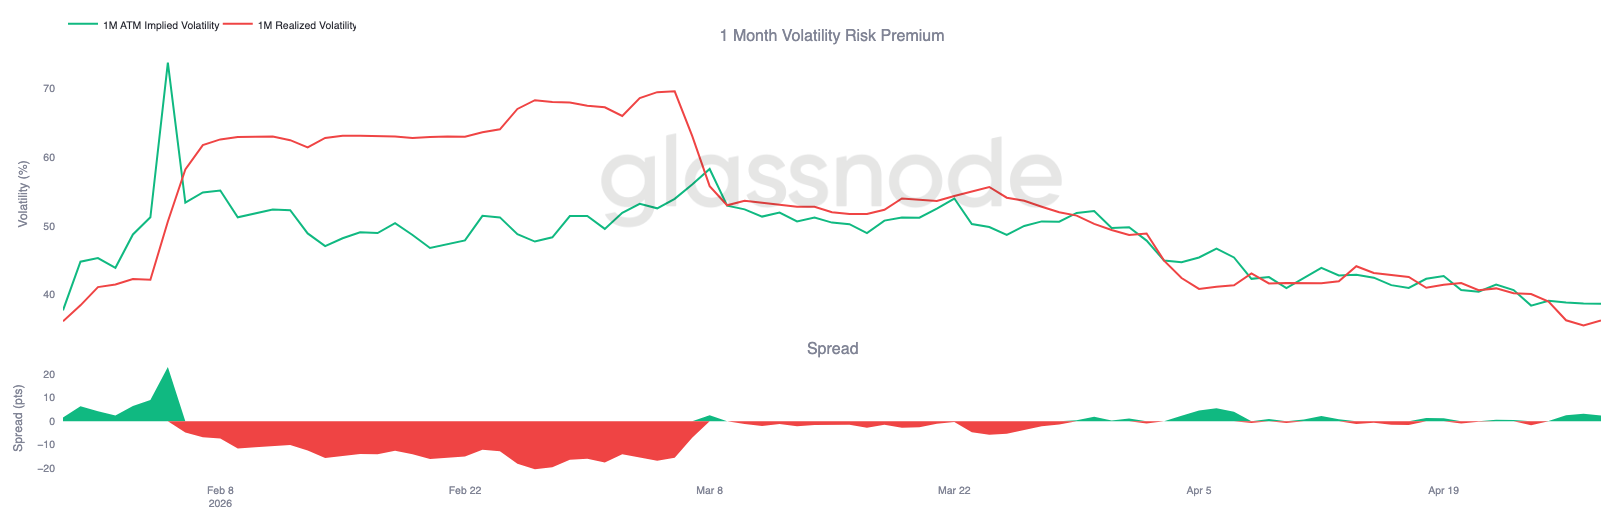
Realized Volatility Confirms the Shift Lower
As implied volatility continues to compress, realized volatility is moving in the same direction and reinforcing the trend. BTC has seen a steady decline in realized volatility. This alignment between implied and realized volatility matters, as it reduces the need for a meaningful volatility premium to compensate for uncertainty.
When realized volatility falls, it naturally pulls implied volatility lower, as the need to price in large price swings diminishes. This creates a feedback loop where cheaper options reduce the urgency to hedge, leading to less hedging-driven price movement.
The 1 month realized volatility sits around 36, while implied is near 38, leaving only a small premium for volatility sellers to earn for holding the risk.
The current environment reflects a transition away from stress toward a more balanced regime. Volatility is no longer being bid aggressively, and the market appears comfortable with a narrower range of expected price movement.
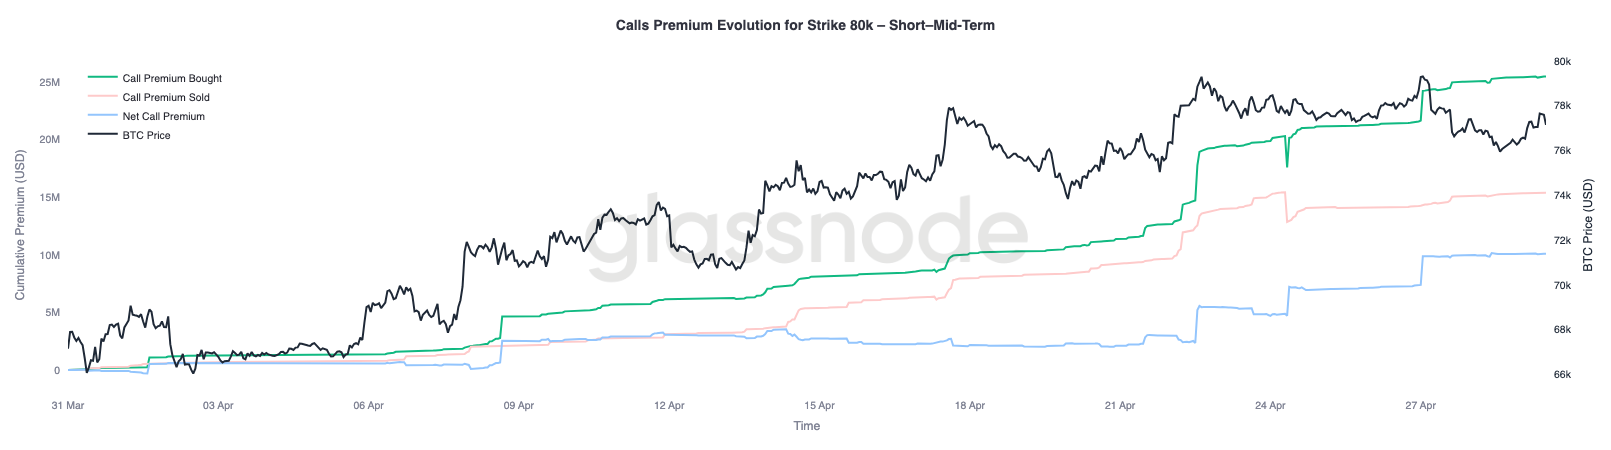
80K Strike Premium Builds Into a Key Pivot
With volatility and skew both easing, positioning becomes the next layer to monitor, with the 80K level emerging as the next key focus.
Short and mid term maturities at the 80K strike are seeing sustained buying, indicating growing interest in upside exposure around this level. This suggests traders are positioning for a test of resistance rather than fading it.
At the same time, two key short gamma zones stand out, with 76K on the downside and 82K on the upside. These levels can act as areas where hedging flows amplify price action, especially in a low liquidity environment.
A break above 80K would bring spot closer to the 82K zone, where short gamma could force dealers to buy into strength, reinforcing the move. Positioning remains cautious, but increasingly exposed to a sharper upside reaction if resistance is cleared.
Conclusion
In sum, the market remains trapped below key resistance, with the True Market Mean continuing to cap upside attempts while support clusters near $65k–$70k provide a tentative floor. Spot selling pressure is beginning to ease and early signs of institutional re-engagement are emerging, but demand has yet to show the strength required for a sustained breakout.
At the same time, derivatives positioning has swung decisively bearish, with record net short exposure and elevated protection demand reflecting a defensive mindset. This leaves the market finely balanced. While the weight of positioning leans cautious, it also introduces the potential for sharp upside dislocations should flows turn.
Until a clear expansion in spot demand or institutional inflows materialises, the most likely outcome remains a choppy, range-bound environment. The next directional move will likely be driven not by positioning alone, but by whether real capital steps in to absorb supply and reclaim higher levels.
Disclaimer: This report does not provide any investment advice. All data is provided for informational and educational purposes only. No investment decision shall be based on the information provided here, and you are solely responsible for your own investment decisions.
Exchange balances presented are derived from Glassnode’s comprehensive database of address labels, which are amassed through both officially published exchange information and proprietary clustering algorithms. While we strive to ensure the utmost accuracy in representing exchange balances, it is important to note that these figures might not always encapsulate the entirety of an exchange’s reserves, particularly when exchanges refrain from disclosing their official addresses. We urge users to exercise caution and discretion when utilizing these metrics. Glassnode shall not be held responsible for any discrepancies or potential inaccuracies.