Author: Michael Nadeau, The DeFi Report
Compiled by: Glendon, Techub News
Over the past year, Solana has been the preferred platform for speculation in the cryptocurrency space. This positioning has provided the network with an invaluable "stress test." As a result, user activity, fees, developer numbers, and investor attention have all exploded.
However, this has also made the network highly vulnerable to a "cooling-off" effect once risk appetite subsides. This "cooling-off" effect arrived in the first quarter. Solana has now entered a reset mode. This article provides a comprehensive data-driven update on Solana's network performance in the first quarter and the areas we are focusing on next.
Operational Performance
Real Economic Value
Data source: DeFi Report
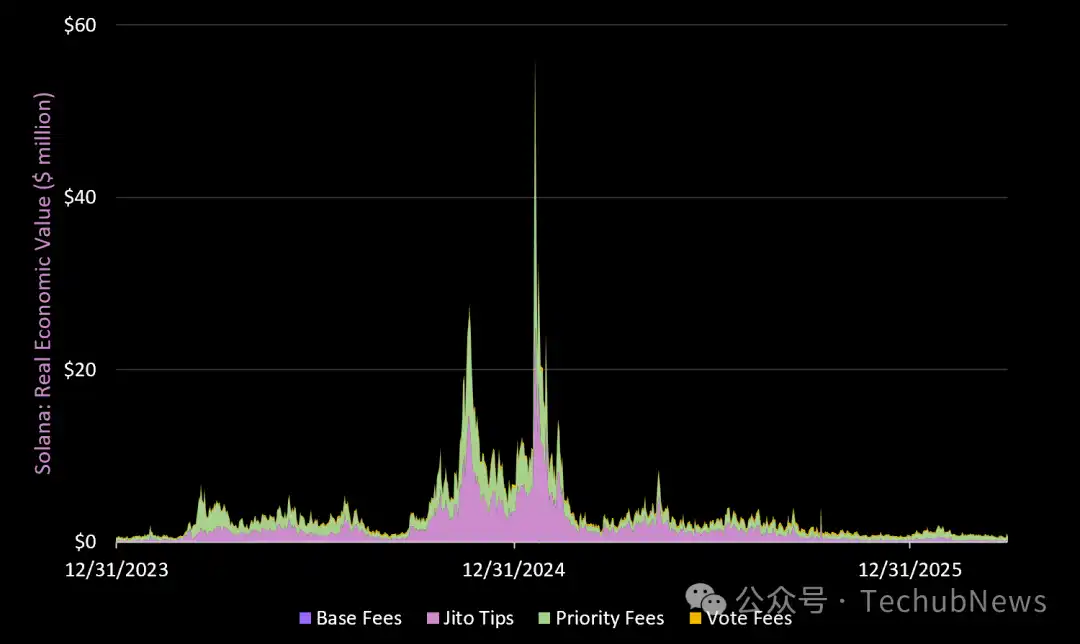
REV = Base fees, priority fees, MEV (Jito tips), and voting fees for accessing L1 block space. MEV (Jito tips) is distributed to SOL holders through staking. The remaining fees go to validators, with 50% of the base fees being burned.
The total fees for the Solana network in the first quarter were $89.9 million—the lowest level since Q3 2023. This represents a 1.4% decrease from the previous quarter and a 68% decrease year-on-year.
For reference, Ethereum L1 generated $82 million in fees in the first quarter.
A breakdown is as follows:
-
Base fees: Decreased 8.7% in Q1 but increased 9.4% year-on-year;
-
Jito tips (MEV): Decreased 19.7% in Q1 and 72.3% year-on-year;
-
Priority fees: Increased 23% in Q1 but decreased 68.8% year-on-year;
-
Voting fees: Decreased 44.5% in Q1 and 16.4% year-on-year.
Key Takeaways
Solana was the "base for speculation" in the last cycle (tied with Hyperliquid). The strongest applications on the network (Pump, Axiom, Raydium, Jupiter) are all geared toward retail traders, leading to highly cyclical on-chain revenue that is heavily dependent on speculative demand.
This chart also helps visualize the period when speculation reached its most extreme levels in the last cycle: late 2024 to early 2025. Since that period, Solana's social attention and on-chain activity have been on a downward trend. It is difficult to see this trend reversing in the short term.
On the positive side, Pump Fun has performed relatively robustly during the bear market, and we are beginning to see emerging fintech companies building stablecoin applications on Solana (detailed later in the report). Ultimately, we believe Solana needs to compete with Hyperliquid for perpetual traders and lead the tokenization of on-chain equities (and other real-world assets) to mitigate the extreme cyclicality of its on-chain user base.
Real On-Chain Yield
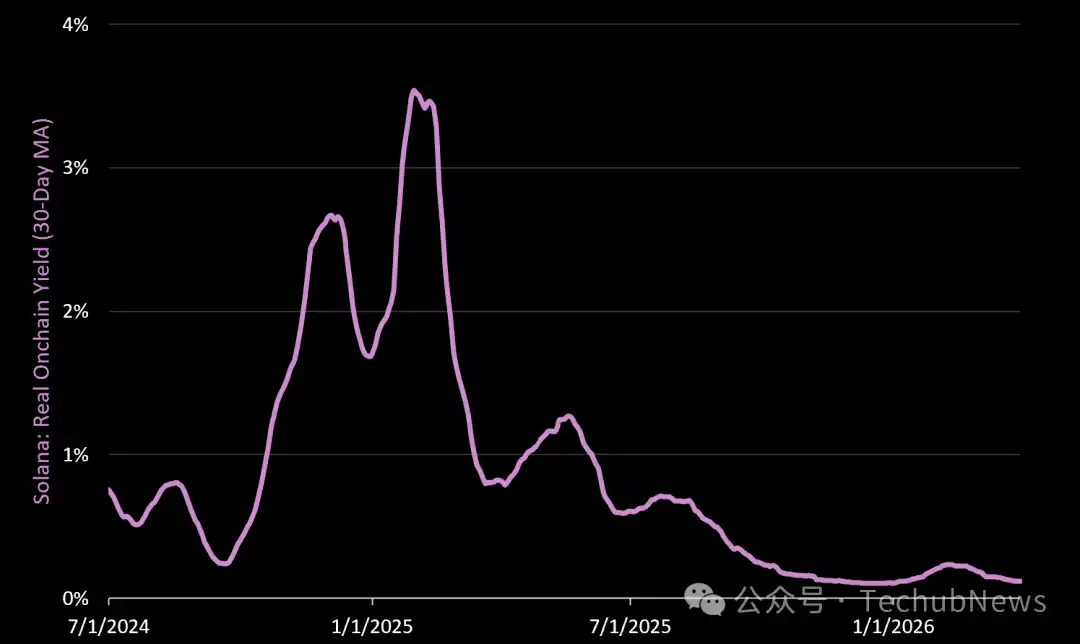
Real on-chain yield = MEV paid to validators and passed on to SOL stakers (excluding operator payments).
-
The average real on-chain yield (annualized) in Q1 was 0.17%, up 33% from the previous quarter but down 67% year-on-year. The growth in Q2 can be attributed to extreme volatility in decentralized exchanges from late January to early February.
-
The 67% year-on-year decline indicates that a significant amount of speculative froth has exited the ecosystem since the frenzy we saw in Q1 last year (when multiple G20 leaders launched meme coins on Solana).
Total On-Chain Yield
Total on-chain yield = MEV + protocol issuance paid to validators and passed on to SOL stakers (excluding operator payments).
-
The total on-chain yield (average annualized) in Q1 was 6.7%, with 89% coming from newly issued SOL.
-
Total on-chain yield increased by 0.25% this quarter but decreased by 66% year-on-year.
Network Fundamentals
Monthly GDP
GDP = Total fees generated by top on-chain applications (excluding on-chain fees). Solana's top applications generated $451 million in network GDP in Q1 (5 times the L1 REV), down 7% from Q4 2025 and down 54% year-on-year.
Top 10 applications:
-
Pump Fun (social/retail trading): $103 million (up 3% in Q1, down 13% year-on-year)
-
Circle (stablecoin): $63 million (down 28% in Q1, up 105% year-on-year)
-
Axiom (trading app): $46 million (down 24% in Q1, up 1829% year-on-year)
- Jupiter (DEX aggregator & trading app): $45 million (down 3% in Q1, down 45% year-on-year)
-
GMX (perpetuals DEX): $32 million (significantly up from $160k in Q4)
-
Phantom (wallet): $29 million (down 12% in Q1, down 46% year-on-year)
-
Raydium (DEX & launchpad infrastructure): $24.6 million (down 26% in Q1, down 83% year-on-year)
-
Tether (stablecoin): $20.5 million (up 24% in Q1, up 85% year-on-year)
-
Jito (trade execution): $19.9 million (down 19% in Q1, down 72% year-on-year)
-
Orca (public DEX): $14.3 million (down 34% in Q1, down 55% year-on-year)
For reference, applications on Ethereum L1 generated $1.9 billion in GDP in Q1 (4.2 times that of Solana).
Key Takeaways
Pump Fun's Q1 revenue exceeded that of Solana L1. However, SOL's current valuation is 77 times that of Pump Fun (43 times on a fully diluted basis). We believe there is a misalignment here. This is why PUMP is currently on the watchlist.
Active Addresses

Unique active addresses = Unique wallet addresses initiating at least one transaction per day. The Solana network averaged 2.4 million daily active addresses in Q1, up 7.5% quarter-on-quarter but down 4.8% year-on-year.
SOL Active Staking
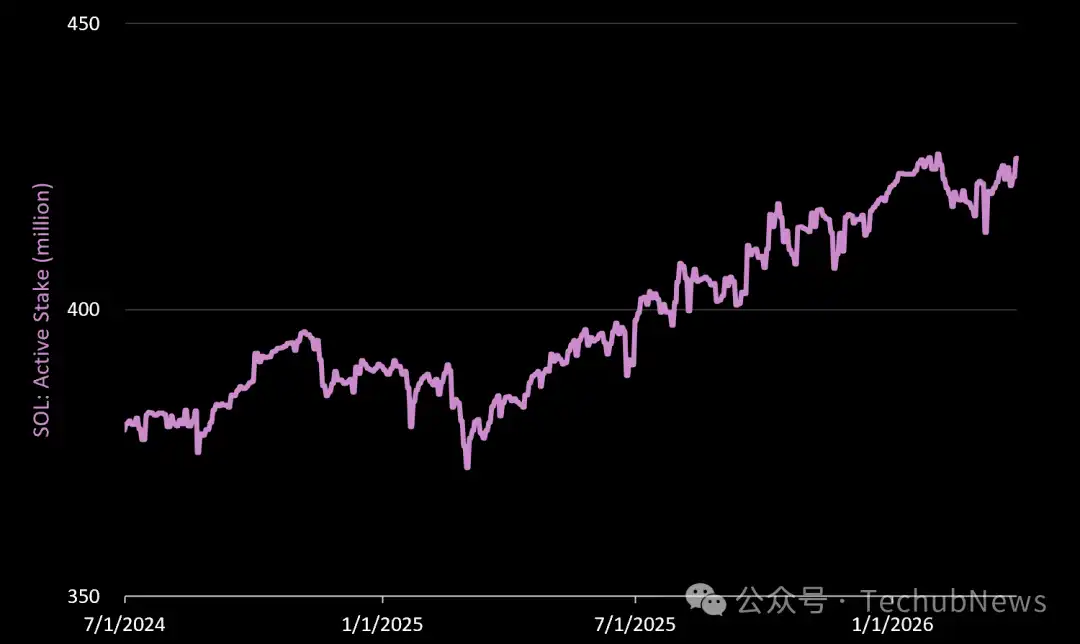
Active staking increased by 1.2% in Q1 and 10.8% year-on-year. As of March 31, 2026, 426.4 million SOL were staked on the network, accounting for 74.4% of the circulating supply and 68% of the total supply.
Key Takeaways
Unlike Ethereum, an increase in SOL staking does not increase the new issuance paid to validators. Instead, issuance follows a fixed, disinflationary schedule, decreasing by 15% annually until it reaches 1.5% per year.
Cost to Generate $1 in Revenue (REV)
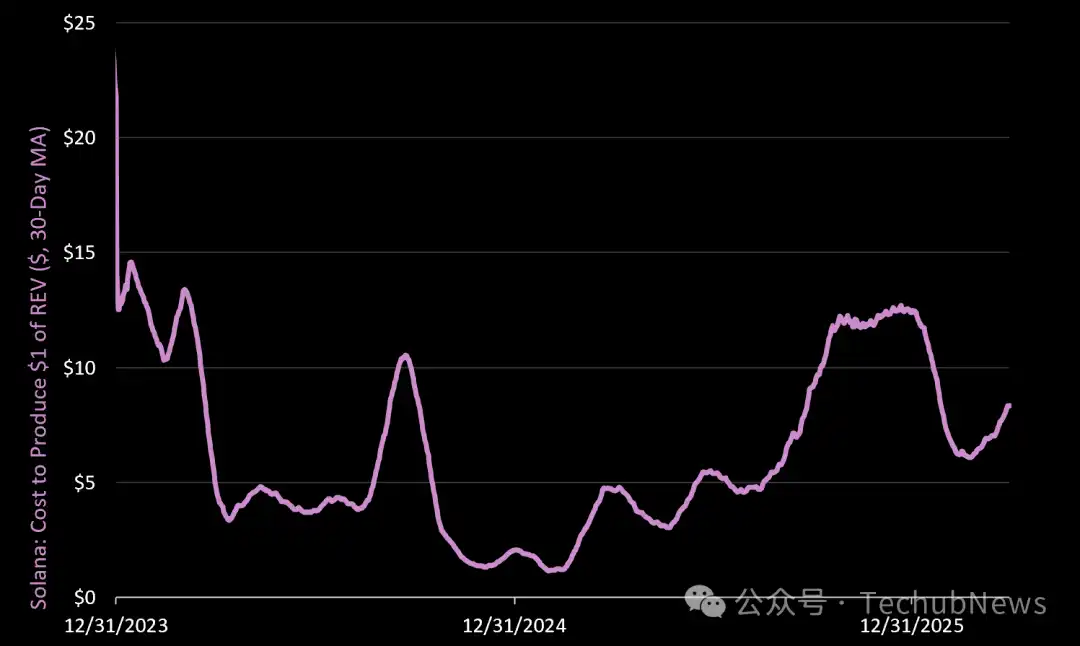
The average cost to generate $1 in real economic value in Q1 was $8.10, down 31% quarter-on-quarter but up 93% year-on-year.
Why is this important?
An increase in the cost to generate $1 of real economic value indicates that more issuance (network inflation) is required to secure the network relative to the real value generated in the quarter. This suggests that network costs/operating expenses fell faster than revenue in Q1.
For reference, Ethereum's cost to produce $1 of REV in Q1 was $13.79.
Stablecoins
Stablecoin Supply
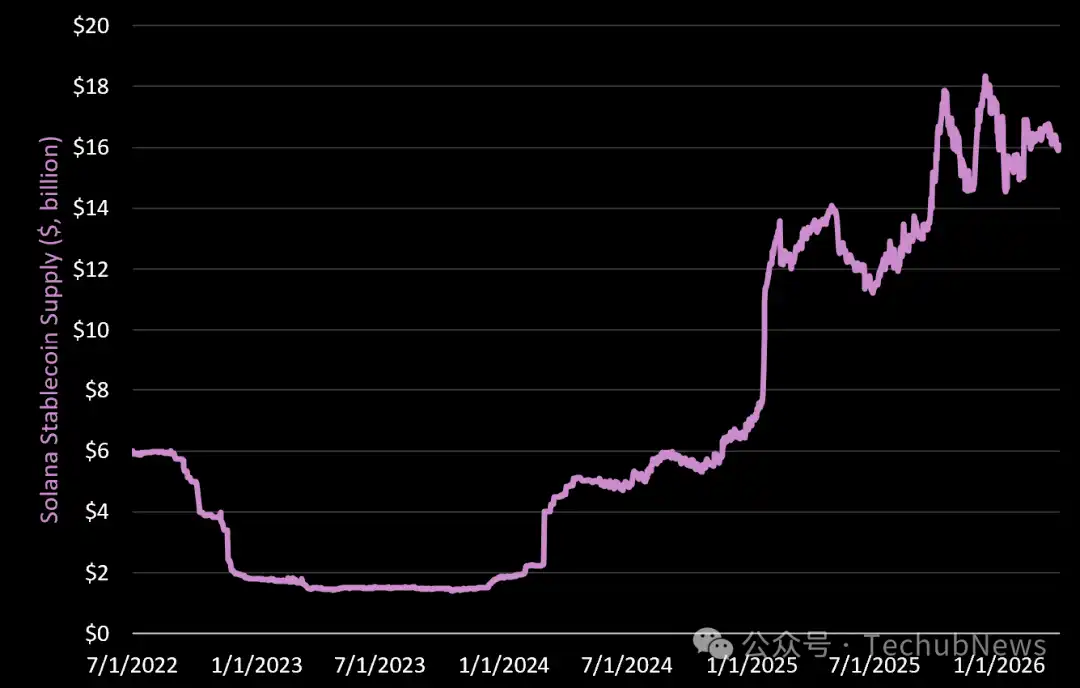
Solana now has a total of $15.9 billion in stablecoins on its network, down 2.7% in Q1 but up 18% year-on-year. This accounts for 4.5% of all stablecoin supply in cryptocurrency, placing Solana behind Ethereum, Tron, and BNB.
Major stablecoin issuers on the Solana platform:
-
Circle/USDC: $9.0 billion (down 16% in Q1, down 11% year-on-year).
-
Tether/USDT: $3.5 billion (up 27% in Q1, up 46% year-on-year).
-
Paypal/USDPY: $720 million (down 23% in Q1, but up 440% year-on-year).
-
Paxos/USDG: $940 million (up 8% in Q1, up 1021% year-on-year).
-
World Liberty Finance/USD1: $884 million (up 670% in Q1).
-
Solstice/USX: $355 million (up 16% in Q1).
We expect to see more stablecoin innovation on Solana in the following areas:
-
Latin American fintech companies serving remittances, payroll, card/exchange fees. Promising examples include Rain, Morse, and Takenos.
-
Licensed US fintech companies using stablecoins to offer new payroll solutions. We believe this could emerge after the passage of the Clarity Act, and we still believe the ultimate winning stablecoin issuer will offer a suite of services around the token.
Stablecoin Velocity
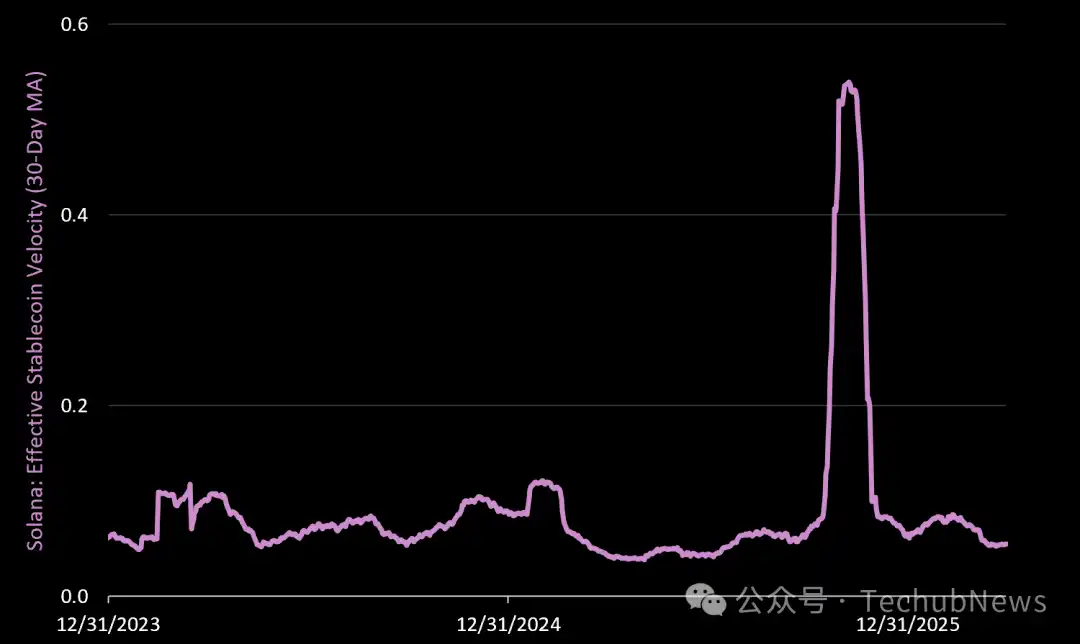
Effective stablecoin velocity measures the daily turnover rate per dollar of stablecoin supply on-chain. This metric filters out noise like wash trading and circular trades to derive true velocity, measured as daily net USD transfer volume / circulating supply. A rising value indicates increased economic activity on the Solana network.
-
Stablecoin velocity averaged 0.07 in Q1, down 69% quarter-on-quarter but up 29% year-on-year.
-
A reading of 0.07 in Q1 indicates that 7% of the stablecoin supply "turned over" daily during the quarter. For reference, Ethereum L1 turned over 2% of its stablecoin supply daily in Q1.
As emerging fintech companies building on Solana integrate with new regulations, we expect stablecoin velocity to grow steadily over the coming years, with reduced cyclicality/reliance on "risk-on" trading/speculation.
Tokenomics
Net Dilution Rate
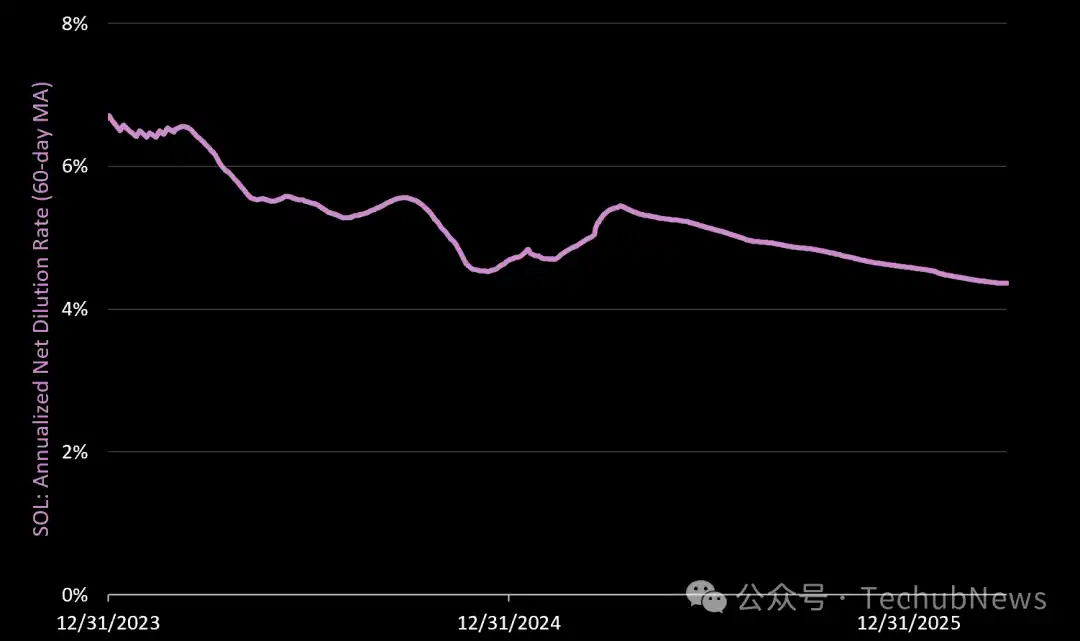
Net dilution rate = Daily protocol issuance minus burned SOL / circulating supply (annualized). A positive net dilution rate is dilutive to (unstaked) SOL holders.
SOL's net dilution rate (annualized) in Q1 was 4.38%, down 5.3% in Q1 and down 7.7% year-on-year. Drivers:
-
SOL Issuance: 6.26 million in Q1 (down from 6.45 million in Q4)
-
SOL Burned: 677,000 in Q1 (up from 637,000 in Q4)
-
Net Result: 6.19 million new SOL issued in Q1 (4.38% annualized inflation rate)
Note that, unlike Ethereum, an increase in staked assets does not increase the amount of SOL received by Solana validators. This means SOL issuance on Solana is always decreasing (the network is pre-programmed to do so, with a 15% annual disinflation rate).
What does this mean for validators/stakers?
When more SOL is staked on the network, staking yields will decrease if on-chain fees cannot make up the difference.
DeFi
DEX Volume
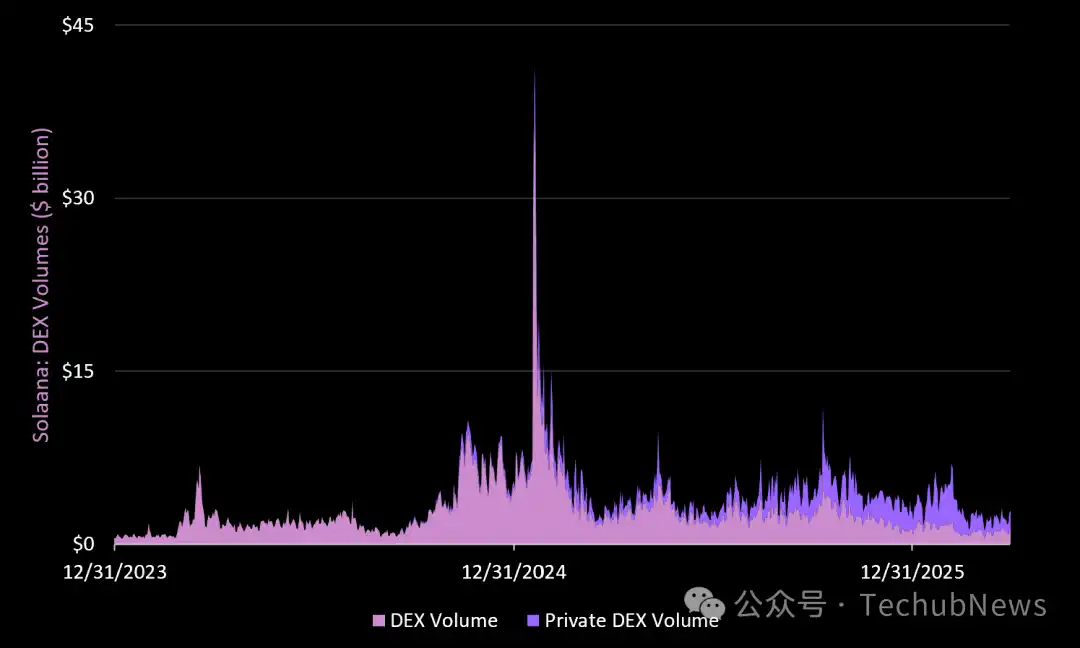
This sector includes 11 public DEXs and 9 private DEXs. The story within Solana DeFi remains the growth of private DEXs (which now dominate).
-
The average (total) daily DEX volume in Q1 was $3.2 billion, down 32% quarter-on-quarter and down 4% year-on-year. For reference, Ethereum L1 DEXs averaged $2.0 billion in daily volume in Q1, or $3.6 billion including L2 DEXs.
-
Private DEXs accounted for 60% of the volume ($1.9 billion/day) but declined 14% in Q1.
-
Public DEXs averaged $1.3 billion in daily volume in Q1, down 47% from Q4 and down 37% year-on-year.
Top DEXs on Solana by volume:
-
HumidiFi Private DEX: $613 million daily volume (down 55% in Q1).
-
BisonFi Private DEX: $574 million daily volume (up 614% in Q1).
-
Meteora Public DEX: $447 million daily volume (down 36% in Q极).
-
Raydium Public DEX: $298 million/day (down 69% in Q1, down 60% year-on-year).
-
Orca Public DEX: $278 million daily volume (down 41% in Q1, down 21% year-on-year).
DeFi Velocity
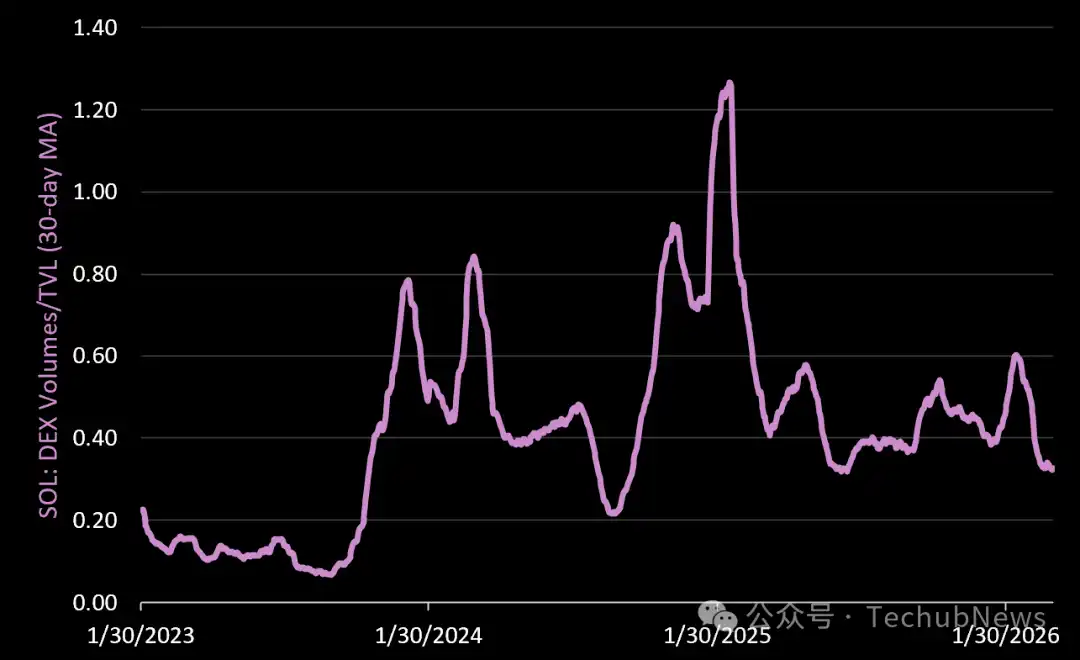
DeFi velocity measures the turnover rate of every dollar within DeFi protocols. When this value is greater than 1, it means the network's daily volume exceeds the total value locked in DeFi protocols. DeFi velocity averaged 0.43 in Q1, meaning the network turned over its TVL at an average rate of 43% per day. This was down 7% quarter-on-quarter and down 23% year-on-year.
Key Takeaways
Last week, we noted that the network dilution rate is the most important metric for Ethereum. For SOL, we believe DeFi velocity is the most important. Why?
Solana's core thesis is "fast DeFi." Speed and turnover rate are primary drivers of network fees. This is also why Solana's real yield consistently higher than Ethereum's in 2024/2025. We believe Solana's velocity will ultimately make it a magnet for capital in higher risk-on environments. This makes SOL an extremely responsive, high-beta asset.
New Trading Tokens
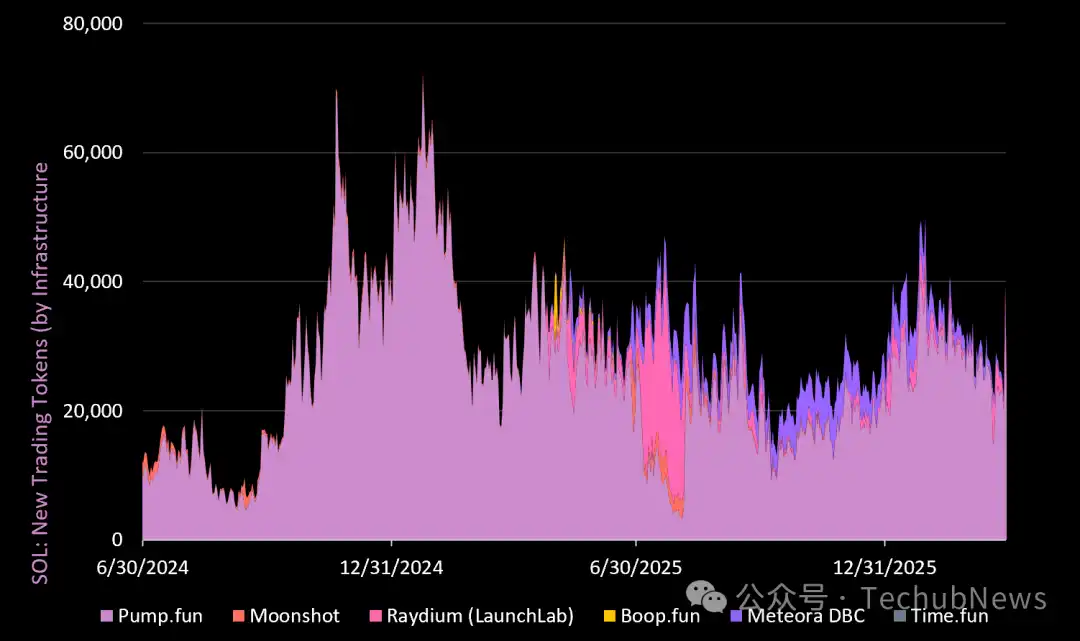
New trading tokens = Number of tokens created on Solana launchpads.
A total of 3 million tokens were created on Solana in Q1, up 42% from the previous quarter and up 21% year-on-year. Among them, Pump Fun continued to lead the market, adding 2.5 million new tokens in Q1 (capturing 85% market share). Pump Fun's performance during the bear market has been impressive and remains a major highlight within the Solana ecosystem (alongside the growth of private DEXs). Again, this application generated more revenue in Q1 than Solana L1.
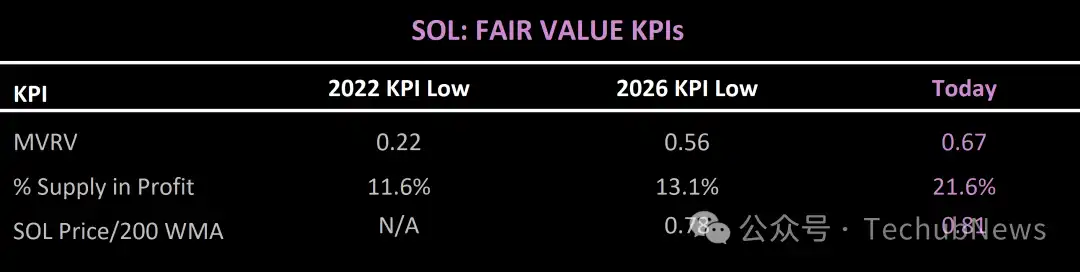
Fair Value Key Performance Indicators
Conclusion
In the last cycle, Solana was the "speculator's paradise," and it also attracted more new cryptocurrency users than any other blockchain. This allowed the network to: establish itself as the place to "build" by generating some of the fastest-growing and most profitable crypto applications (Pump, Axiom, Jupiter, etc.), and stress-test the network infrastructure (successfully).
Today, while developers may not be as "frazzled" as in 2022, the network is undoubtedly experiencing the latest round of reset. Looking ahead, we see five key pillars that could determine Solana's success in the next expansion:
-
Consumer/retail trading use case. For years, crypto-native venture capital firms have been funding on-chain "gaming" use cases. But true games barely exist in crypto. "Gaming" means retail trading. And, it is arguably the most valuable use case in crypto. As noted in the report, Pump Fun has been a major bright spot for Solana even in the current bear market. The team is now focused on improving the mobile experience to make it a mainstream social/trading app (rather than a crypto-native desktop terminal).
-
Perpetuals market. Solana needs to compete with Hyperliquid here. Notably, Solana's hottest perpetuals DEX (Drift) was exploited on April 1st, with nearly half its TVL stolen by hackers. This was a significant blow to the ecosystem, as it was already losing ground to Hyperliquid. This may now open the door for competitors or new builders to launch perpetuals projects on Solana—something to watch closely.
-
Bringing in Traditional Finance (TradFi). To become the "Nasdaq on the blockchain," Solana needs Nasdaq's assets. This means it needs to attract asset issuers who want to tokenize their assets (stocks, bonds, etc.). Beyond regulation, finding an incentive structure that works for issuers is likely the biggest hurdle. This will take some time.
-
Becoming the leading public blockchain for businesses building fintech products using stablecoins, especially in emerging markets like Latin America.
-
Continuing to win the "developer wars." Compared to its peers in crypto, the Solana Foundation operates more like a well-managed tech company. As a result, Solana tends to have a stronger developer pipeline, facilitated by a global "hacker house" program to find and onboard developers to Solana. Continued organization and investment in this area are crucial for the network's ongoing success. For reference, Solana's full-time developers are currently down 32%, while Ethereum's are down 29%.