Over the past two weeks, the anticipated relief rally has largely played out, with price advancing into resistance before stalling beneath the Short-Term Holder cost basis, reaffirming the presence of meaningful overhead supply. Against this backdrop, this edition examines the structure and behaviour of that overhang, with a focus on emerging sell-side dynamics.
Relief Rally Meets Resistance
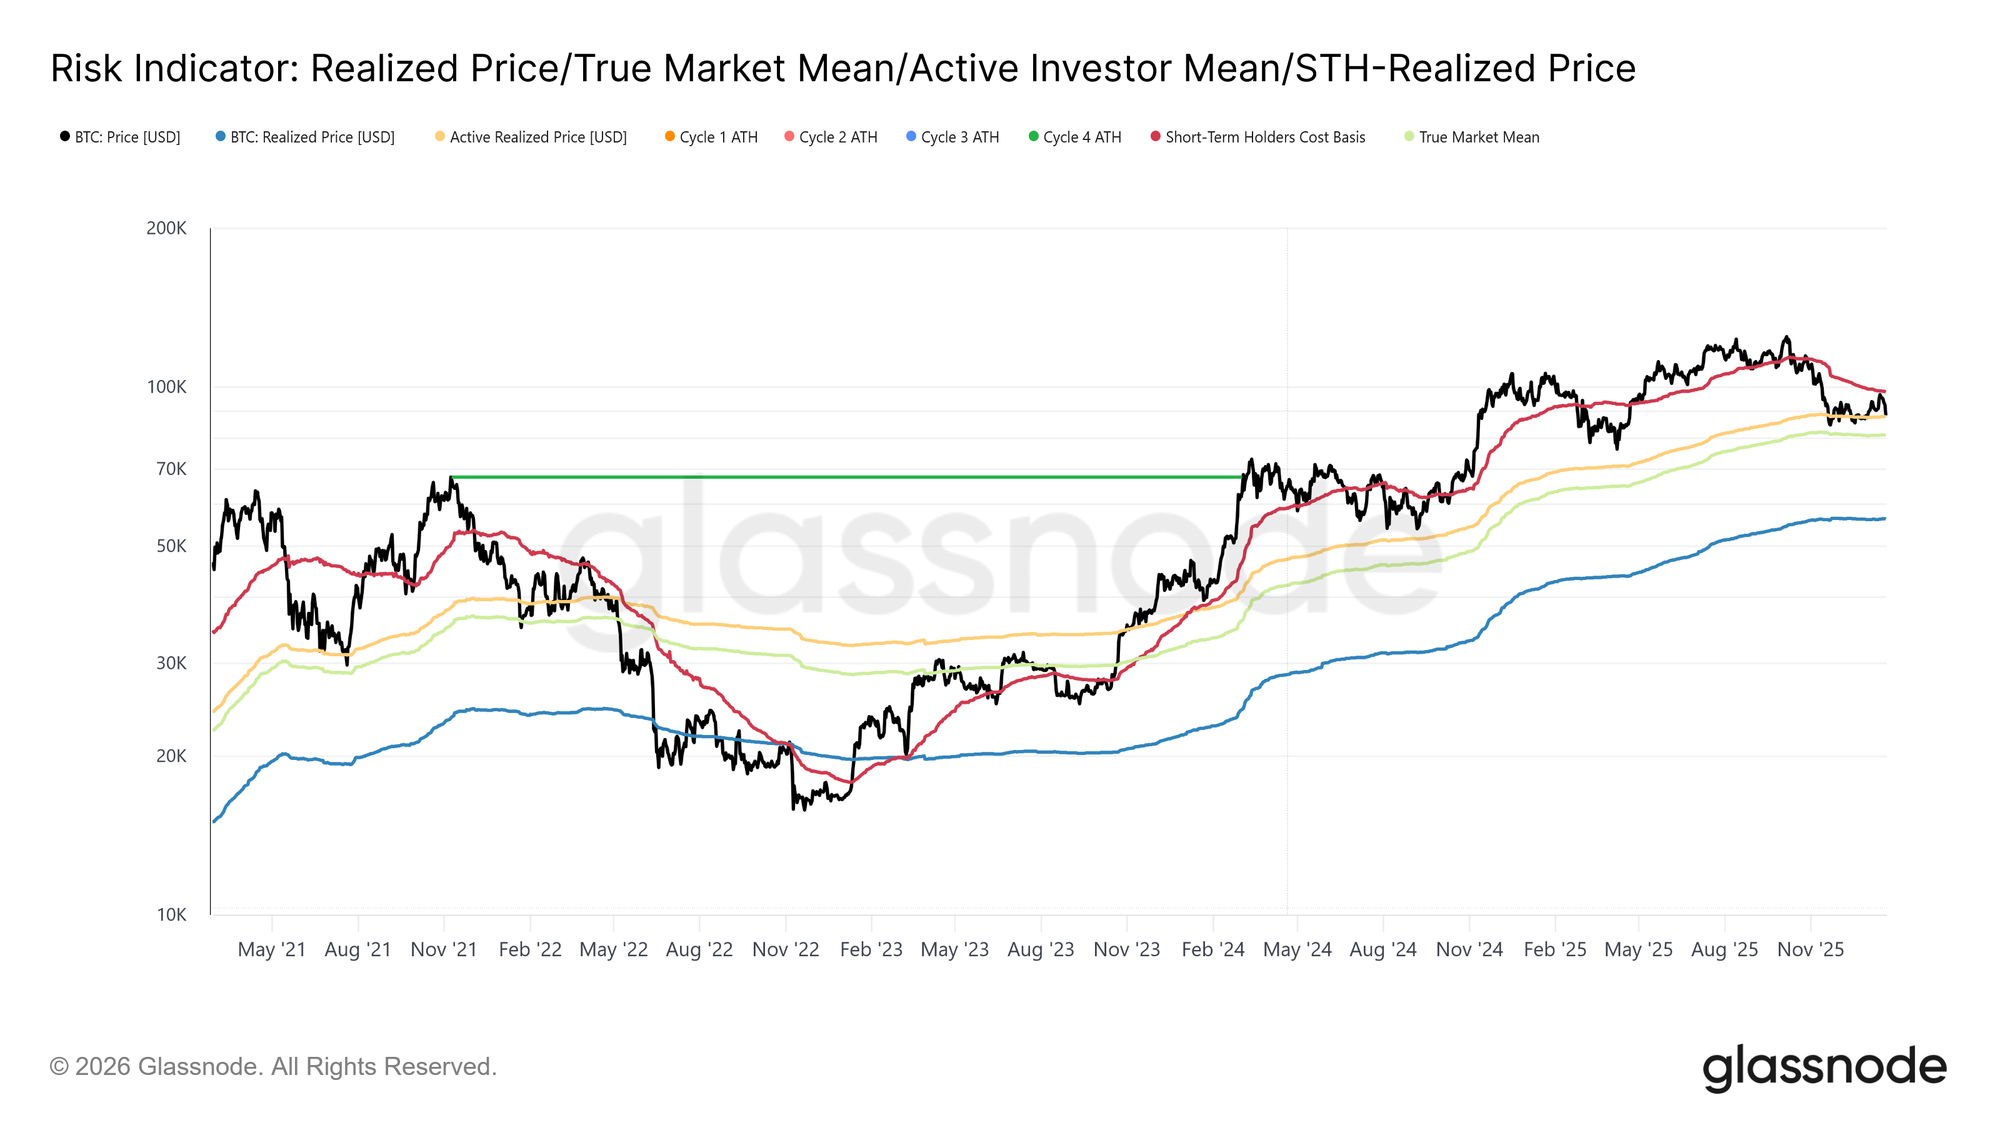
Reviewing recent weekly on-chain reports, a consistent narrative has emerged. The market has been operating within a moderate bear phase, bounded on the downside by the True Market Mean at $81.1k, and capped on the upside by the cost basis of short-term holders. This range defined a fragile equilibrium, where downside pressure was absorbed, but upside attempts repeatedly met distribution from investors who accumulated between Q1 and Q3 2025.
Entering early January 2026, signs of seller exhaustion opened the door for a rebound toward the upper bound of this range. However, this move carried elevated risk, as the price approached the ~$98k region, where breakeven supply from recent buyers became increasingly active.
The recent rejection near the Short-Term Holder cost basis at ~$98.4k mirrors the market structure observed in Q1 2022, where repeated failures to reclaim recent buyers’ cost basis prolonged consolidation. This similarity reinforces the fragility of the current recovery attempt.
Supply Overhang Persists
Building on this rejection at key breakeven levels, a closer inspection of on-chain supply distribution helps clarify why upside attempts continue to stall.
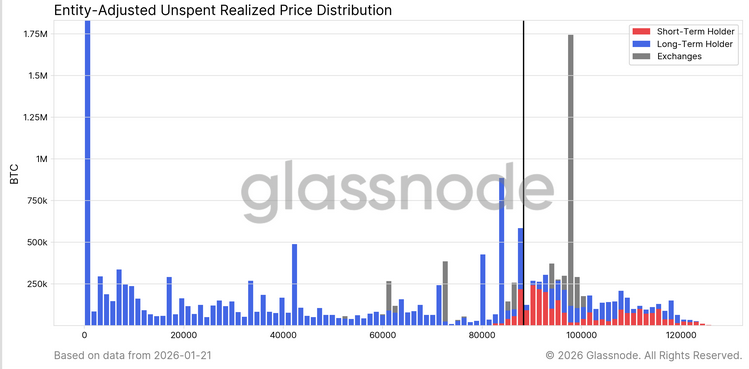
To add further colour to our assessment of why the overhang supply above ~$98k remains the dominant sell-side force capping short- to mid-term rebounds, the URPD chart offers a particularly effective lens. The recent rally has partially filled the prior air gap between ~$93k and $98k, driven by redistribution from top buyers into newer market participants, visible as emerging short-term holder supply clusters.
However, reassessing the distribution above $100k reveals a wide and dense supply zone that has been gradually maturing into the long-term holder cohort. This unresolved supply overhang remains a persistent source of sell pressure, likely to cap attempts above the $98.4k STH cost basis and the $100k level. A clean breakout would therefore require a meaningful and sustained acceleration in demand momentum.
Facing Maturing Sellers
Extending the supply-side analysis beyond short-term holders, long-term positioning reinforces the same structural constraint.
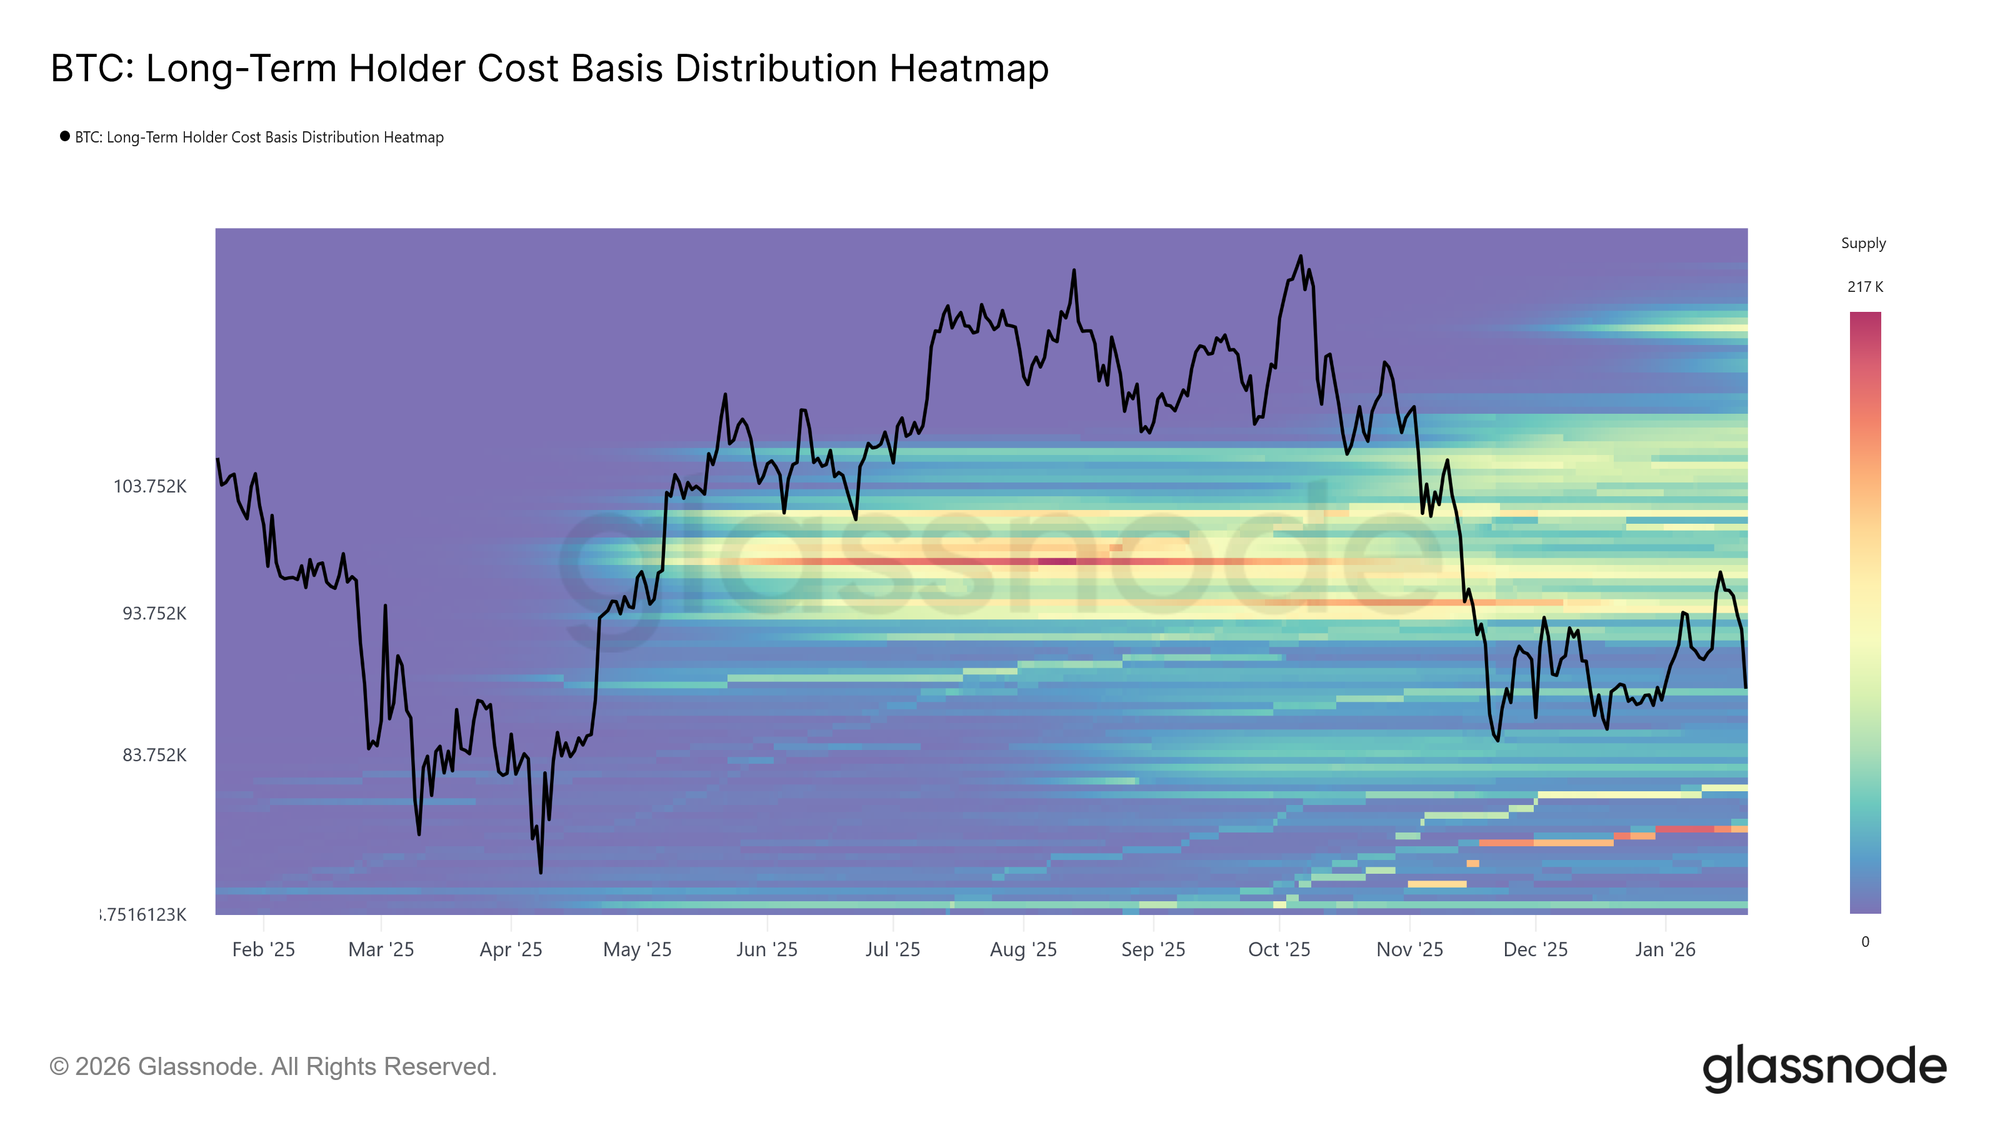
The Long-Term Holder Cost Basis Distribution Heatmap, which maps long-term holder supply by acquisition price, highlights a dense concentration of coins held above the current spot level. This cluster represents a substantial pool of potential sell-side liquidity, particularly in the short to mid term, as price approaches prior entry levels.
Until new demand emerges with sufficient strength to absorb this overhead supply, long-term holders remain a latent source of resistance. As a result, upside progress is likely to remain constrained, with rallies vulnerable to renewed distribution unless this supply overhang is decisively resolved.
Distribution into Relief Rally
Building further on the supply-side picture, we can isolate which investor cohorts have been most active in realizing value and, in turn, capping the recent advance toward the ~$98k region.
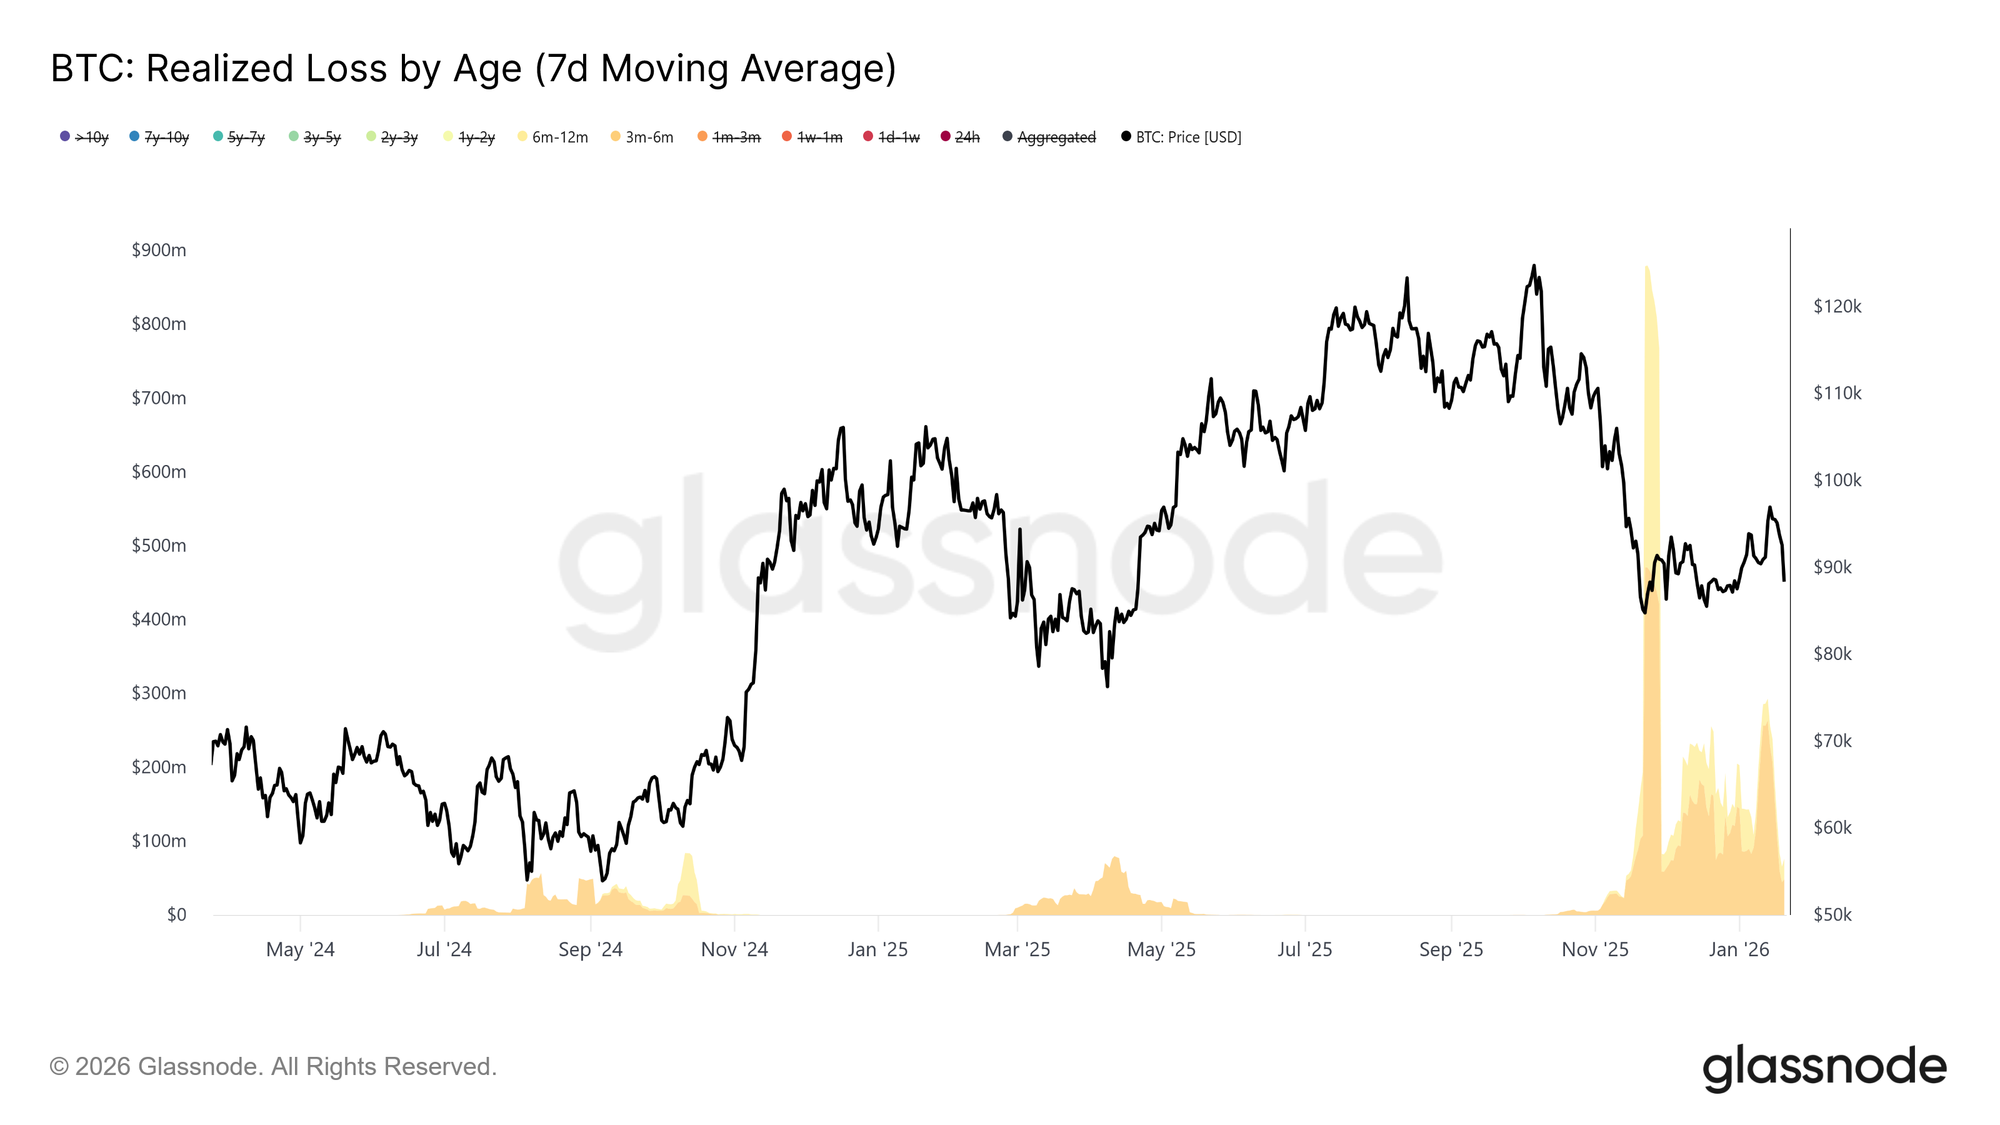
Turning to the Realized Loss by Age metric, loss realization has been dominated by the 3–6 month cohort, with a secondary contribution from 6–12 month holders. This pattern is characteristic of pain-driven behavior among top buyers, particularly investors who accumulated coins above $110k and are now exiting positions as price revisits their entry range. Such activity reinforces sell-side pressure near key recovery thresholds, as these cohorts seek to reduce exposure rather than re-engage with risk.
Complementing the loss-driven exits, profit-taking behavior further clarifies who is supplying liquidity into the recent strength.
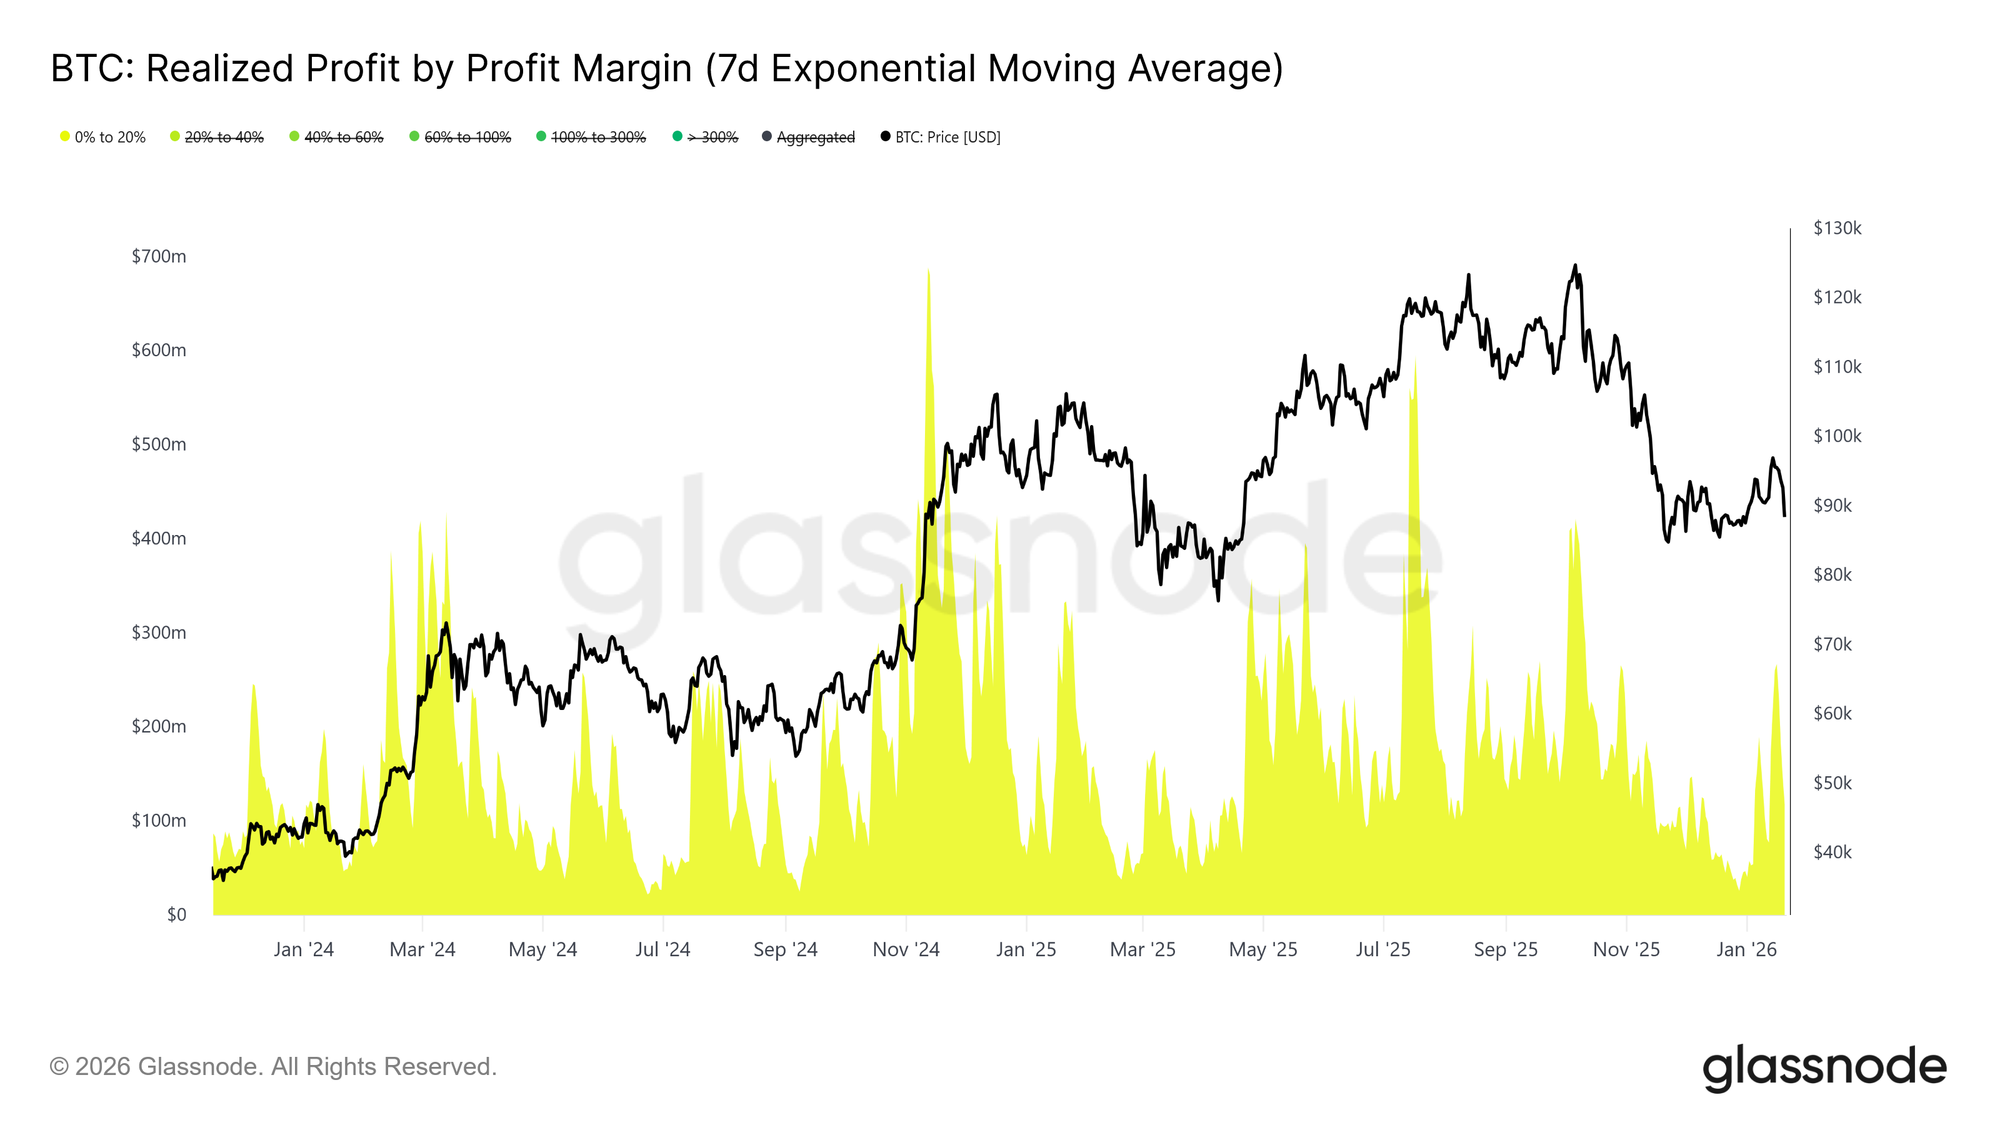
On the profit-realizing side, the Realized Profit by Profit Margin metric shows a notable increase in the share of profits captured by the 0% to 20% margin cohort. This shift highlights the influence of breakeven sellers and short-term swing traders, who are opting to exit positions with relatively thin gains rather than holding for trend continuation.
Such behaviour is typical in transitional markets, where conviction remains fragile, and participants prioritize capital preservation and tactical profits. This rising contribution from low-margin realizations has been actively limiting upside momentum as supply is released at nearby cost-basis levels.
Off-chain Insight
Spot Flows Turn Constructive
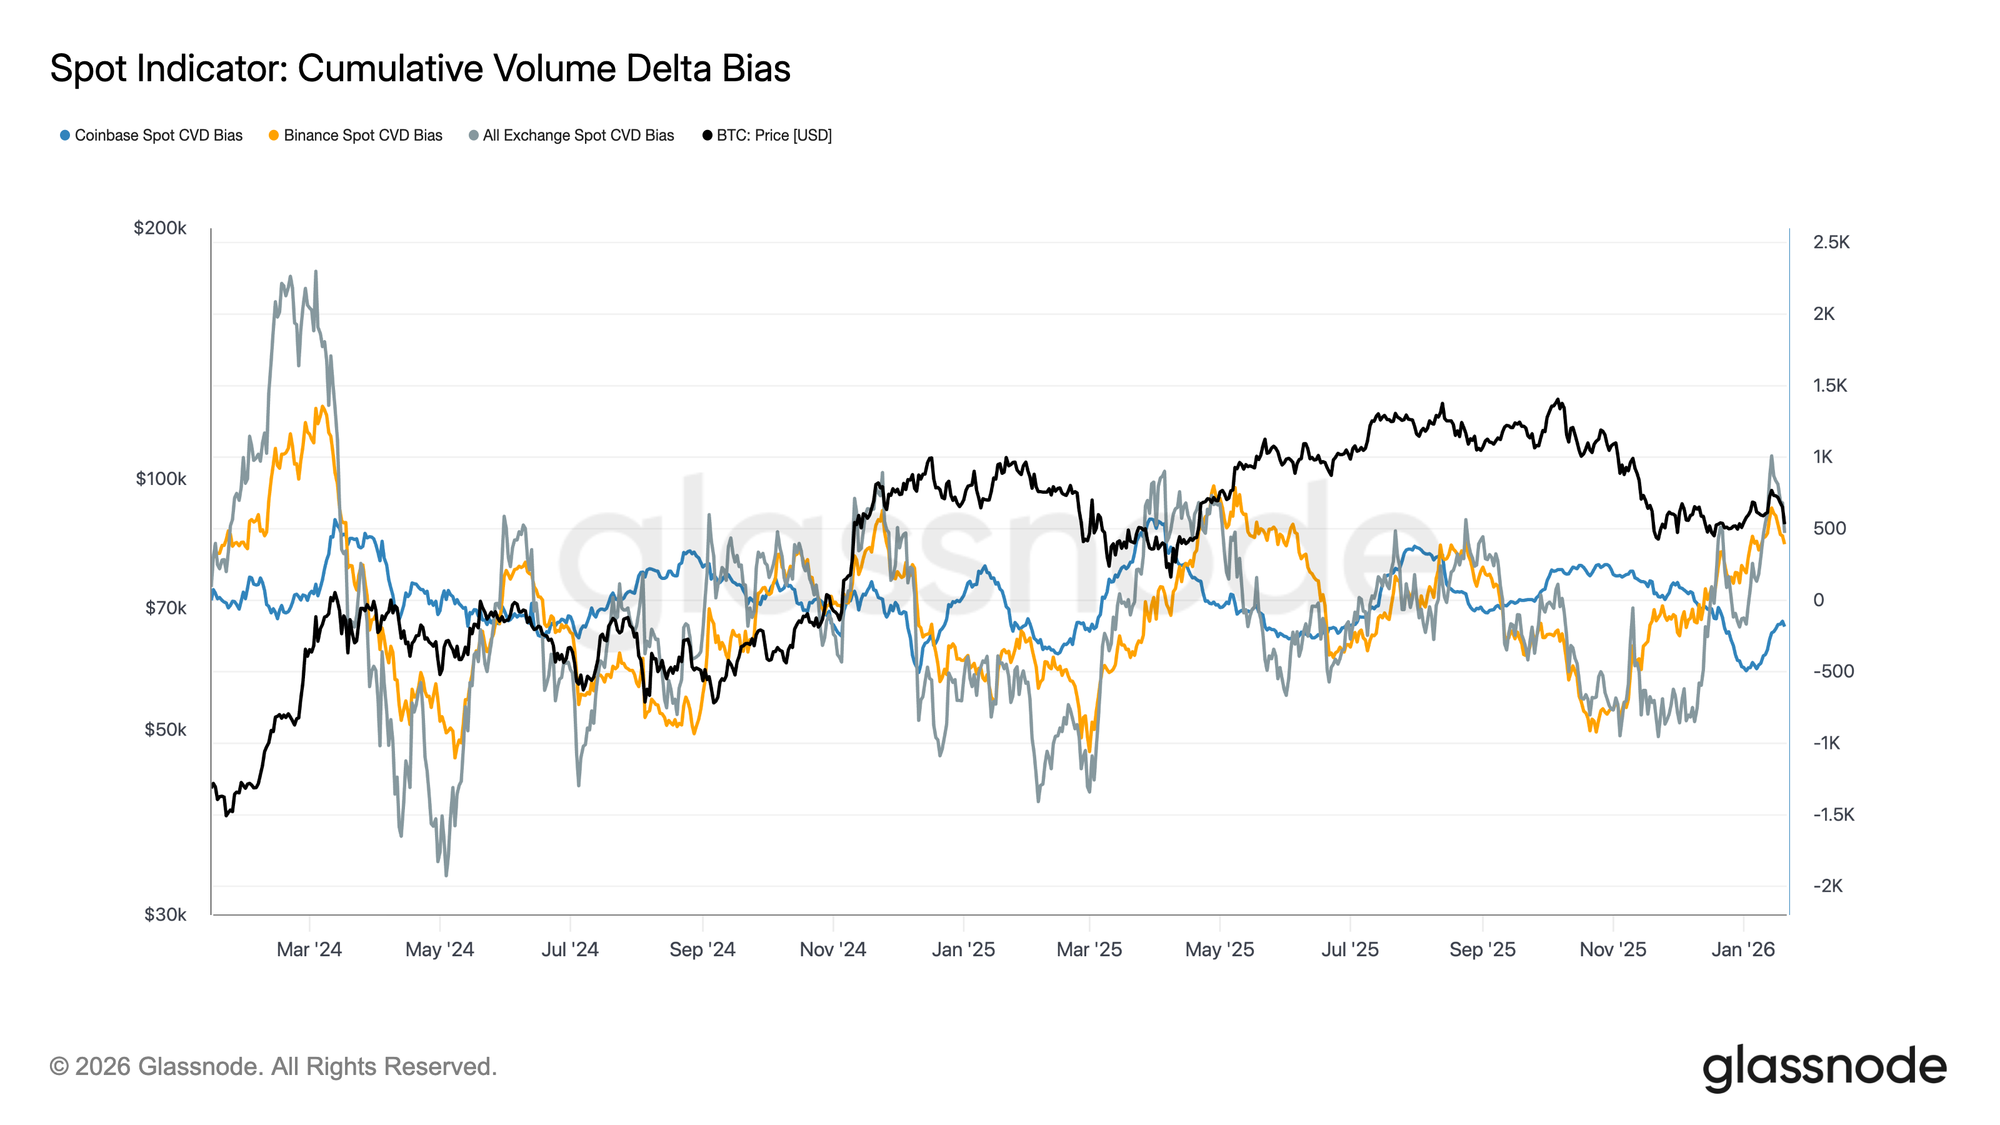
Spot market behaviour has begun to improve following the recent drawdown, with Binance and aggregate exchange CVD measures rotating back toward a buy-dominant regime. This marks a shift away from the persistent sell-side pressure that defined the prior consolidation, indicating that spot participants are once again absorbing supply rather than distributing into strength.
Coinbase, which had been a consistent source of sell-side aggression across much of the range-bound period, has also seen a meaningful slowdown in net selling. The moderation in Coinbase-led distribution has reduced overhead supply, helping to stabilise price action and support the recent recovery.
While spot participation has yet to exhibit the sustained, aggressive accumulation typically observed during full trend expansion phases, the transition back toward net buying across major venues represents a constructive improvement in underlying spot market structure.
Corporate Treasury Flows Remain Selective
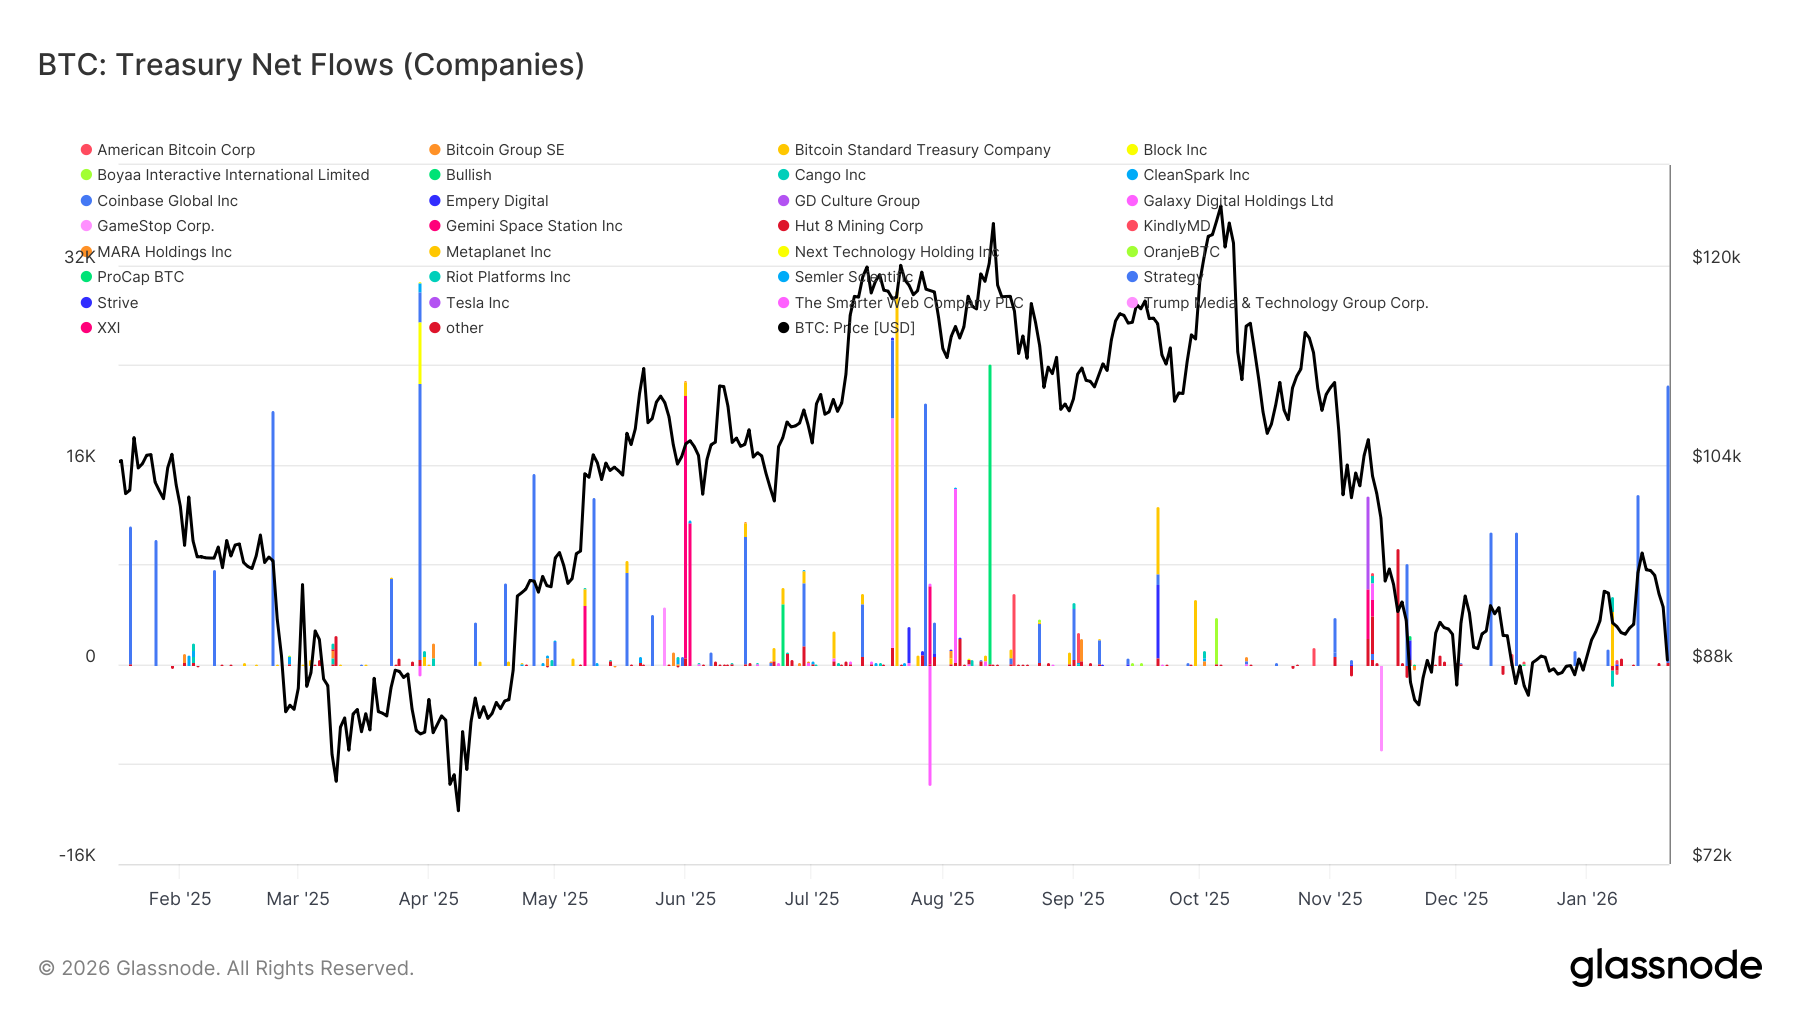
Recent corporate treasury net flows remain sporadic and uneven, with activity concentrated in isolated, event-driven transactions rather than broad-based accumulation. While several individual entities have posted notable inflow spikes over the past few weeks, aggregate corporate demand has not yet transitioned into a sustained accumulation regime.
On balance, flows have oscillated tightly around neutral, indicating that most corporate treasuries are currently inactive or operating opportunistically rather than scaling strategic exposure. This contrasts with earlier periods where coordinated inflows from multiple entities aligned more closely with trend acceleration.
Overall, the latest data suggests corporate treasuries are acting as a marginal, selective source of demand, contributing episodically but not yet exerting a decisive influence on broader price dynamics.
Derivatives Activity Remains Thin
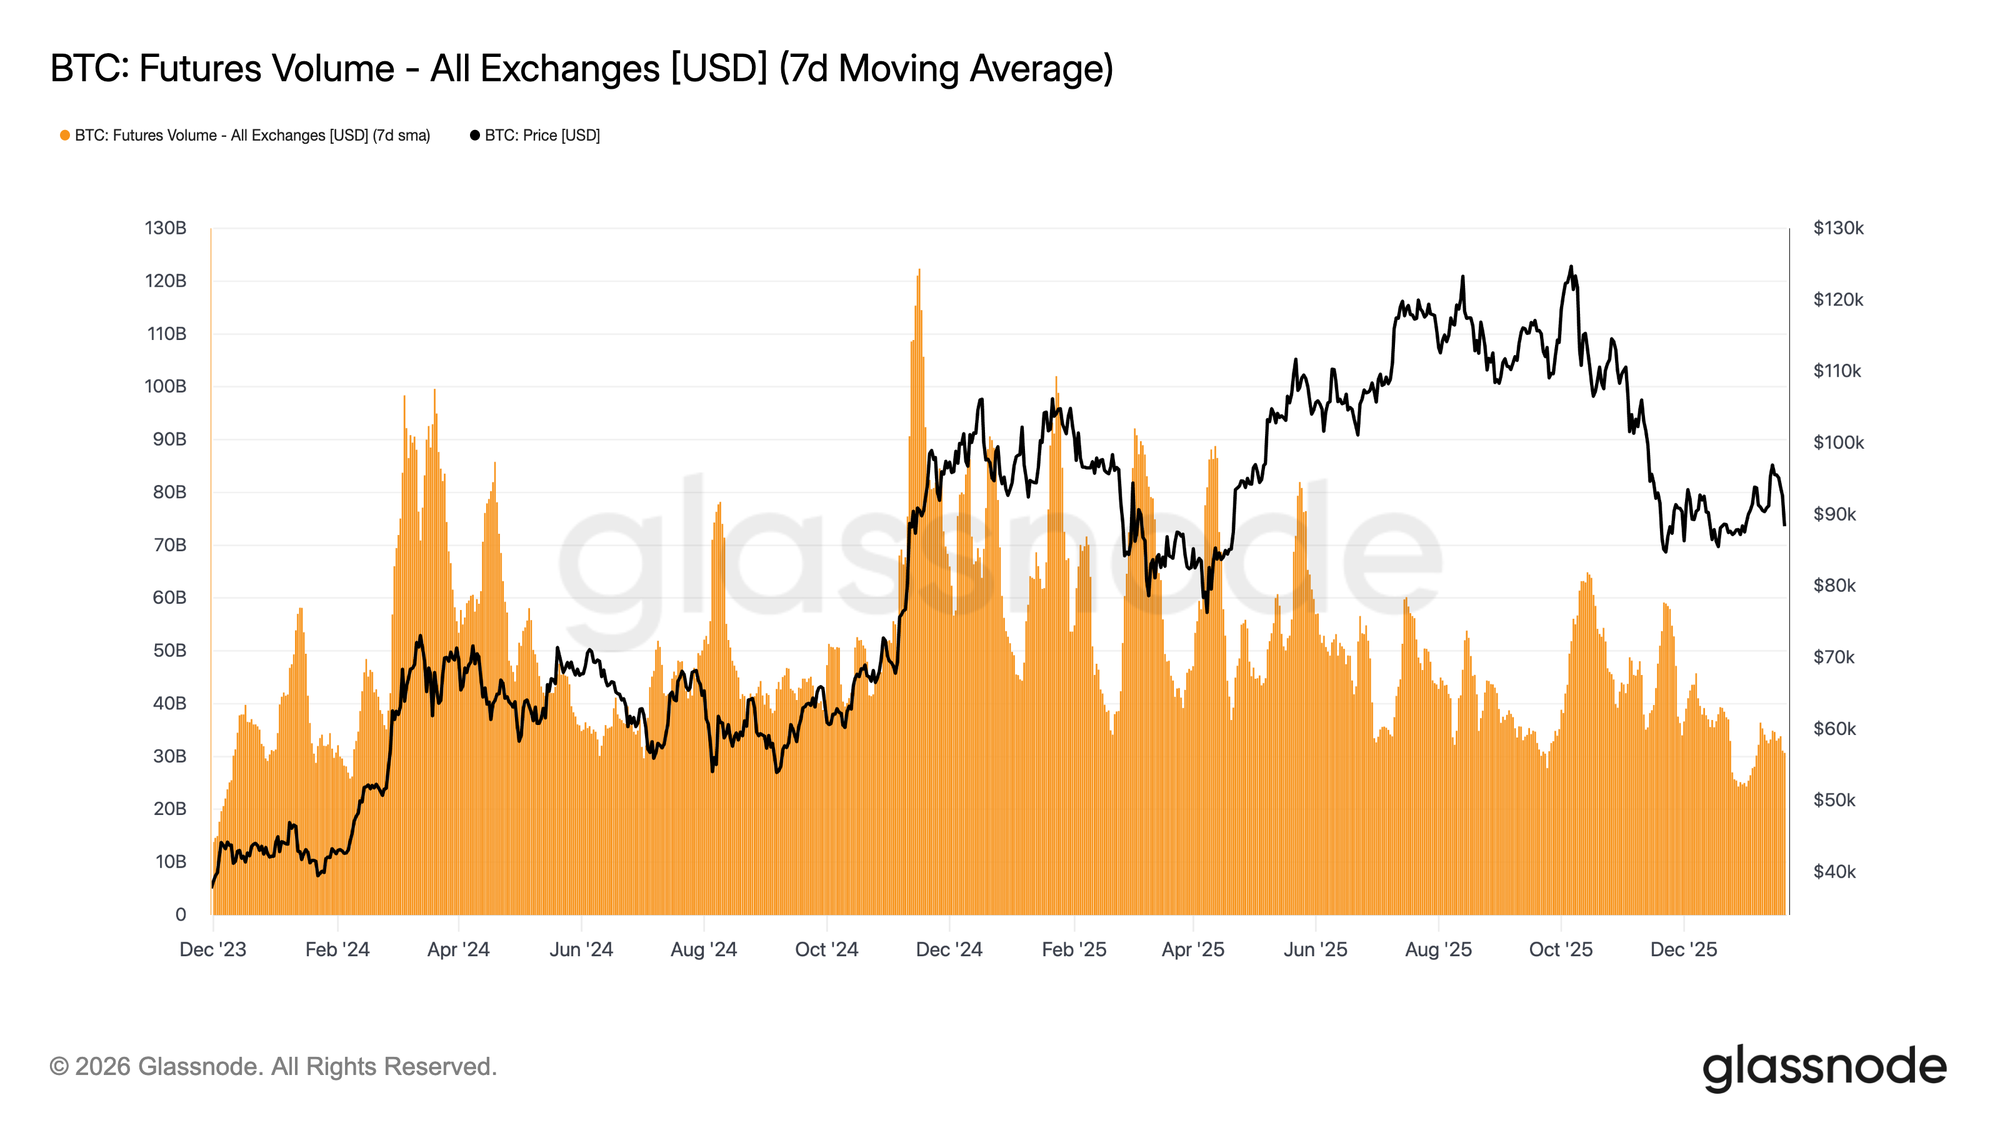
BTC futures trading volume continues to contract on a 7-day moving average basis, with activity remaining well below levels typically associated with sustained trend formation. Recent price movements have occurred in the absence of meaningful volume expansion, highlighting a derivatives market characterised by low participation and limited conviction.
The current structure suggests that much of the recent price action has been driven by thin liquidity rather than aggressive positioning. Open interest adjustments have occurred without a corresponding increase in traded volume, pointing to positioning churn and risk recycling rather than fresh leverage deployment.
Overall, derivatives markets currently resemble a low-engagement environment, with speculative interest muted and participation sparse. This “ghost town” profile implies a market that is highly sensitive to any resurgence in volume, but for now remains reactive rather than having a major influence on price discovery.
Implied Volatility Reacts Only in the Front End
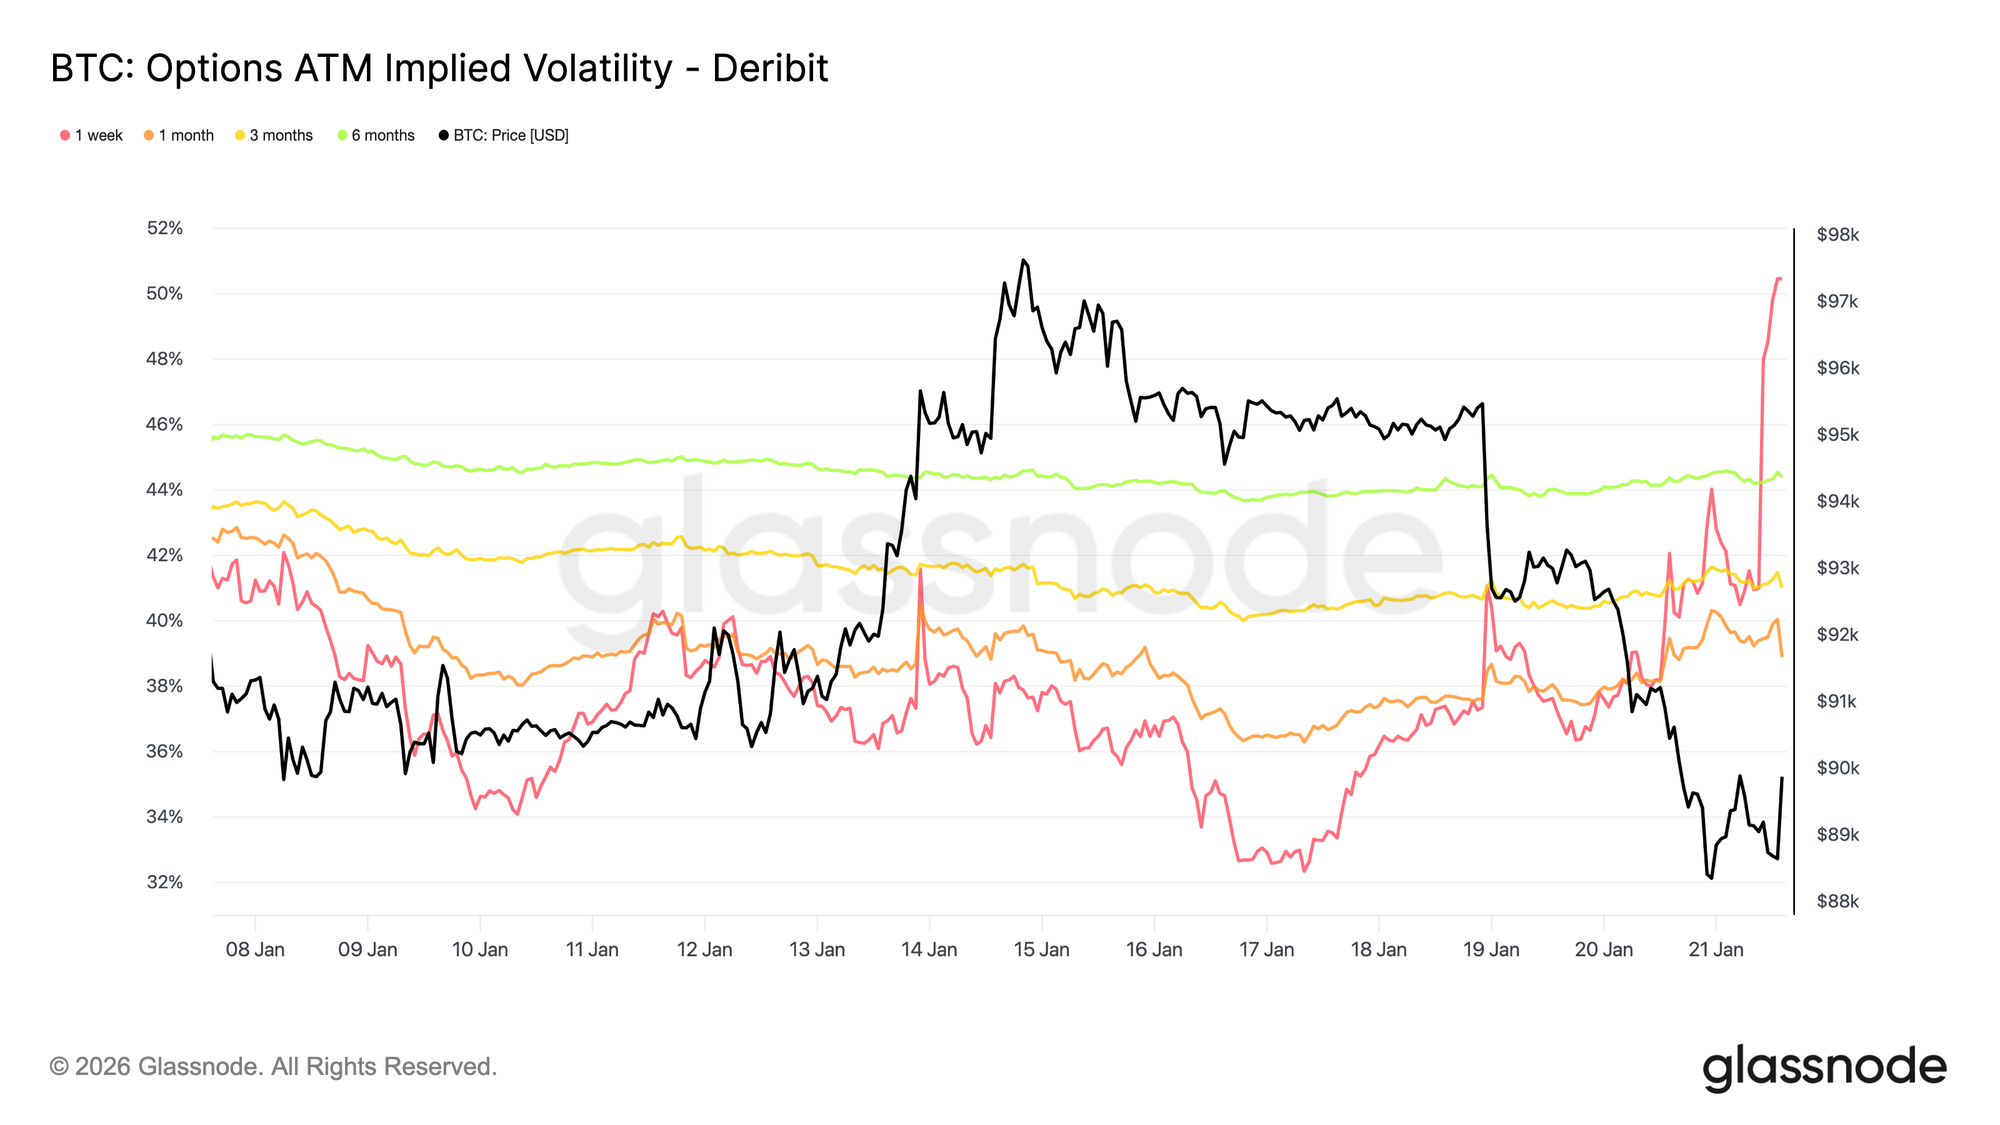
The spot sell-off driven by macro and geopolitical headlines has only triggered a reaction in short-term volatility. One-week implied volatility has risen by more than 13 volatility points since Sunday’s sell-off, while three-month implied volatility is up around 2 points and six-month implied volatility has barely moved.
This sharp steepening at the very front of the volatility curve shows that traders are reacting tactically rather than reassessing medium-term risk. When only short-dated implied volatility adjusts, it reflects event-driven uncertainty rather than a broader volatility regime shift.
The market is pricing short-lived risk, not a lasting disruption.
Short Dated Skew Fluctuates Aggressively
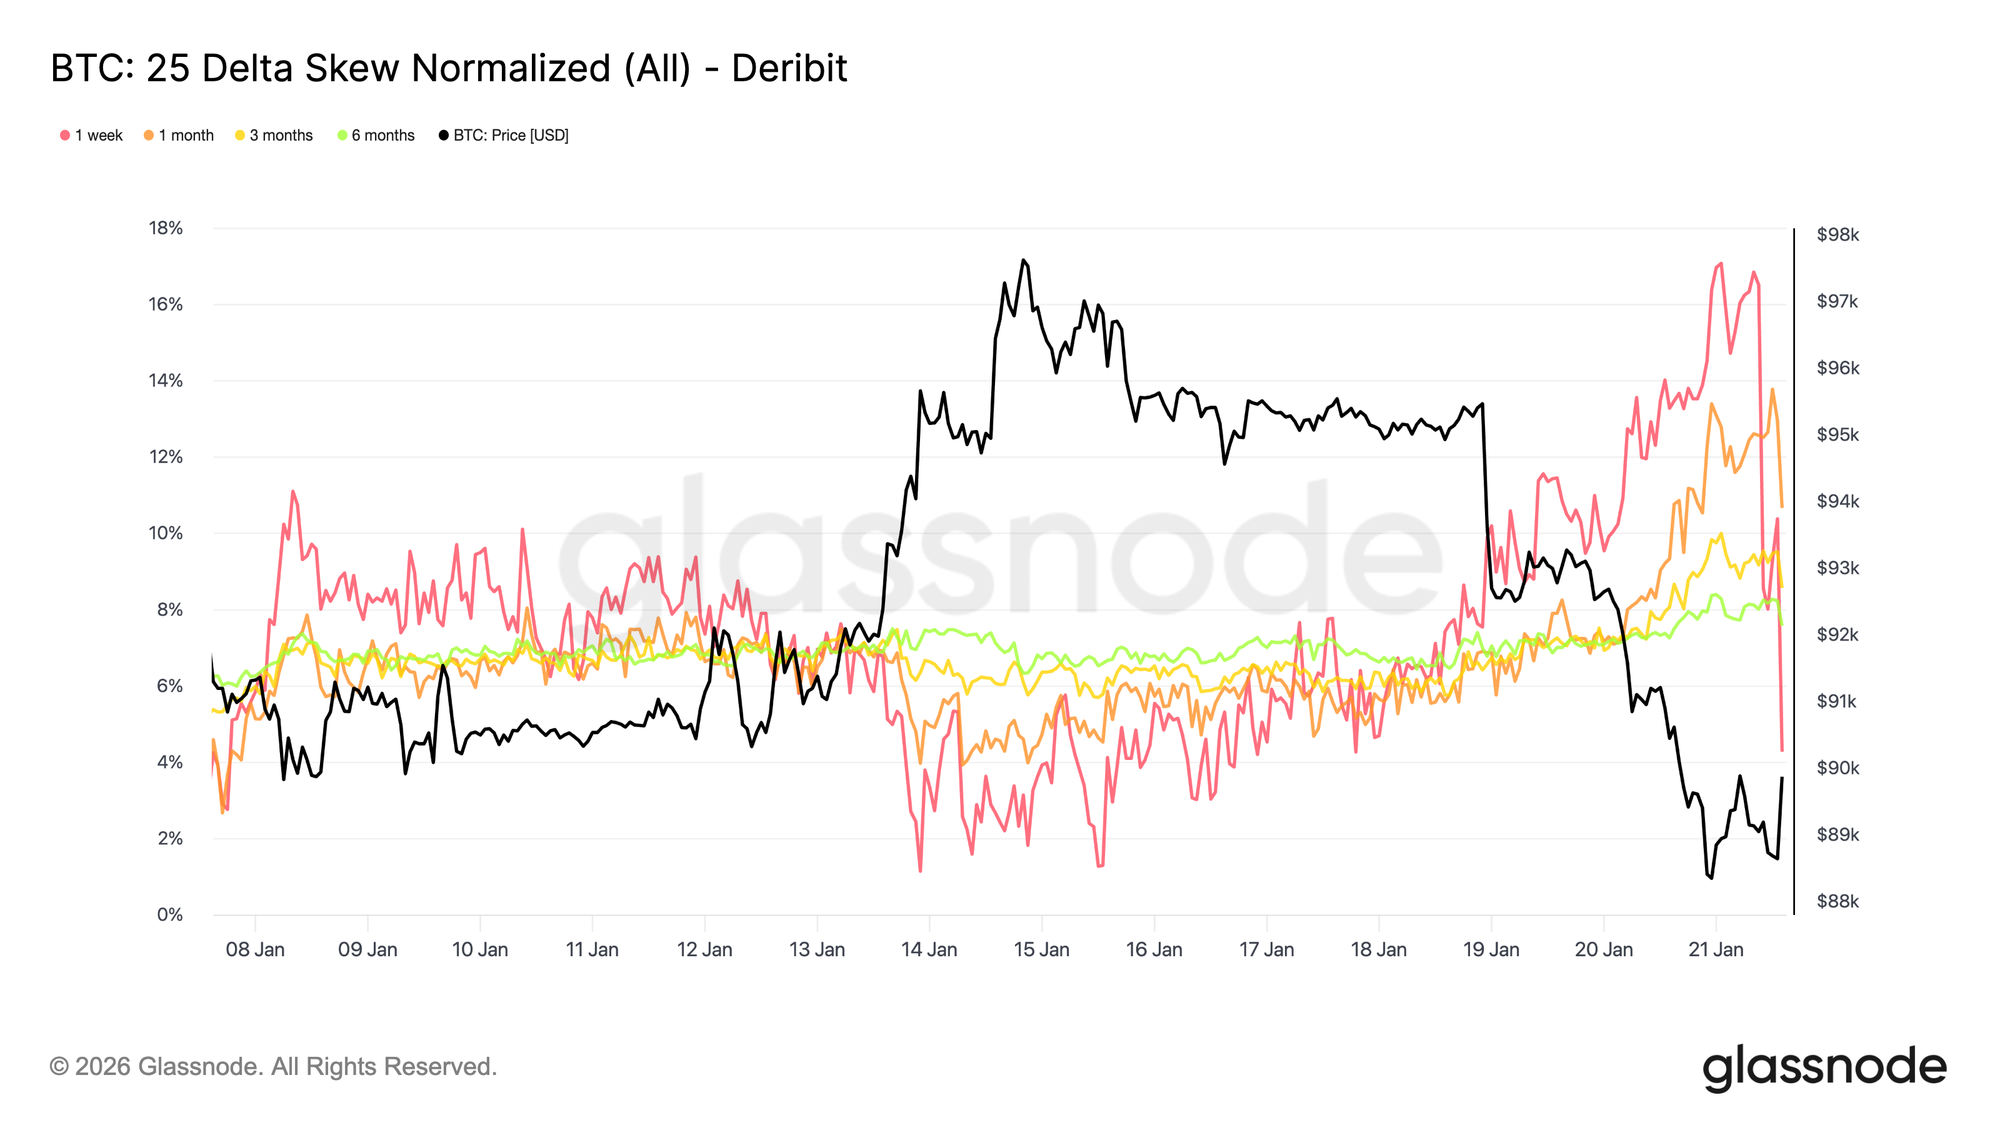
Just like ATM implied volatility, short dated skew has led the adjustment, with the one week 25 delta skew shifting sharply toward put richness after sitting close to equilibrium a week ago.
Since last week, one week 25 delta skew has moved roughly 16 volatility points toward puts, reaching close to 17 percent put richness. One month skew has reacted as well, while longer dated maturities remain firmly in put territory, only marginally leaning further toward downside.
When skew tilts this aggressively, it often coincides with local extremes, where positioning becomes crowded and the market struggles to extend in the same direction. Following the Trump discourse at Davos, downside richness has been faded and monetized, and skew has started to revert, almost as quickly as it moved higher.
Volatility Risk Premium Remains Elevated
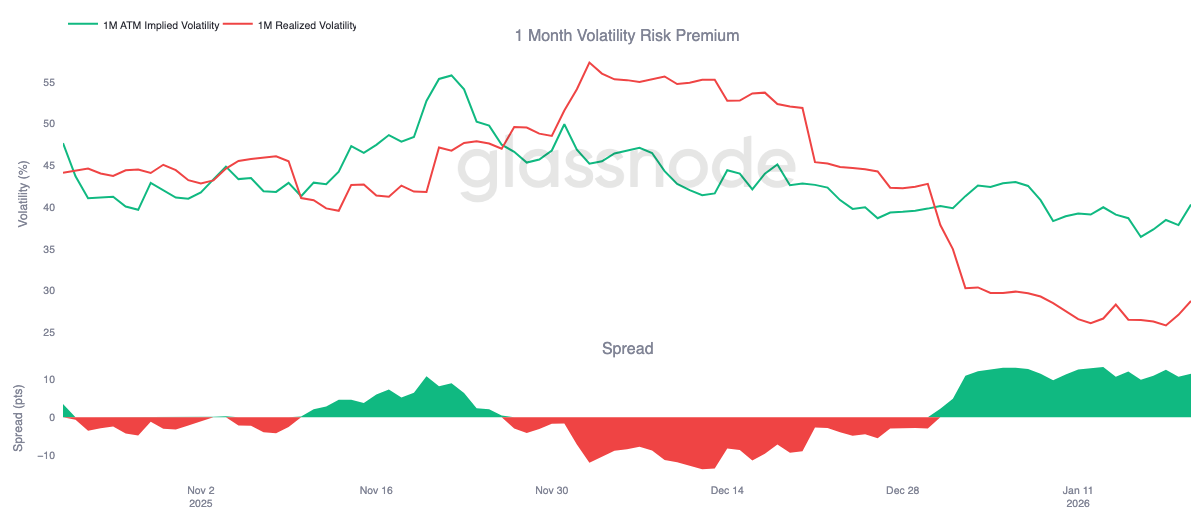
One-month volatility risk premium remains positive, as it has been since the beginning of the year. Even though implied volatility is historically low in absolute terms, it continues to price above realized volatility. In other words, options are still expensive relative to the actual price movement that has materialized.
Volatility risk premium captures the gap between implied and realized volatility. A positive premium means option sellers are being compensated for taking volatility risk. This creates a favorable carry environment for short volatility strategies, where holding short gamma positions generates income as long as realized moves stay contained.
This dynamic reinforces volatility compression. As long as selling volatility remains profitable, more participants are willing to engage, keeping implied volatility anchored. As of January 20, the one-month volatility spread stood around 11.5 volatility points in favor of sellers, highlighting how supportive current conditions remain for volatility selling behavior.
Dealer Gamma Positioning Skews Lower
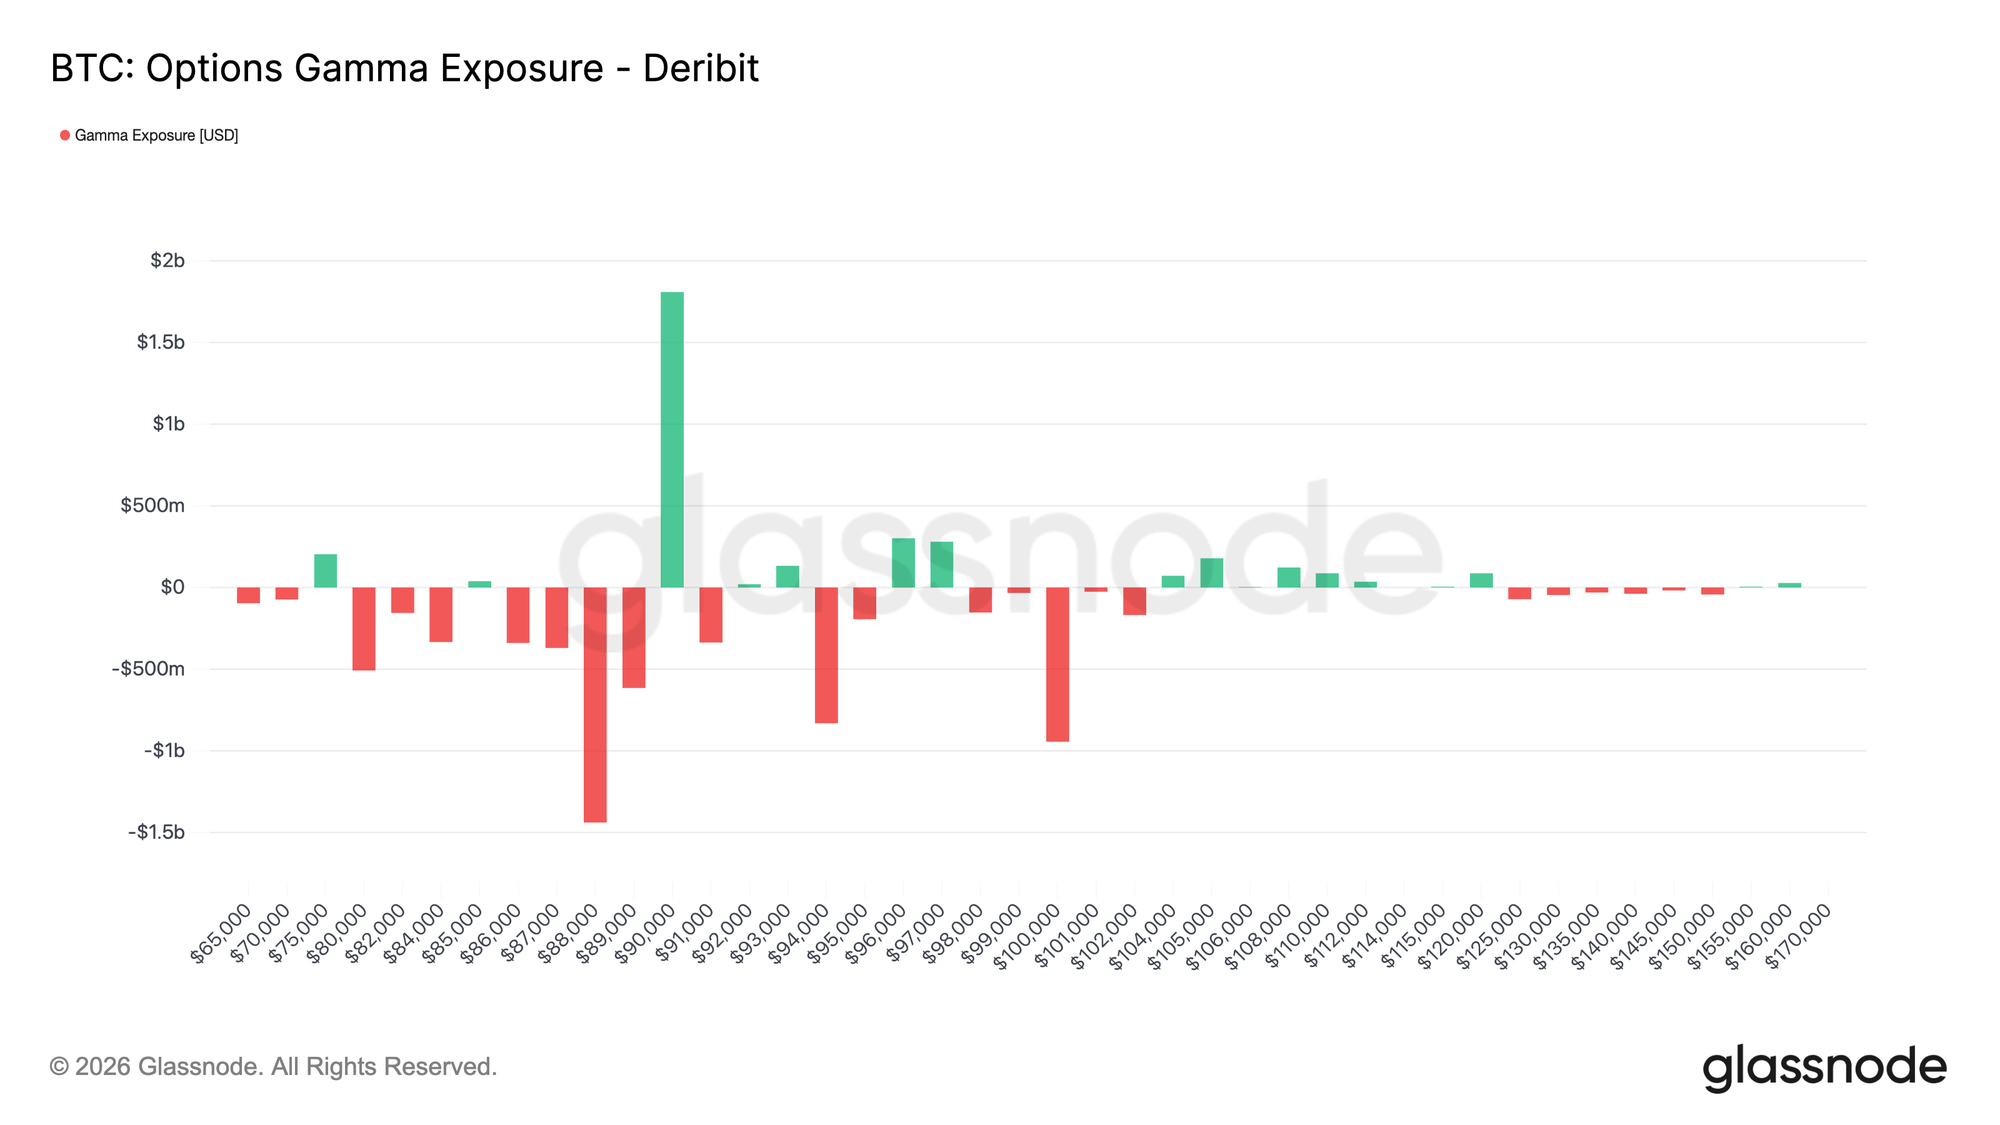
Dealer gamma positioning helps frame the structural forces shaping short term price behavior. Recent flow shows takers actively bidding for downside protection, pushing dealers short gamma below the 90k level. At the same time, some takers have financed this protection by selling upside, leaving dealers long gamma above this key 90k strike.
This creates an asymmetric setup. Below 90k, dealers being short gamma means downside moves can accelerate as hedges are adjusted through selling futures or spot. Above 90k, dealer long gamma introduces a stabilizing force, as rallies tend to be met with hedging flows that dampen follow through.
As a result, price action remains fragile below 90k, while that level itself is likely to act as a friction point. Reclaiming it sustainably would require sufficient momentum and confidence to absorb dealer hedging flows and shift gamma exposure higher.
Conclusion
Bitcoin remains in a low participation regime, with price action driven more by the absence of pressure than by active conviction. On-chain data continues to reflect supply overhang and fragile structural support, while spot flows, though improving, have yet to transition into sustained accumulation.
Institutional and corporate demand remains cautious, with treasury flows stabilising near neutral and activity concentrated in isolated transactions. Derivatives participation remains thin, with futures volume compressed and leverage deployment subdued, reinforcing a low-liquidity environment where price is increasingly sensitive to modest positioning shifts.
Options markets echo this restraint. Volatility repricing has been confined to the front end, hedging demand has normalised, and elevated volatility risk premium continues to anchor implied volatility.
Overall, the market appears to be quietly building a base, consolidating not from excess participation, but from a pause in conviction as investors wait for the next catalyst to unlock broader engagement.
Disclaimer: This report does not provide any investment advice. All data is provided for informational and educational purposes only. No investment decision shall be based on the information provided here, and you are solely responsible for your own investment decisions.
Exchange balances presented are derived from Glassnode’s comprehensive database of address labels, which are amassed through both officially published exchange information and proprietary clustering algorithms. While we strive to ensure the utmost accuracy in representing exchange balances, it is important to note that these figures might not always encapsulate the entirety of an exchange’s reserves, particularly when exchanges refrain from disclosing their official addresses. We urge users to exercise caution and discretion when utilizing these metrics. Glassnode shall not be held responsible for any discrepancies or potential inaccuracies.
Please read our Transparency Notice when using exchange data.







