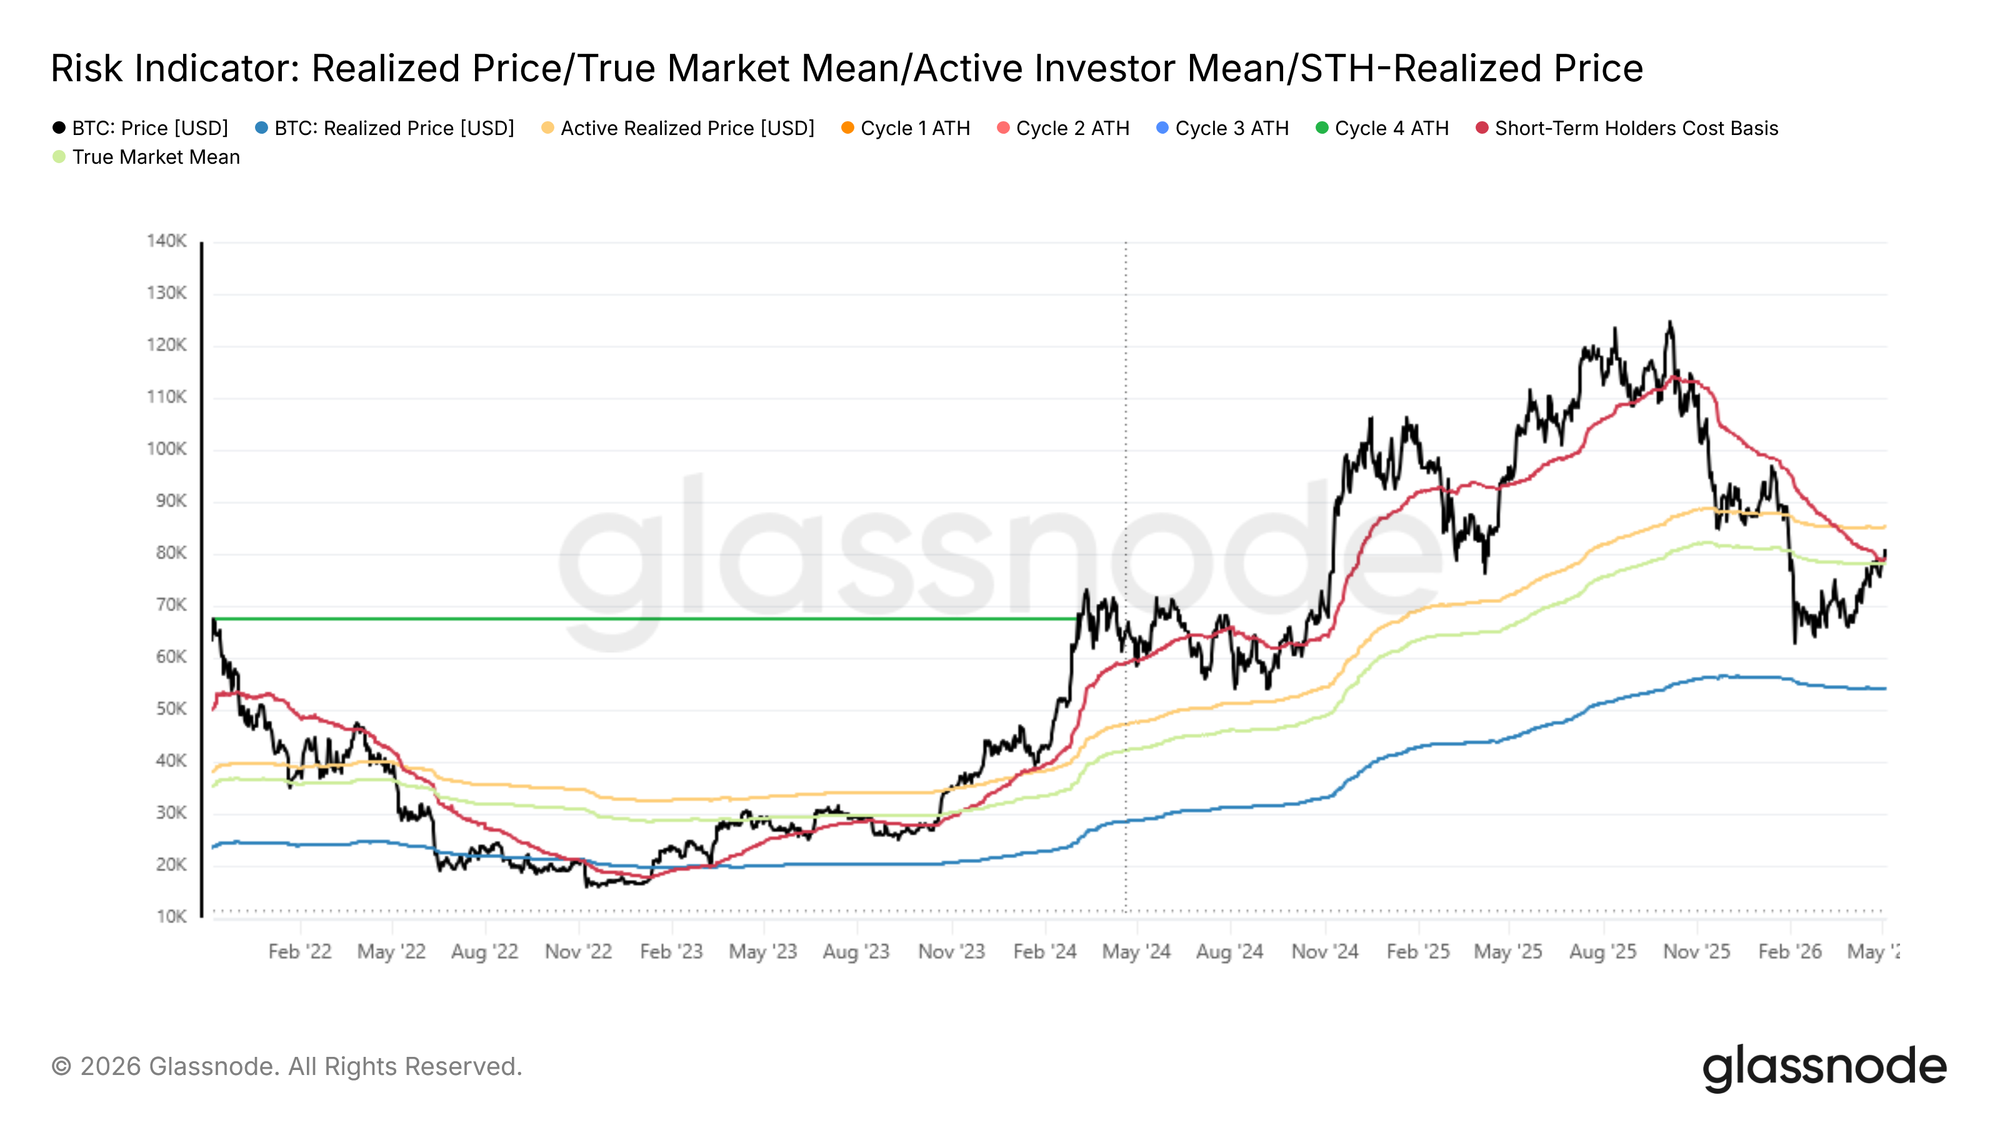
Last week, this report flagged rejection at the True Market Mean and Short-Term Holder Cost Basis as confirmation of near-term overhead resistance, while identifying the dense accumulation cluster between $65k and $70k as a foundation capable of supporting a recovery toward the $84k supply zone. That recovery has now materialized: Bitcoin has pushed to $81k, breaking above both the True Market Mean at $78.2k and the Short-Term Holder Cost Basis at $79.1k, clearing the average acquisition price of all actively transacted supply and recent buyers over the past 155 days in a single leg higher.
Should price sustain above these two levels in the coming week, the deep value regime that persisted from early February 2026 through now would rank among the shortest episodes of its kind in Bitcoin market history. Attention now shifts to the next major resistance at the Active Realized Price near $85.2k, which tracks the cost basis of all non-dormant supply and represents the next structural threshold the market must reckon with.
Profitability Flips Positive
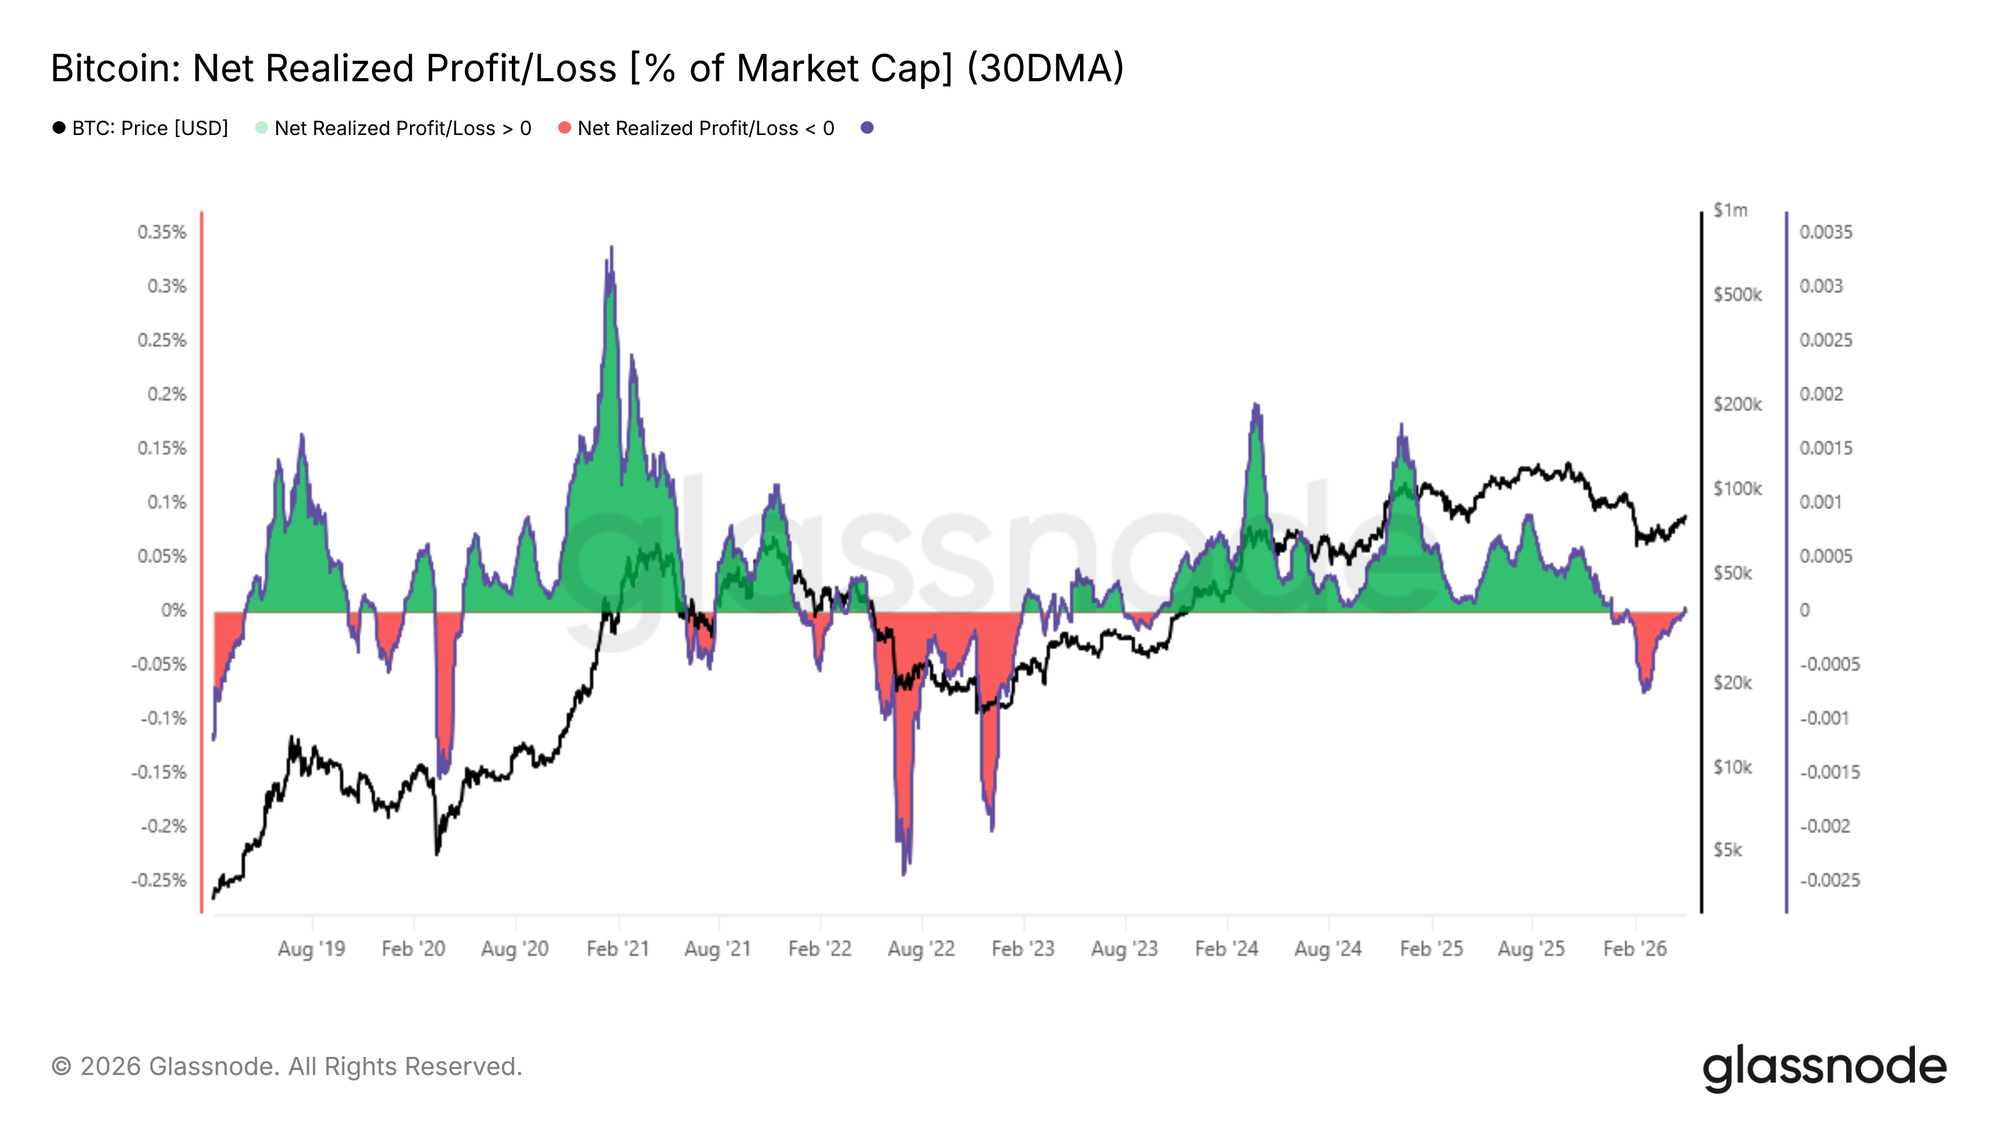
Building on the breakout above the True Market Mean, the improved price structure is now registering across profitability metrics. The 30-day SMA of Net Realized Profit and Loss, which measures the difference between profits and losses realized on-chain normalized by market capitalization, has flipped positive and now stands at 0.003% of market cap.
This indicator serves as a broad gauge of whether spending investors are collectively exiting at a gain or a loss, and a return to positive territory is a constructive signal following a sustained period of loss dominance. At its trough in mid-February, this metric reached -0.027% of market cap, a meaningfully negative reading but one that remained comparatively shallow relative to the extreme loss-realizing regimes observed during the 2022 to 2023 bear market. This limited depth of negativity, in retrospect, is consistent with the historically brief duration of the recent deep value episode highlighted in the prior section.
Long-Term Holders Begin to Stir
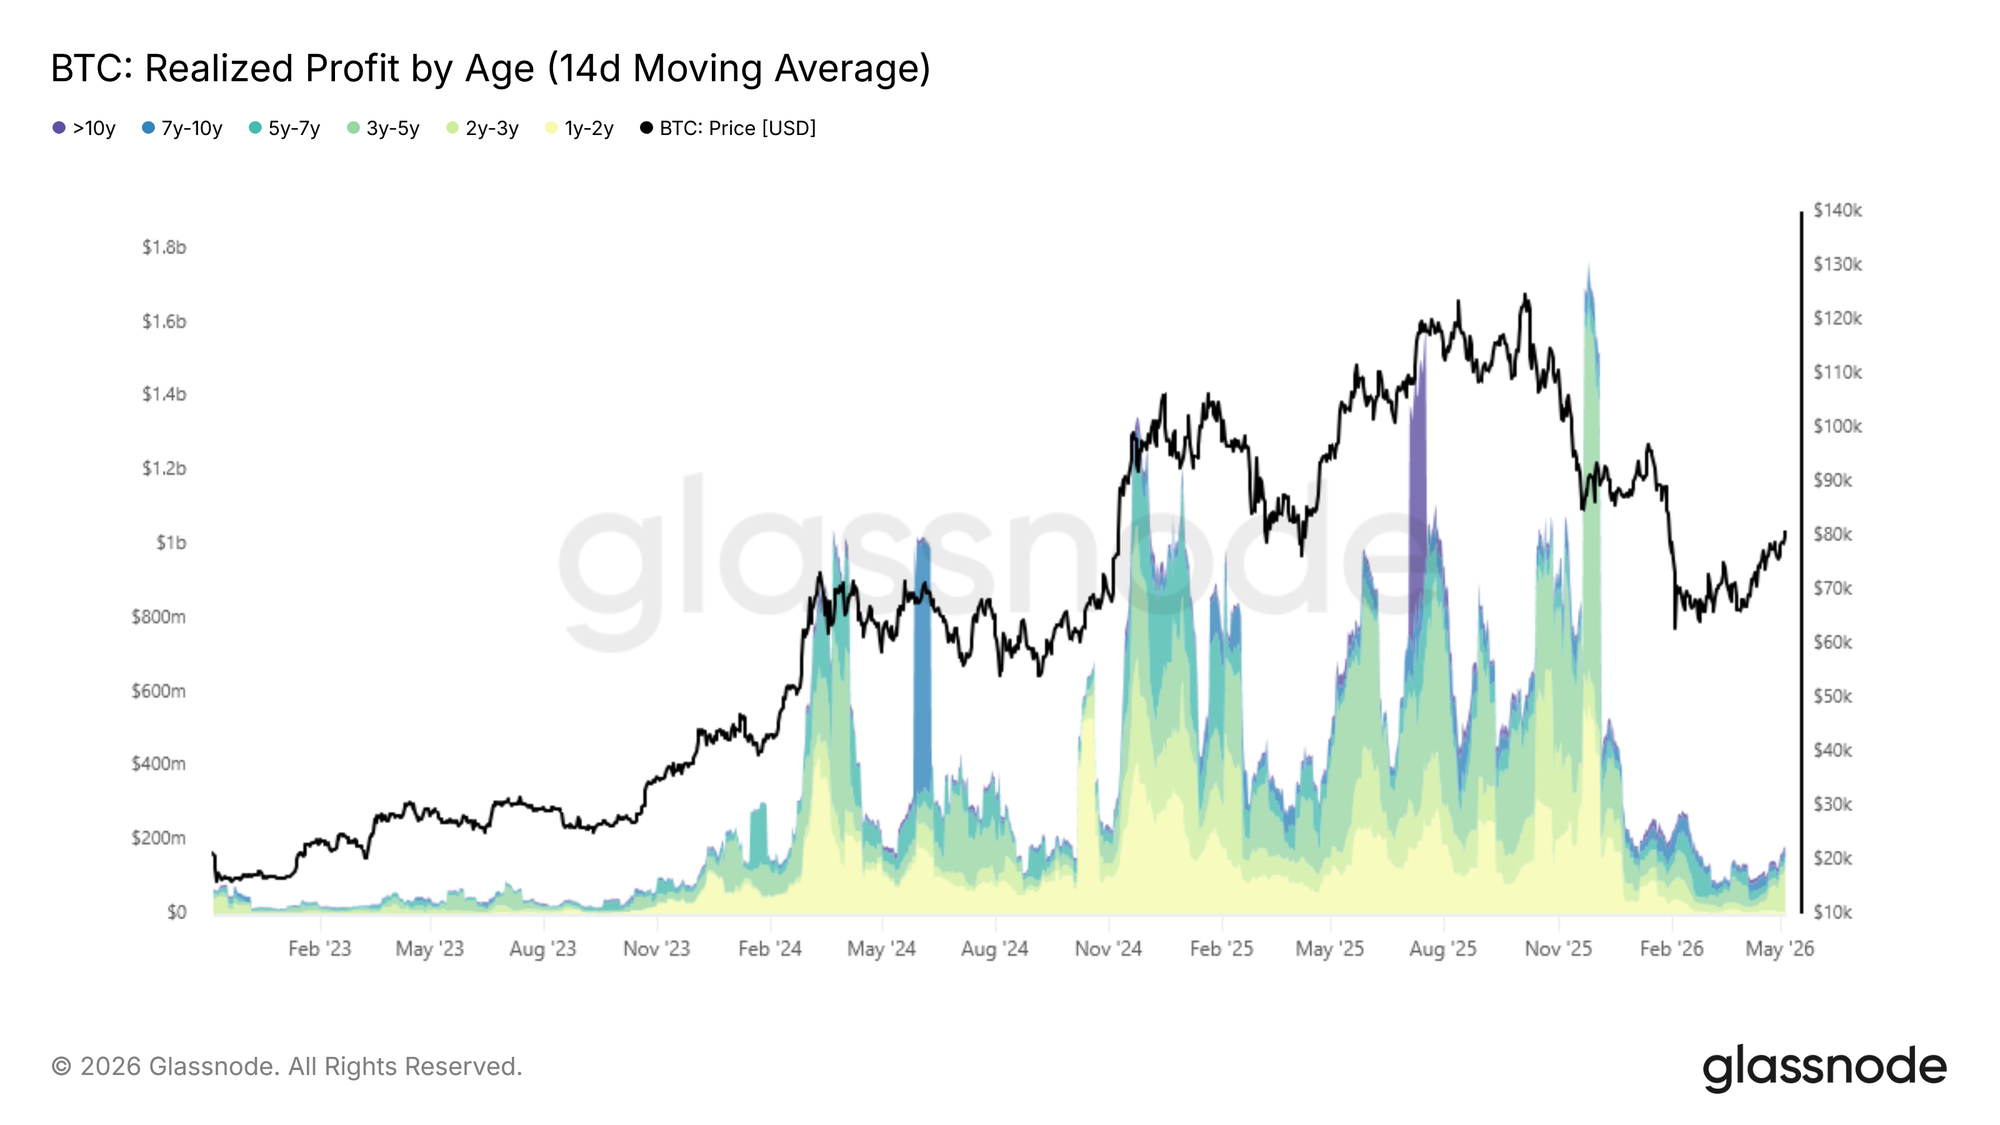
With net realized profit flipping positive, the critical question shifts to whether buy-side liquidity can sustain momentum against the rising tide of long-term holder distribution. The 14-day SMA of Realized Profit by holders with supply older than one year has climbed to approximately $180M per day following the recent rally, a level comparable to September 2024 and December 2022.
This cohort, having weathered the entirety of the recent bear phase, now faces a growing incentive to realize gains as price recovers toward more favorable levels. Should the current expansion continue, this distribution pressure is likely to intensify. Importantly, the indicator has not yet approached the heated readings above $1B per day seen during peak cycle conditions earlier in this cycle, suggesting long-term holder selling remains measured rather than aggressive at this stage. The market's ability to absorb this gradual increase in supply while sustaining price above the True Market Mean will be the defining test of whether the current recovery has genuine structural legs.
Loss Realization Still Elevated
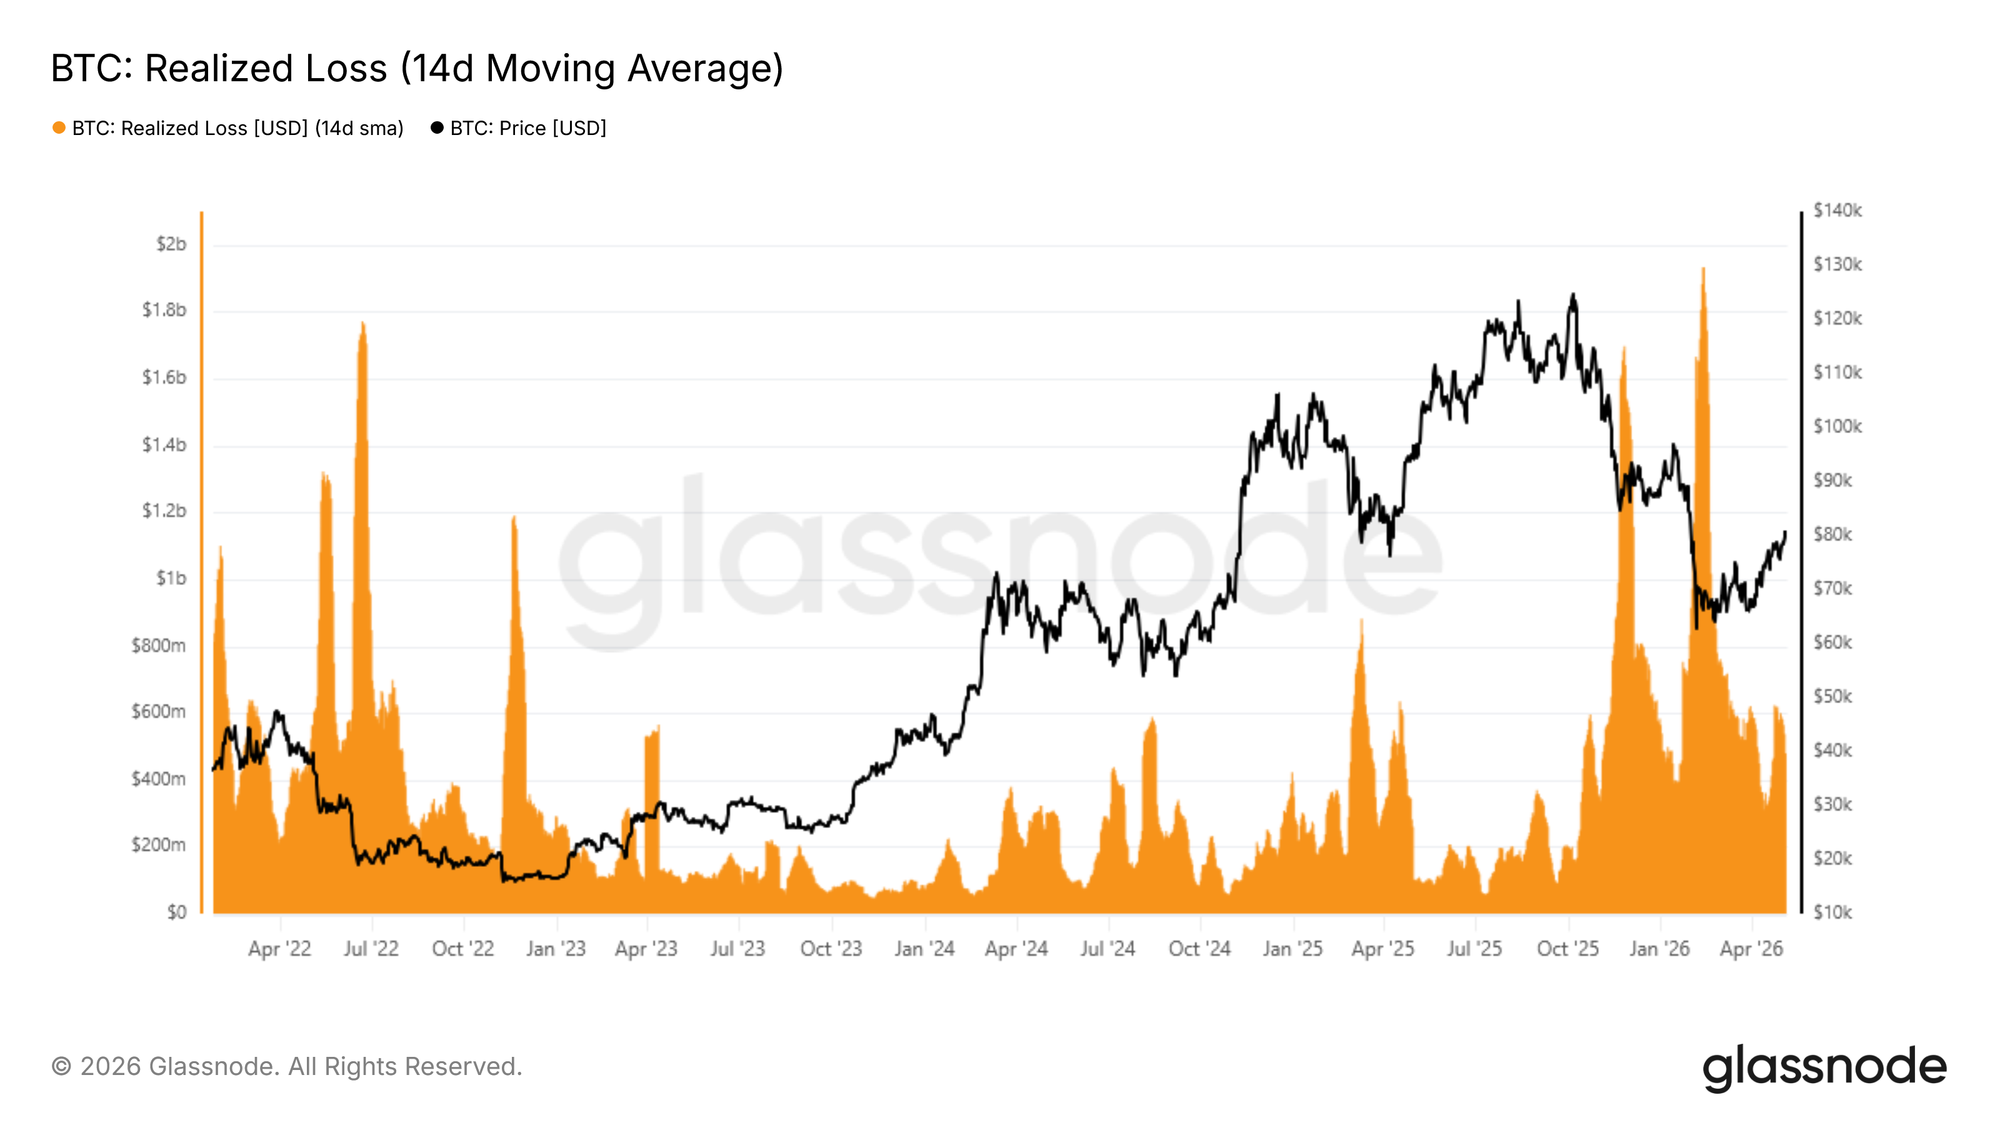
While long-term holder profit taking remains below levels of concern at this early stage of a potential regime transition, the volume of loss realization across the broader market presents a more immediate drag on momentum. The 14-day SMA of total Realized Loss currently stands at $479M per day, approximately 140% above the $200M per day baseline that characterized more stable periods of this cycle, reflecting a cohort of investors rushing to exit positions at now-narrower loss margins as price recovers.
A sustained compression of this indicator back below $200M per day would serve as a strong on-chain confirmation that selling exhaustion is taking hold, and that the market is genuinely transitioning toward a healthier demand regime. Until that threshold is reached, the dual weight of long-term holder profit taking and top-buyer distribution at thin loss margins is likely to anchor the current rally, particularly in the absence of a meaningful catalyst capable of drawing sufficient new buyer participation in the short term.
Off-Chain Insights
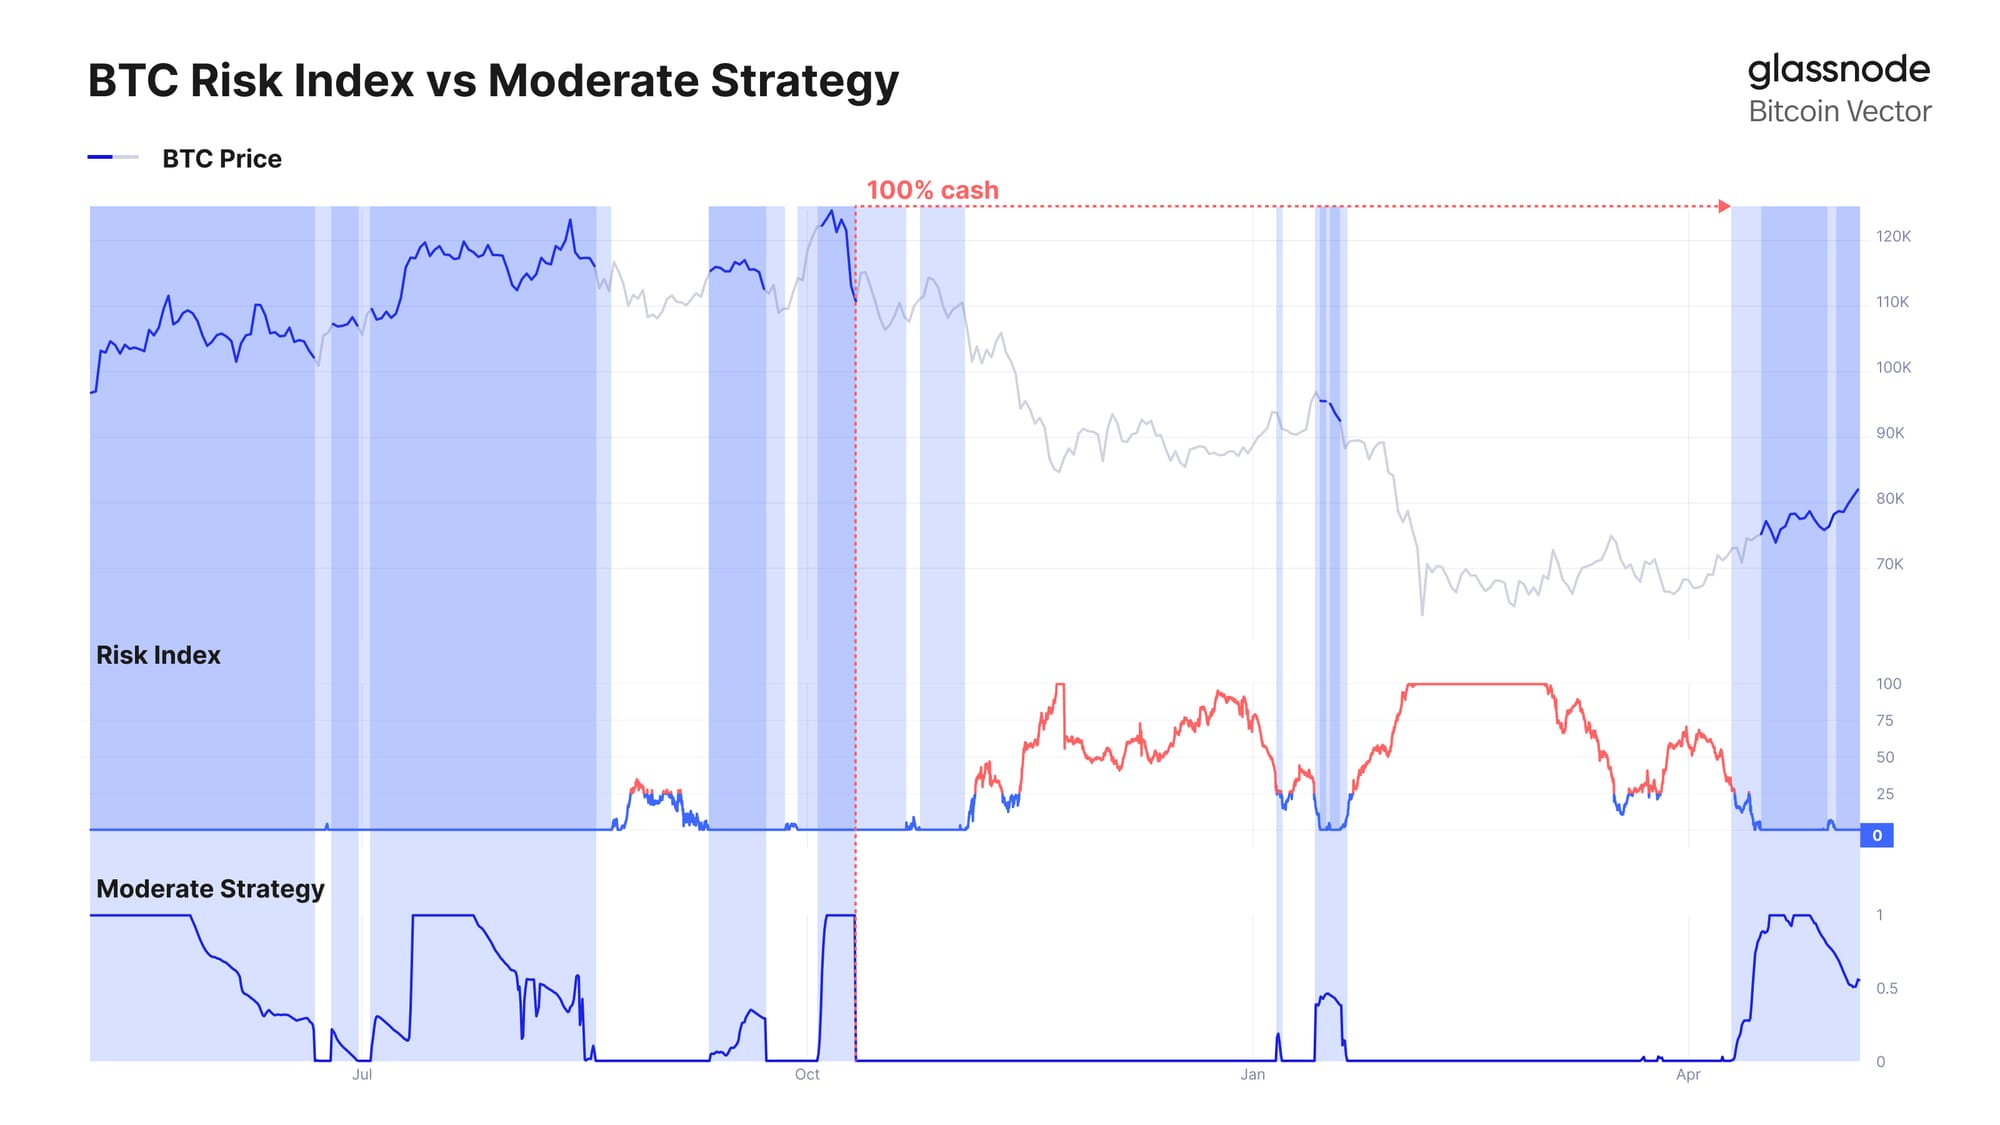
Following the recovery from the ~$66K lows and a firm break back above the ~$76K range, systematic strategies have begun to reintroduce risk. Glassnode’s Moderate Strategy, which uses off-chain market data to manage exposure, has rotated back into allocation, participating in the recent upside toward the $80K region.
Designed with a focus on downside protection, the strategy typically lags during sharp rallies but seeks to avoid deeper drawdowns and re-engage once conditions improve. This recent shift reflects a more constructive market backdrop, with price reclaiming key levels and directional momentum rebuilding.
ETF Demand Rebuilds Momentum
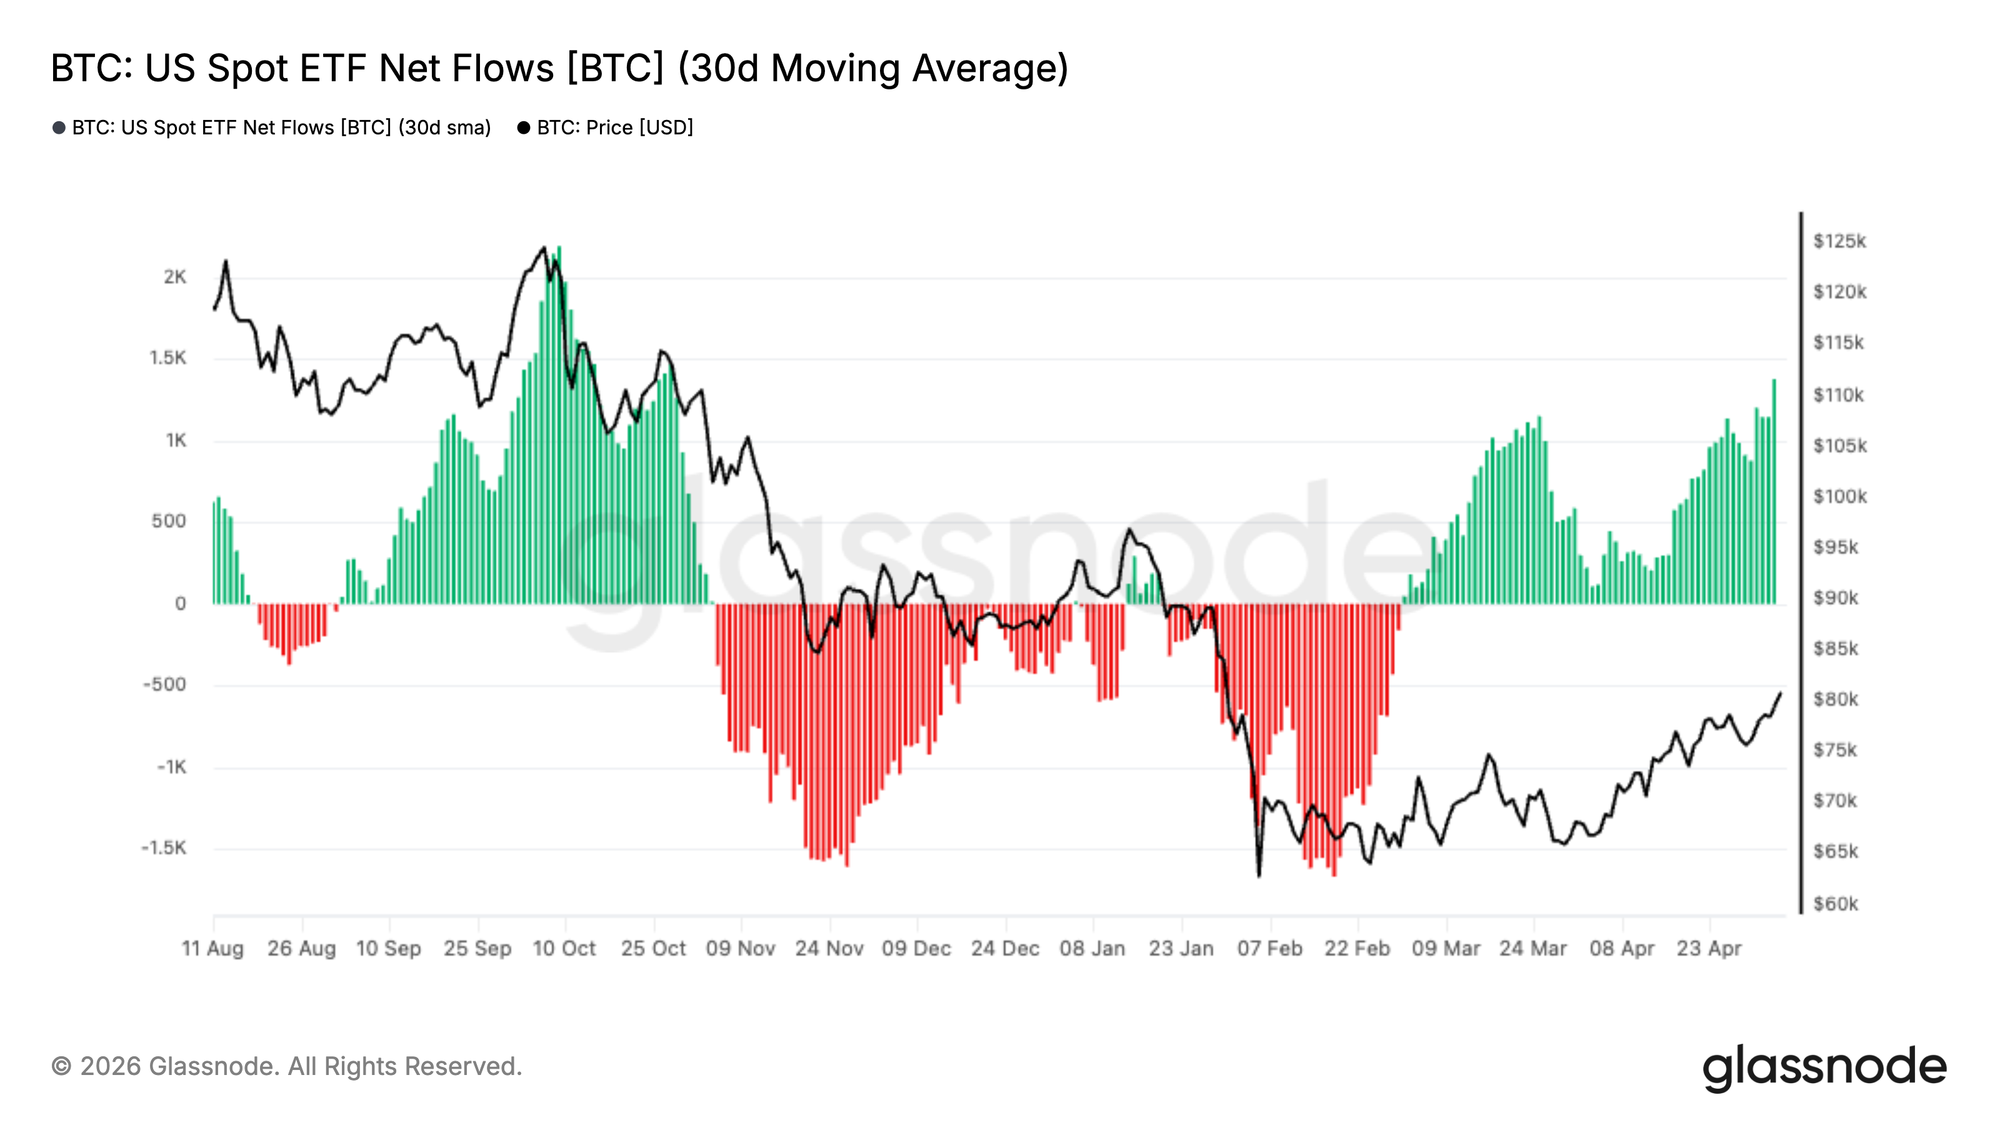
US Spot Bitcoin ETFs have seen a notable recovery in demand, with the 30-day moving average of net flows turning firmly positive after an extended period of sustained outflows. This shift marks a clear inflection in institutional appetite, following heavy distribution throughout the late-2025 to early-2026 drawdown.
The recent acceleration in inflows aligns closely with Bitcoin’s recovery from the ~$66K lows toward the $80K region, suggesting renewed conviction from traditional investors. Should this trend persist, ETF demand may once again act as a structural tailwind, reinforcing spot market strength and supporting further upside.
Short Pressure Persists
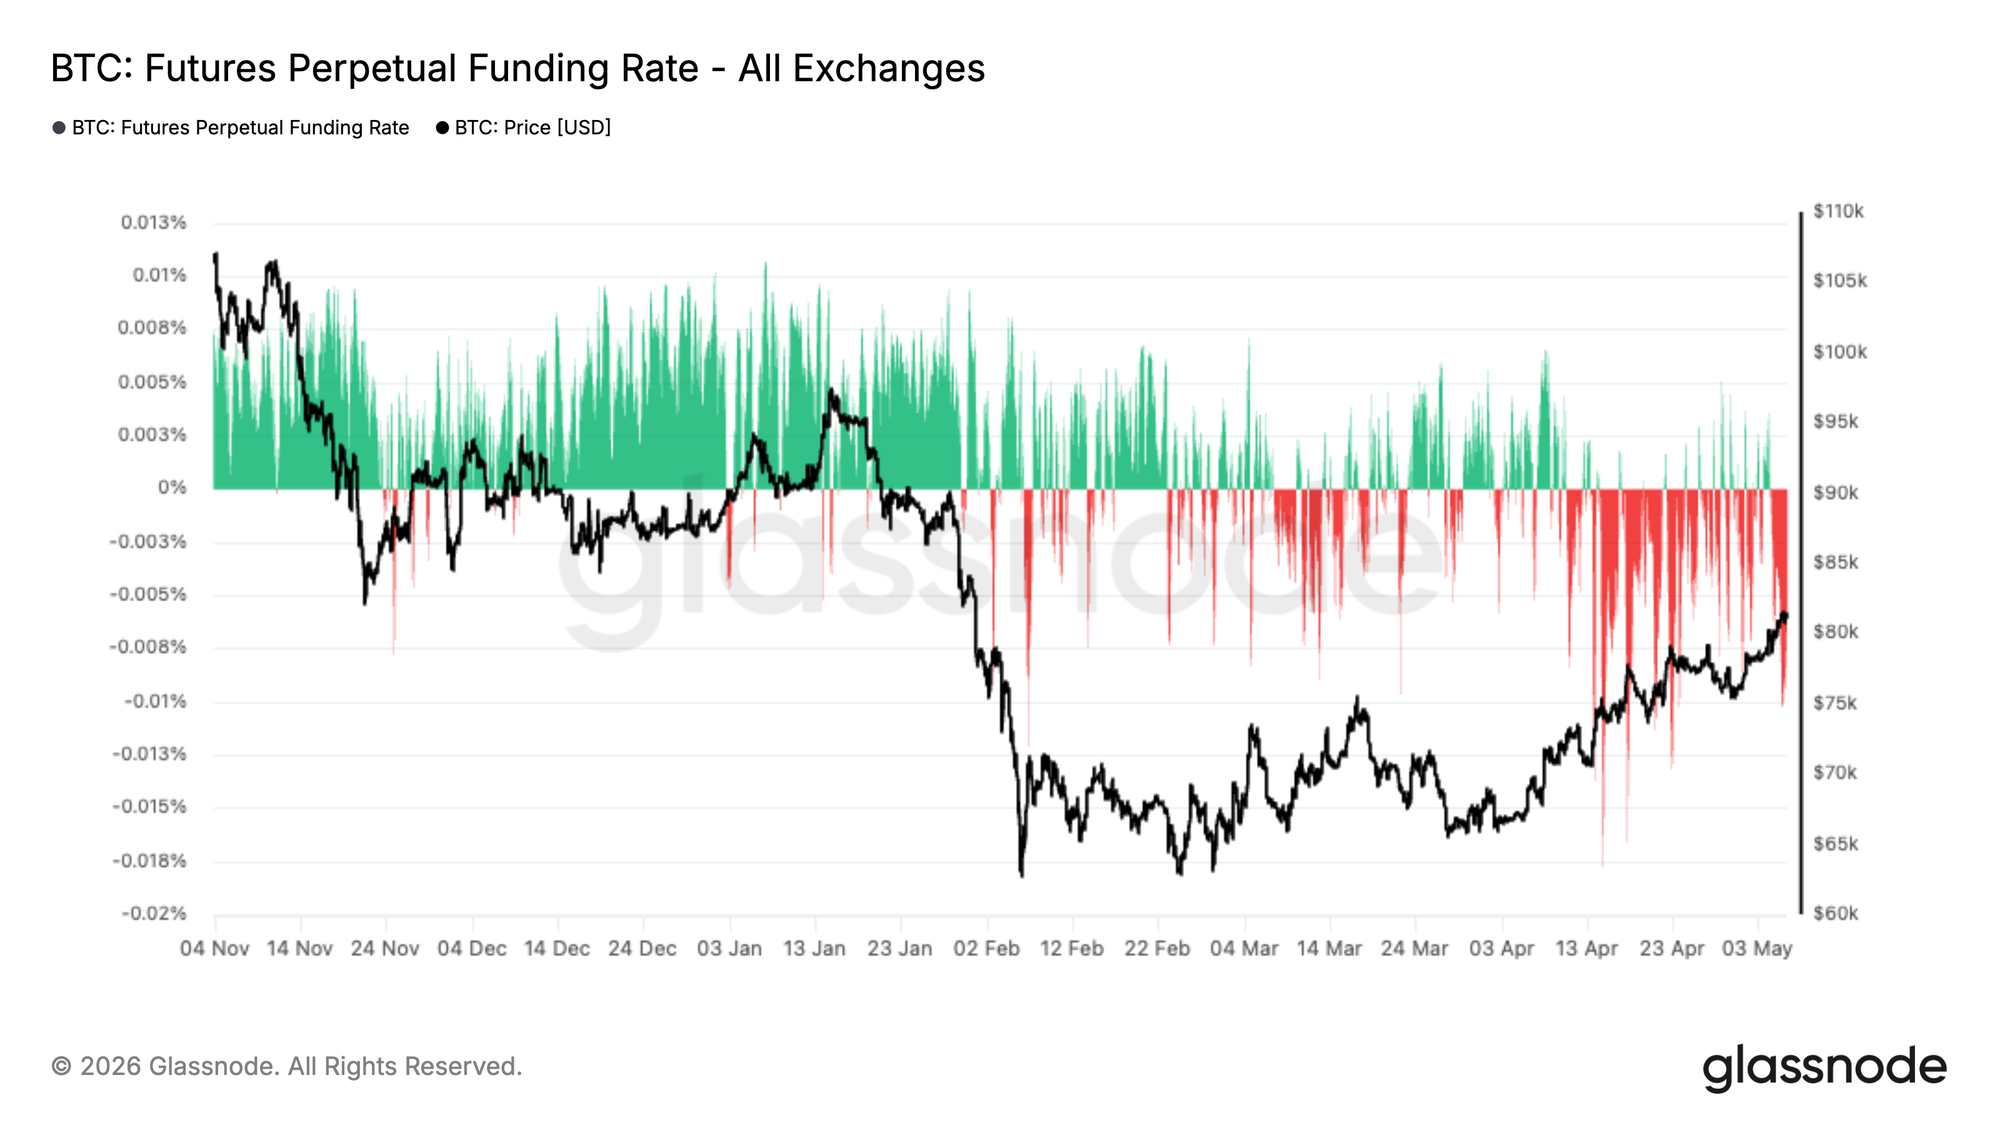
Perpetual futures funding rates remain predominantly negative, even as price recovers from the ~$66K lows to retest the $80K region. This sustained period of negative funding indicates that short positioning continues to dominate, with traders willing to pay to maintain downside exposure despite the recent upward move.
Historically, such conditions often emerge during phases of skepticism, where rallies are met with fading rather than aggressive long positioning. The persistence of negative funding alongside rising price suggests the market may be climbing a wall of worry, with the potential for further upside should short positions continue to be pressured.
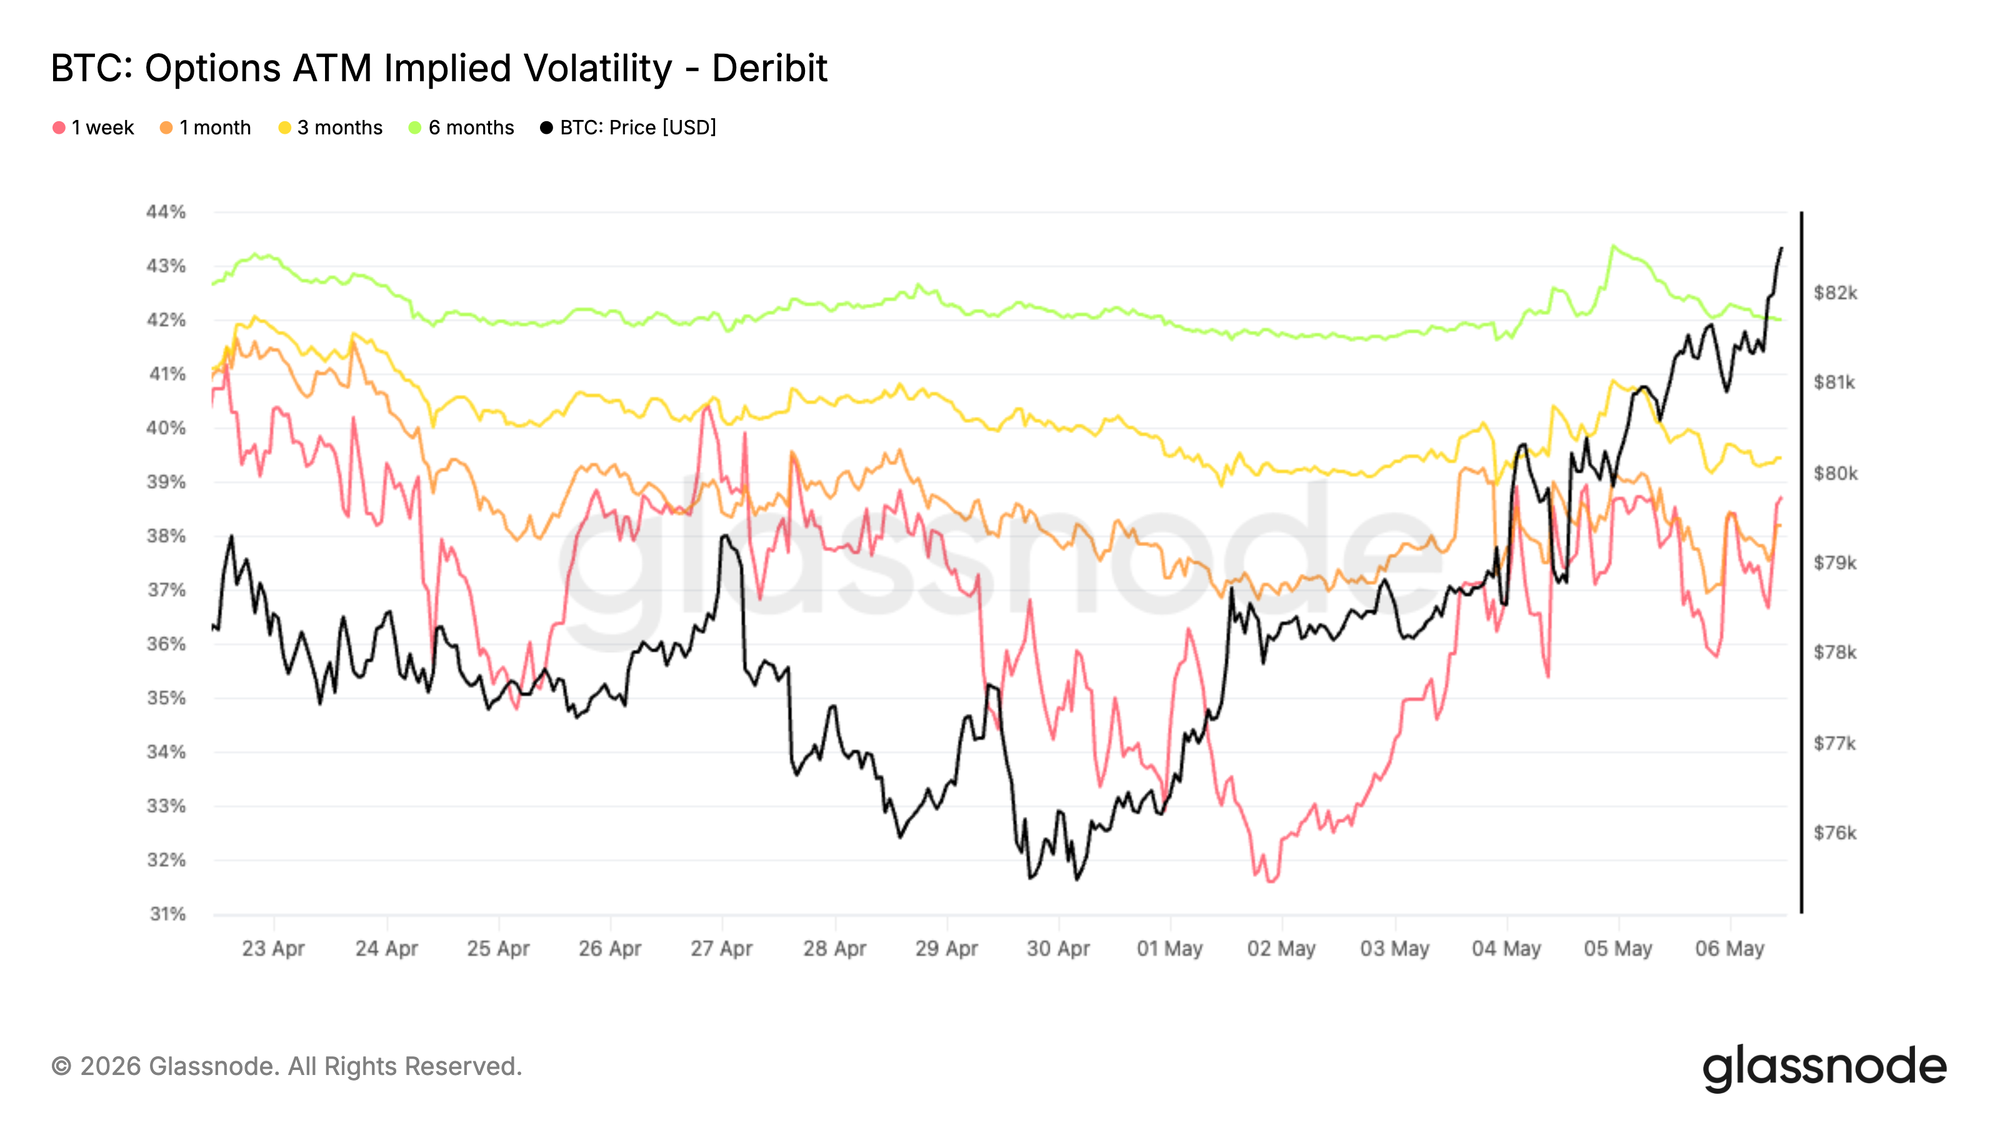
Front-End Volatility Reprices After Local Lows
Implied volatility bottomed out at the end of last week, with levels across maturities reaching their lowest point since October 2025, just before the 10/10 event.
Since then, Bitcoin has broken through resistance and brought volatility back into the market, led by the front end. The 1-week tenor has rebounded by around 6 vol points from its lows, driven by renewed upside demand and positioning adjustments.
This move has been amplified by gamma sellers rolling exposure, as they buy back short-dated options and sell further out the curve. As a result, the front end has repriced sharply while longer maturities have only moved modestly, up 1 to 2 vol points.
This reflects a short-term re-engagement in optionality without a broader shift in long-dated volatility expectations.
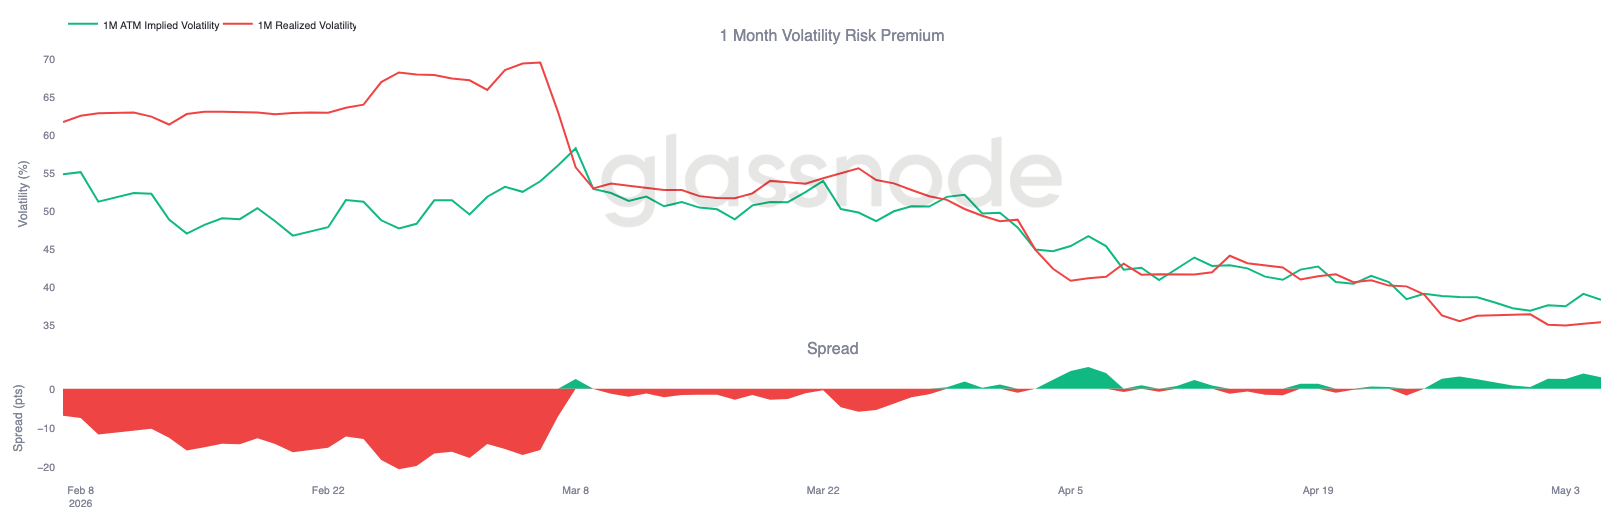
Vol Risk Premium Rebuilds as Implied Leads
Bitcoin’s realized volatility continues to drift lower, with 1-month RV now at 35.38%, even as price has moved sharply higher over the past week.
This creates a clear divergence, with implied volatility repricing faster than realized following the breakout. The volatility risk premium has turned positive again, with the spread approaching 3 vols, reflecting renewed demand for short-term optionality. This shows that realized volatility has not kept pace with the recent price move. Implied is leading, driven by positioning and front-end demand, while realized remains comparatively contained.
The setup still supports carry, but the widening spread suggests the market is starting to price more movement ahead than what has been delivered so far.
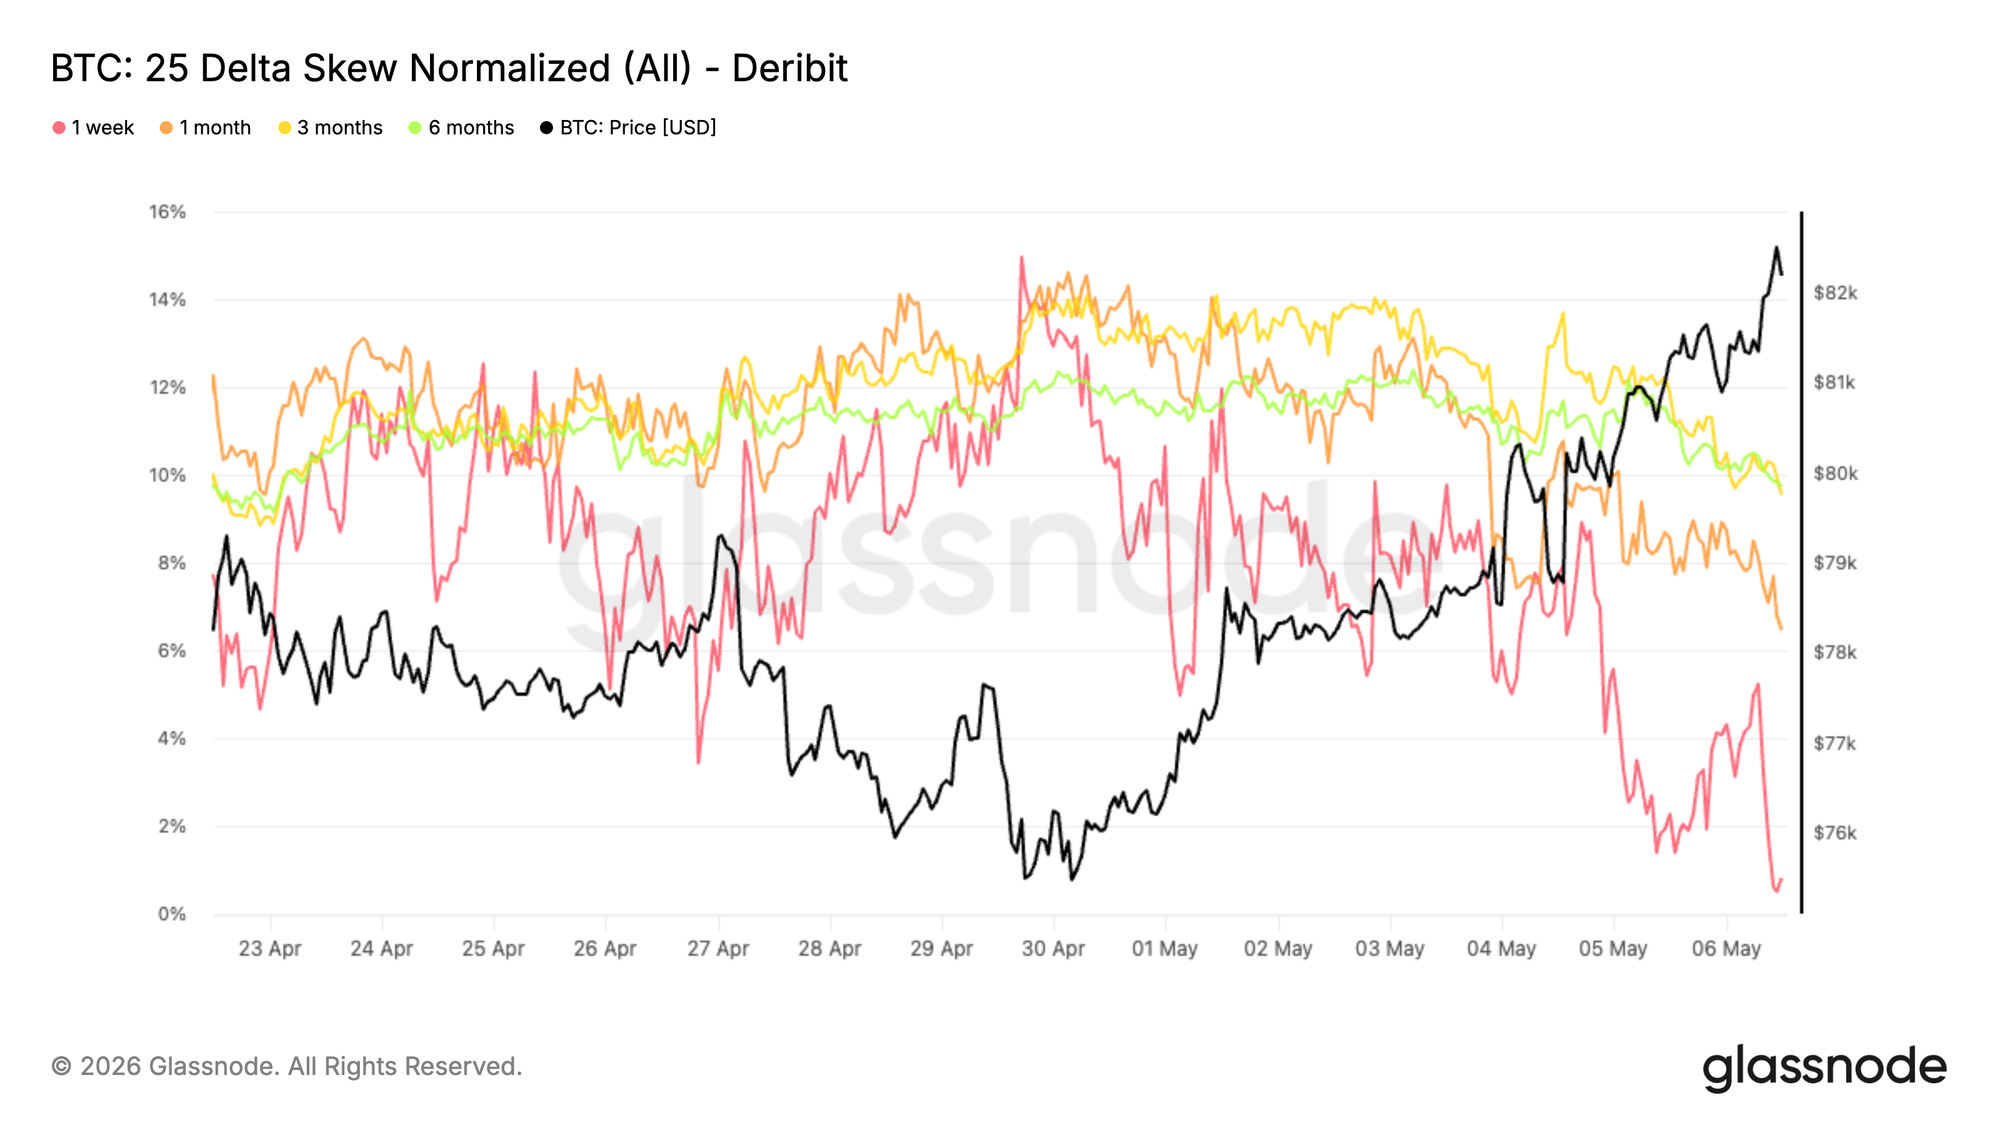
Skew Normalizes as Downside Demand Fades
Skew is moving back toward neutral across tenors, reflecting a clear shift in positioning. After holding a consistent put premium, the 25D skew is now compressing, though it still remains in put territory.
The move is most visible at the front end, with the 1-week skew now close to zero, as downside demand fades. Given the metric is calculated as put minus call, this move lower indicates that puts are losing their premium relative to calls. Longer tenors are also trending lower, though more gradually, and still retain a put premium despite this compression.
This suggests that protection is being unwound rather than added, especially in the near term. The shift comes alongside the recent price breakout, with traders reducing hedges and leaning more into directional exposure. Skew no longer signals strong demand for downside protection.
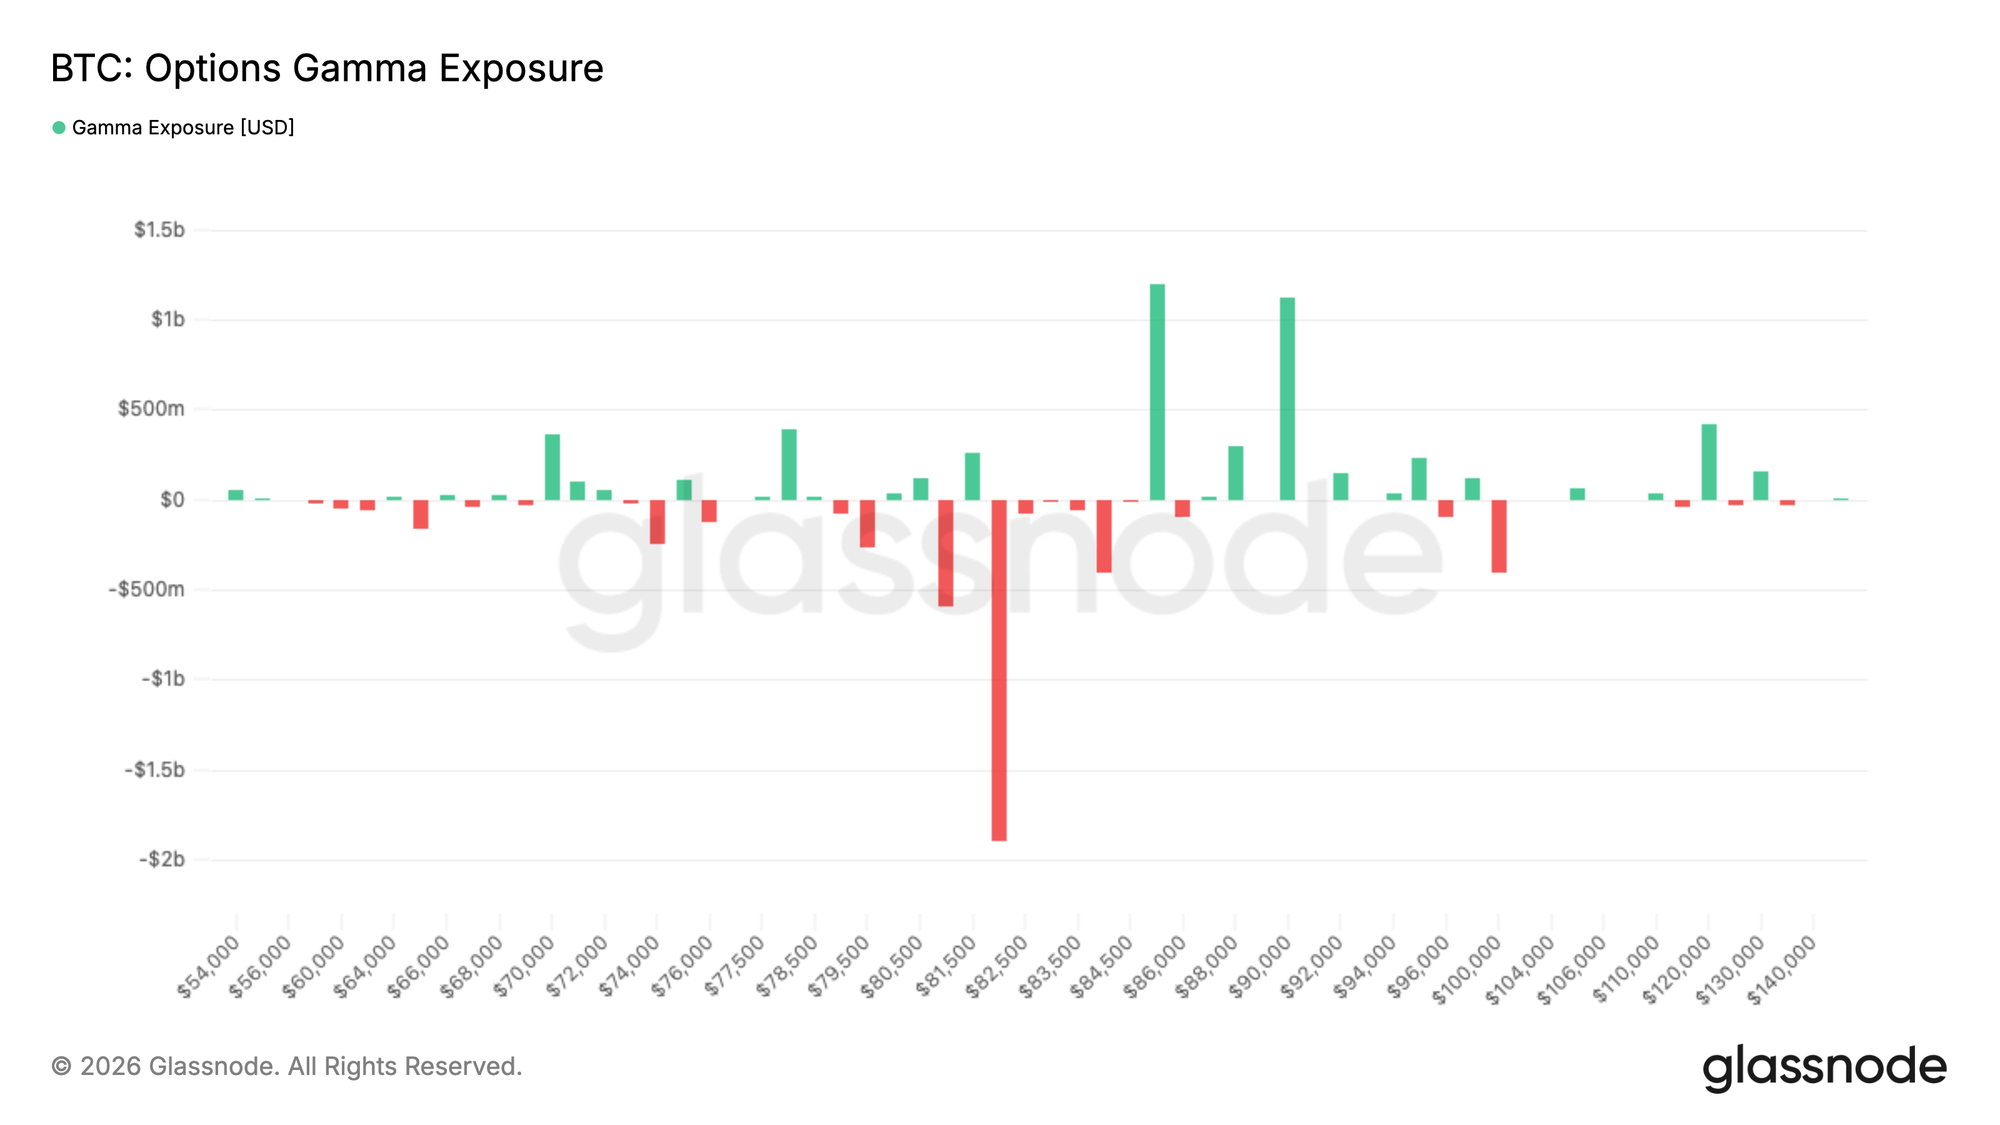
Large Short Gamma Cluster Drives Spot Sensitivity
Gamma positioning shows a clear concentration of short gamma around the $82K strike, with nearly $2B of exposure sitting right at current spot levels.
Short gamma means dealers are positioned in a way that forces them to hedge in the direction of the move, buying as price rises and selling as it falls. This creates a feedback loop that can accelerate price action, which helps explain the recent push toward $83K.
The effect has been reinforced by strong call buying, which accounted for around 40% of taker flow over the past 24 hours, adding pressure into this zone.
With spot sitting directly on this large short gamma cluster, the market enters a highly sensitive area where small moves can trigger outsized reactions. Price is likely to remain reactive here, with the potential for sharp swings in either direction as hedging flows intensify.
Conclusion
Bitcoin is showing early signs of structural recovery, reclaiming key on-chain cost basis levels while pushing toward overhead resistance near the $85K region. Spot demand and ETF inflows are rebuilding, suggesting bulls remain in control, but the market is now approaching a key ceiling where supply may begin to re-emerge.
At the same time, derivatives positioning remains skewed to the short side, creating conditions where further upside could be driven by short pressure. Options markets are resetting, and the presence of short gamma near current price levels increases the likelihood of amplified moves as price tests resistance.
In sum, the trend appears constructive with bullish momentum intact, but the market is now entering a more reactive phase. A sustained break above resistance, supported by continued spot demand and easing sell-side pressure, will be required to confirm a durable continuation higher.
Disclaimer: This report does not provide any investment advice. All data is provided for informational and educational purposes only. No investment decision shall be based on the information provided here, and you are solely responsible for your own investment decisions.
Exchange balances presented are derived from Glassnode’s comprehensive database of address labels, which are amassed through both officially published exchange information and proprietary clustering algorithms. While we strive to ensure the utmost accuracy in representing exchange balances, it is important to note that these figures might not always encapsulate the entirety of an exchange’s reserves, particularly when exchanges refrain from disclosing their official addresses. We urge users to exercise caution and discretion when utilizing these metrics. Glassnode shall not be held responsible for any discrepancies or potential inaccuracies.