Bitcoin (BTC) begins a key week of internal and macroeconomic events still trading above $20,000.
After its highest weekly close since mid-September, BTC/USD remains tied to higher levels within a macro trading range.
Bulls have been keen to shift the trend entirely, while warnings from more conservative market participants continue to call for macro lows to enter next.
So far, a tug-of-war between the two parties is what has characterized BTC price action, and any internal or external triggers have only had a temporary effect. What could change that?
The first week of November contains a key event which has the potential to shape price behavior going forward — a decision by the United States Federal Reserve on interest rate hikes.
In addition to other macroeconomic data, this will form the backdrop to overall market sentiment beyond crypto.
Bitcoin will further see a monthly close during the week, this apt to spark last-minute volatility despite October 2022 being one of the quietest on record.
Cointelegraph takes a look at these and several other factors impacting BTC/USD in the coming days.
FOMC countdown enters final days
The headline story of the week comes courtesy of the Fed and the meeting of its Federal Open Market Committee (FOMC).
On Nov. 1-2, officials will make a decision on the November benchmark interest rate hike, this overwhelmingly priced in at 0.75%.
While this will match the Fed’s previous two hikes in September and July, respectively, markets will be watching for something else — subtle hints of a change in quantitative tightening (QT).
The rates decision is due Wednesday at 2pm Eastern time, along with an accompanying statement and economic projections.
Fed Chair Jerome Powell will then deliver a speech at 2:30pm, this completing the backdrop to market reactions.
As Cointelegraph reported, there is already talk that subsequent rate hikes will begin to trend towards neutral, marking the end of an aggressive policy enacted almost a year ago.
For Bitcoin and risk assets in general, this could ultimately provide some serious fuel for growth as conditions loosen.
Looking at the short term, however, commentators expect a standard reaction to the upcoming FOMC announcement.
“Think we see a little pullback this week which is pretty typical when the FED will be announcing rates,” popular trading account IncomeSharks summarized to Twitter followers.
“4h showing a double top and downtrend break.”
An accompanying chart showed the expected retracement to be followed by more potential upside going forward.
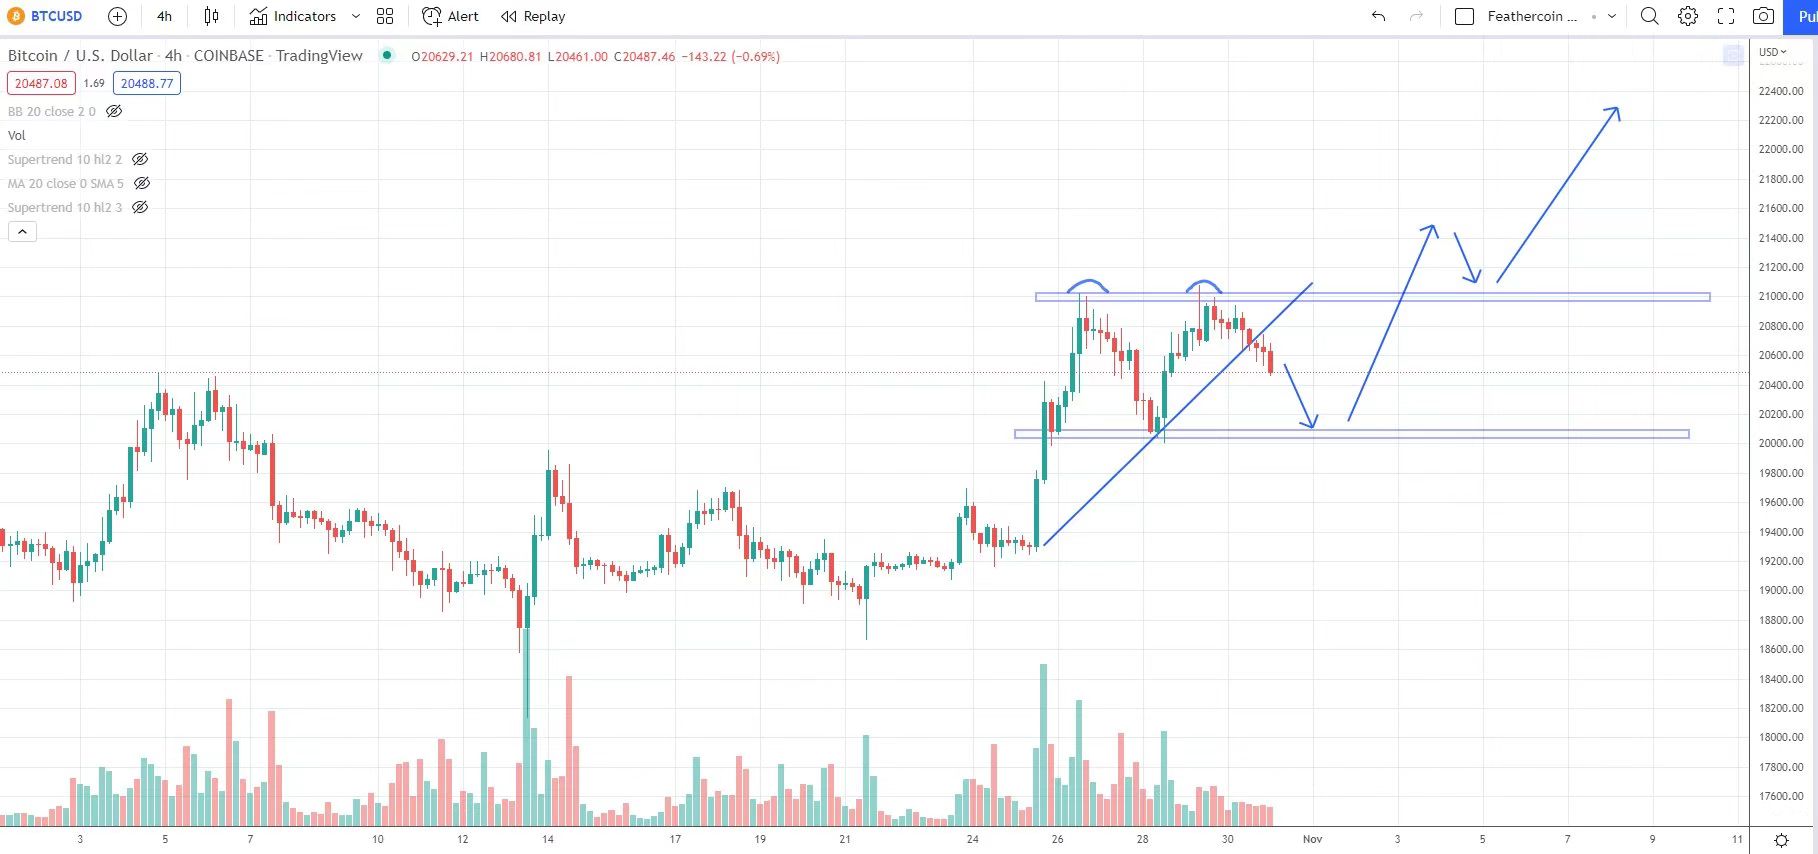
BTC/USD annotated chart. Source: IncomeSharks/ TwitterAn alternative perspective came from analyst Kevin Svenson this weekend, who warned that with inflation expectations “increasing,” there was little reason to hope for a rate hike decrease in the near future.
“Every time the Stock Market rallied up in this current downtrend, it did so with the expectation of a FED pivot,” he noted.
“Inflation expectations increasing recently making a FED pivot less likely. The trend is ur friend? If so, Stocks find another lower high after FOMC.”
Svenson continued that should the Fed surprise with a lower hike than 0.75%, bullish momentum should “take over.”
“Obviously, this could be wrong if the FED does a "soft pivot" and goes for 50 basis points,” he added.
“If that occurs, the market would get excited and bullish speculation would take over for the time being.”
According to CME Group’s FedWatch Tool, the chances of a lower hike than 0.75% are currently 19%.
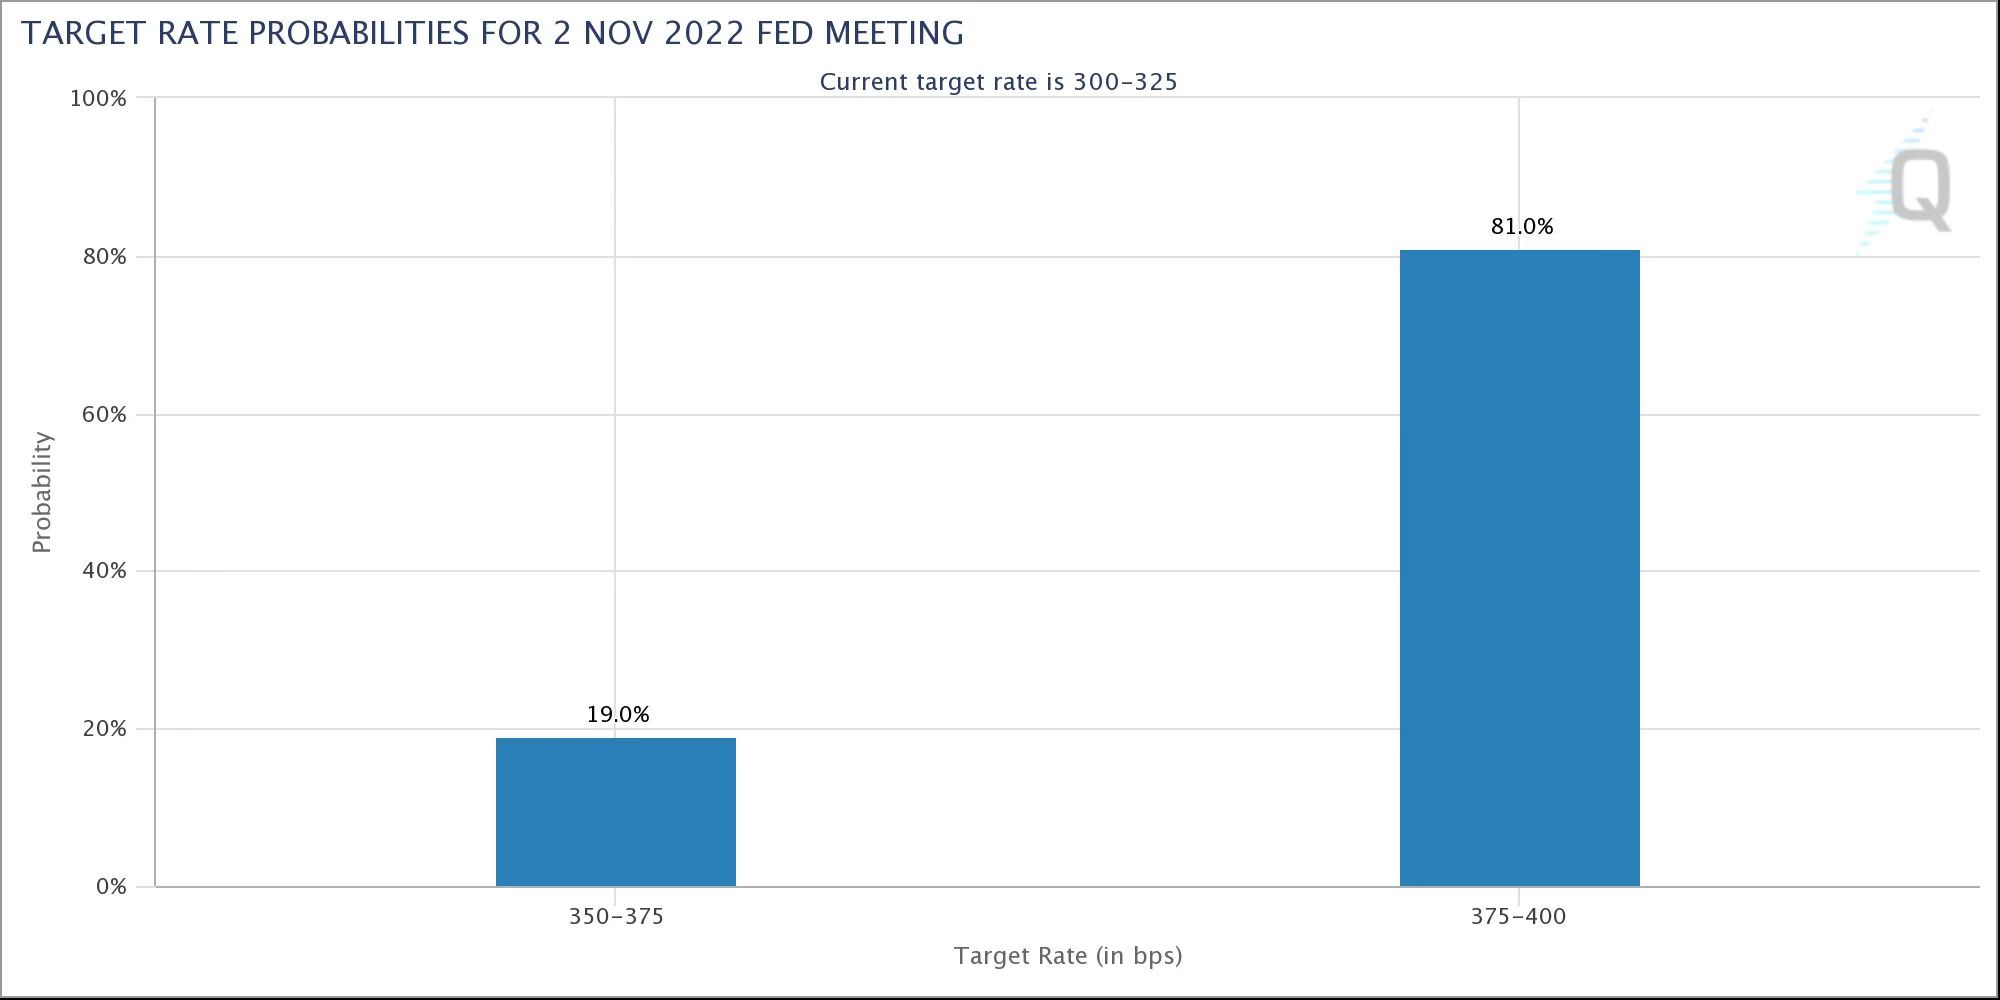
Fed target rate probabilities chart. Source: CME GroupIn a summary of the FOMC event, popular analyst @Tedtalksmacro meanwhile drew similarities with Svenson’s take.
“There’s lots of talk about a ‘pivot’ or that ‘the Fed are breaking things and need to stop hiking.’ But, the data says otherwise and points to nothing other than hawkishness again this week,” it said.
"Clear double top" sparks BTC downside talk
Bitcoin managed to avoid major volatility as it closed the weekly candle at around $20,625 on Bitstamp, data from Cointelegraph Markets Pro and TradingView confirms.
That in itself was noteworthy, marking the highest weekly candle close in six weeks for BTC/USD.
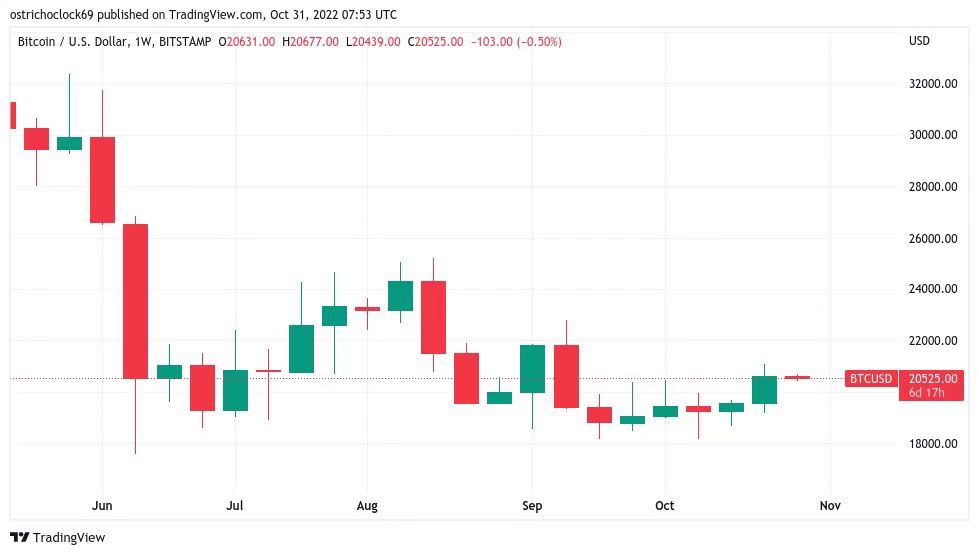
BTC/USD 1-week candle chart (Bitstamp). Source: TradingViewThe daily chart meanwhile retains the 100-day moving average as current resistance.
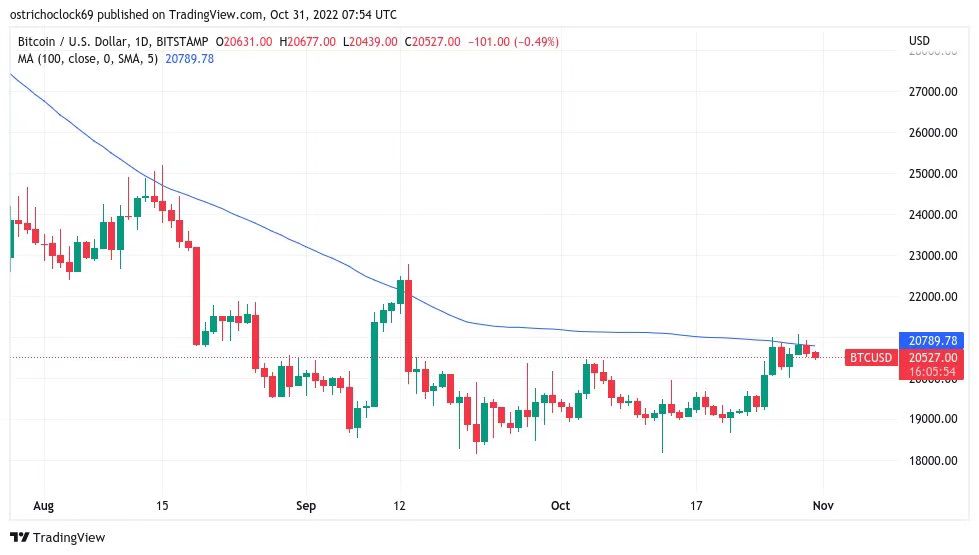
BTC/USD 1-day candle chart (Bitstamp) with 100MA. Source: TradingViewNonetheless, the long-established trading range the pair has acted in for months on end remains firmly in place, and even last week’s push higher failed to produce a significant paradigm shift.
For analyst Mark Cullen, it is thus a question of “wait and see” when it comes to Bitcoin’s next move.
In fresh analysis on Oct. 31, he noted BTC/USD had returned to a familiar Fibonacci level based on last week’s upside while continuing to range.
“Bitcoin pulled back to the 20.4k level at the 61.8 of the last push up & has held it so far,” he explained.
“With the FOMC meeting this week, i wonder if BTC just range between here & 21k until a catalyst pushes it in one direction or the other. Levels are clear, sit & wait.”
Tedtalksmacro drew a similar conclusion on macro markets in general — they expect the “same old hawkishness” from the Fed, and thus even FOMC delivering no surprises should be enough for last week’s bullish tone to continue.
“Nothing new is bullish — as the market seems prepared for all of the hawkishness that we have heard so far,” he concluded.
“Expect volatility this week and if everything goes smoothly, for a really, really hated rally.”
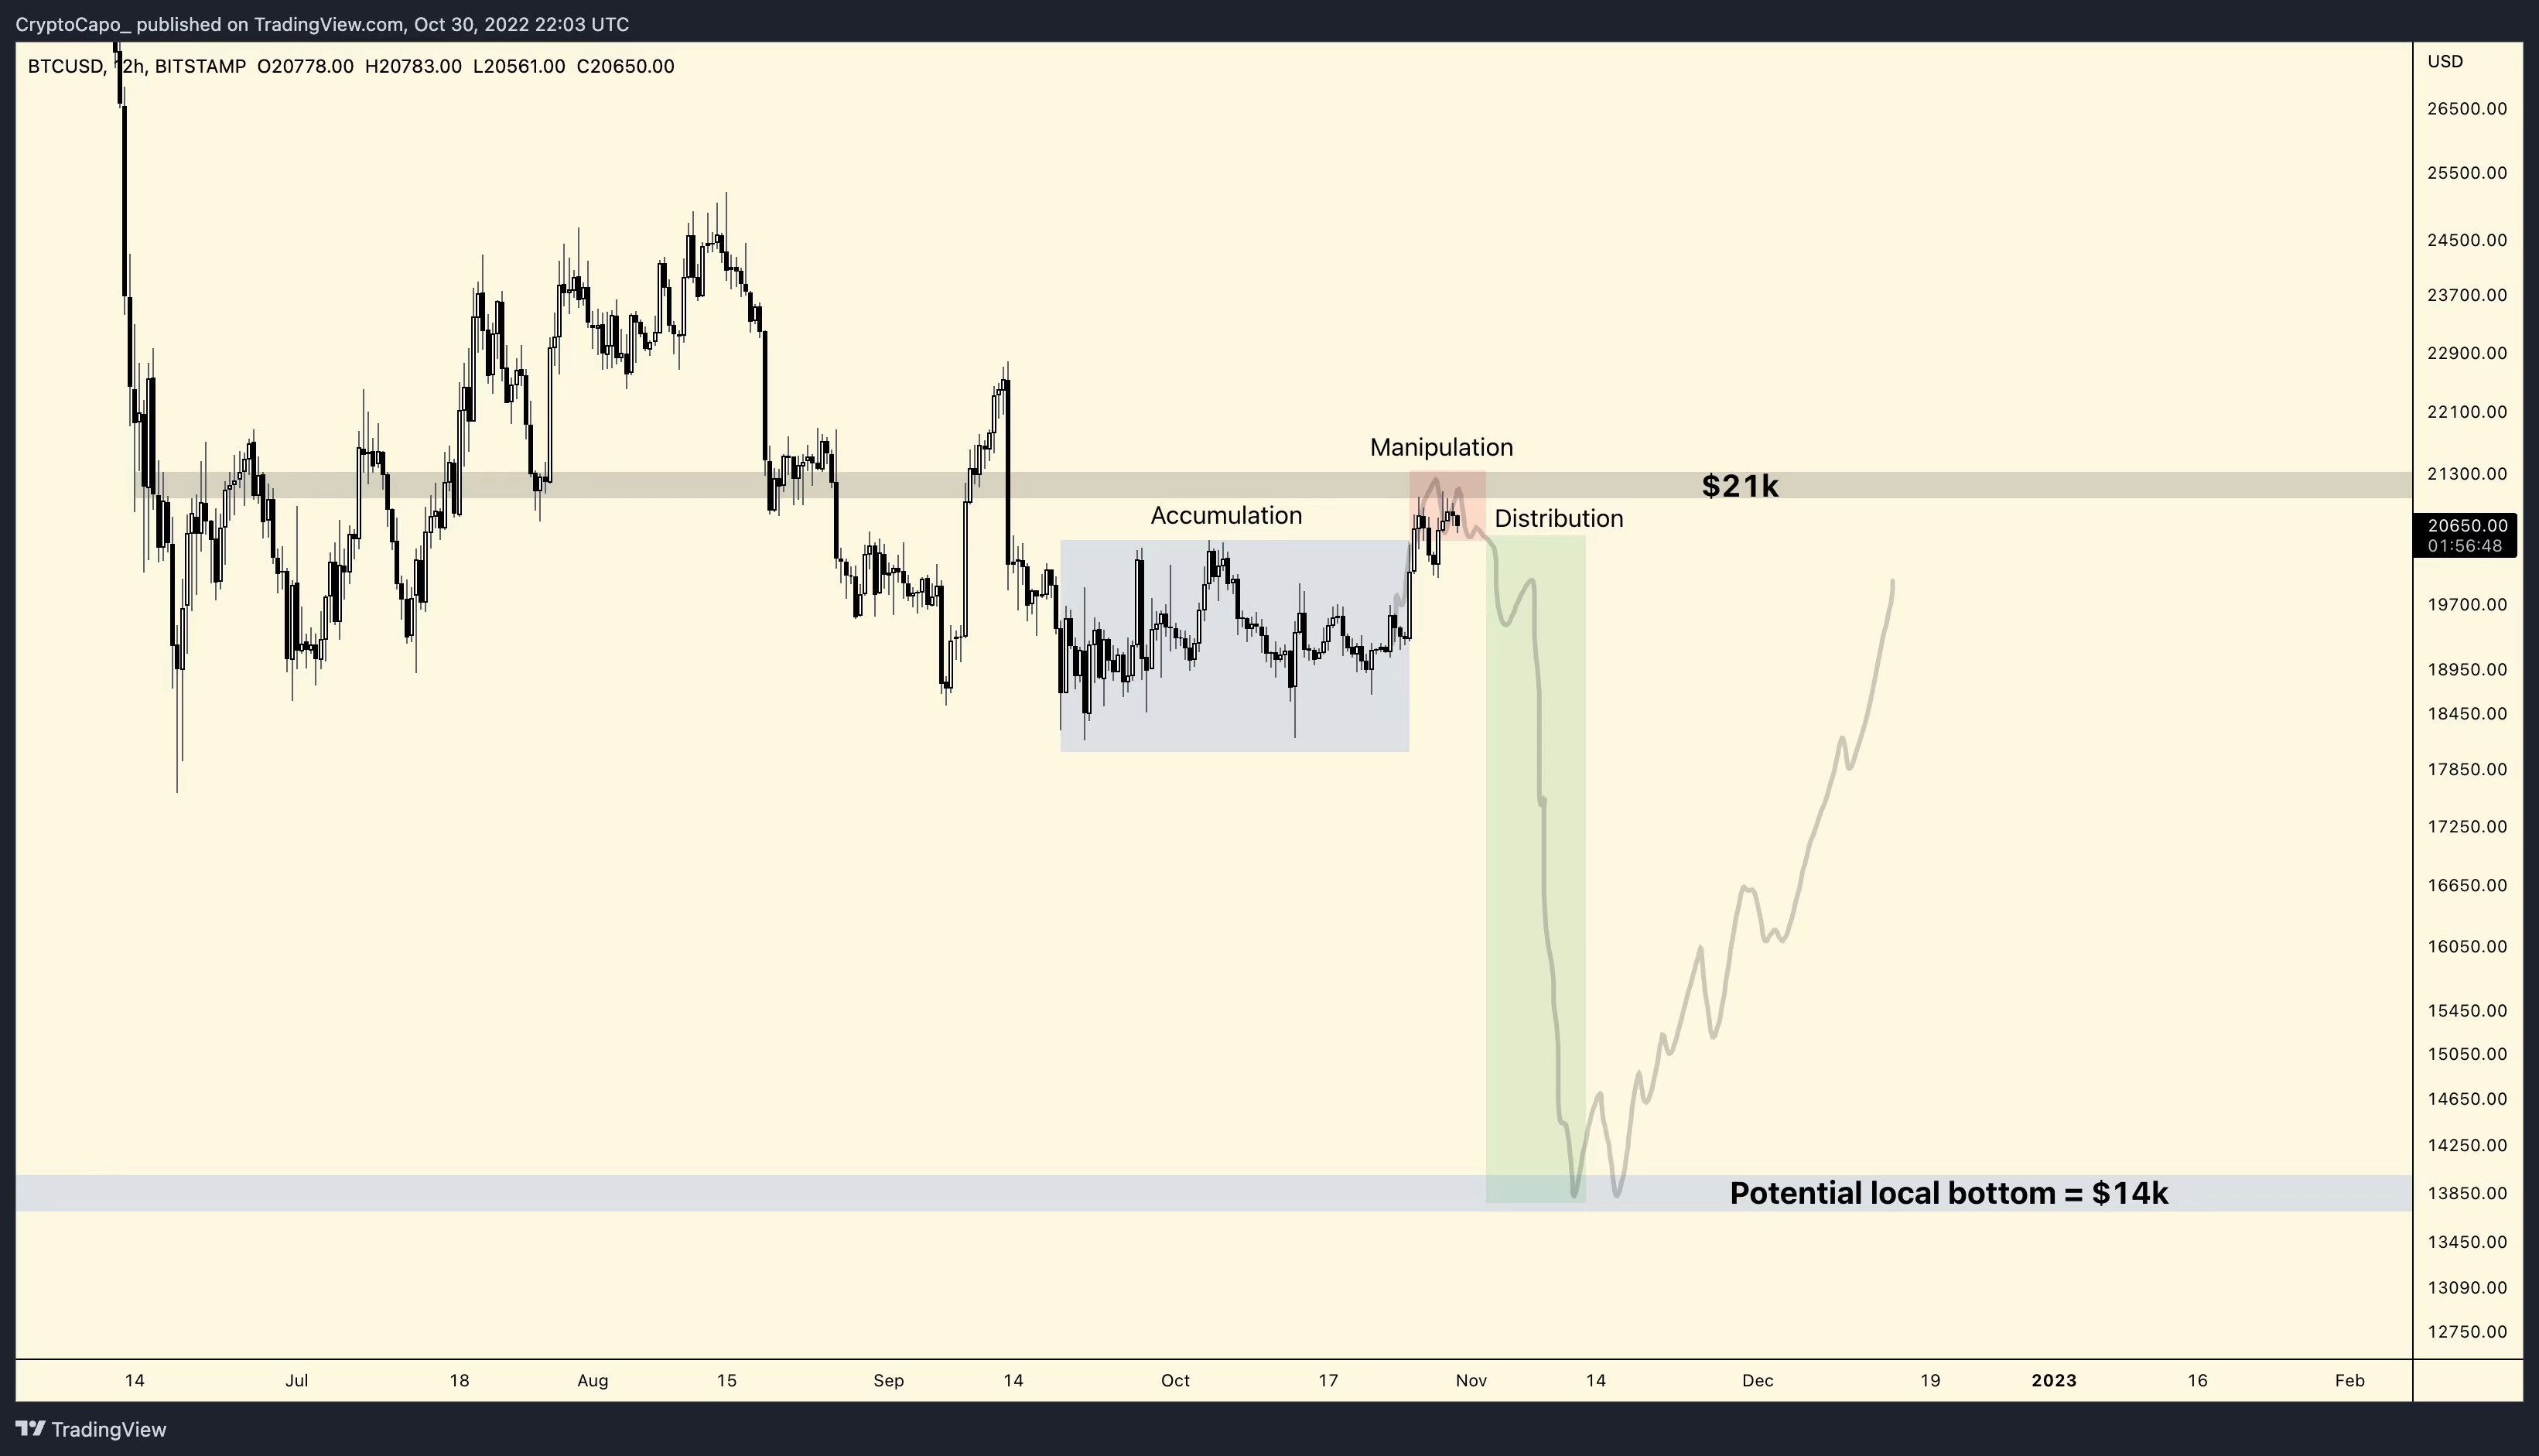
Crypto trader and analyst Il Capo of Crypto meanwhile called the two spikes above $21,000 in recent days a “clear double top” for Bitcoin.
His target of a reversion to downside and new macro lows, possibly coming in at $14,000, remains in force.
BTC/USD annotated chart. Source: Il Capo of Crypto/ TwitterToo early to bottom
Comparisons between this year and 2018, Bitcoin’s last bear market, are abundant currently — but it may be a case of “too much, too soon.”
In analysis released late last week, on-chain analytics platform CryptoQuant argued that while Bitcoin is putting the pieces of the puzzle in place to bottom out, the market is not there yet.
“Similar to the bottoms in 2015 and 2018-2019, bitcoin prices have been trading in a narrow range (between $18,000 and $20,000 for almost two months),” it began.
“Price volatility has also dropped to one of its lowest levels ever and surged. When price volatility was this low in the past, it typically indicated that the downward trend was about to end. But in 2018, low price volatility was swiftly followed by a 50% price drop from $6.5k to $3.2k in just one month.”
CryptoQuant flagged two important on-chain metrics — MVRV and UTXO Realized Cap — supporting the theory that the next bear market bottom is still a way off.
MVRV divides Bitcoin’s market cap by realized cap, and is “useful,” in the words of popular analyst Willy Woo, for detecting overbought oversold conditions, as well as macro tops and bottoms.
UTXO Realized Cap is the price at which different cohorts of bitcoins were transferred compared to the prior time, giving an insight into profit and loss.
“MVRV and UTXO Realized Cap 6 months and older Age Bands show that the price of bitcoin is in the value range,” CryptoQuant continued.
“However, a reasonable length of time needs to pass before the 1-3 months UTXO Age Band Realized Price is overtaken for a prolonged growth trend. Currently, this level is at $21,264.”
As such, levels above $21,000 need to hold for the trend to change, and so far, that line in the sand has proven impossible to hold for hours, let alone weeks.
“We have seen that market bottoms can be correlated with unusually low volatility in bitcoin prices,” CryptoQuant concluded.
“Nevertheless, many of the on-chain measures we have examined still do not support the conclusion that the price has reached its bottom and is rising.”
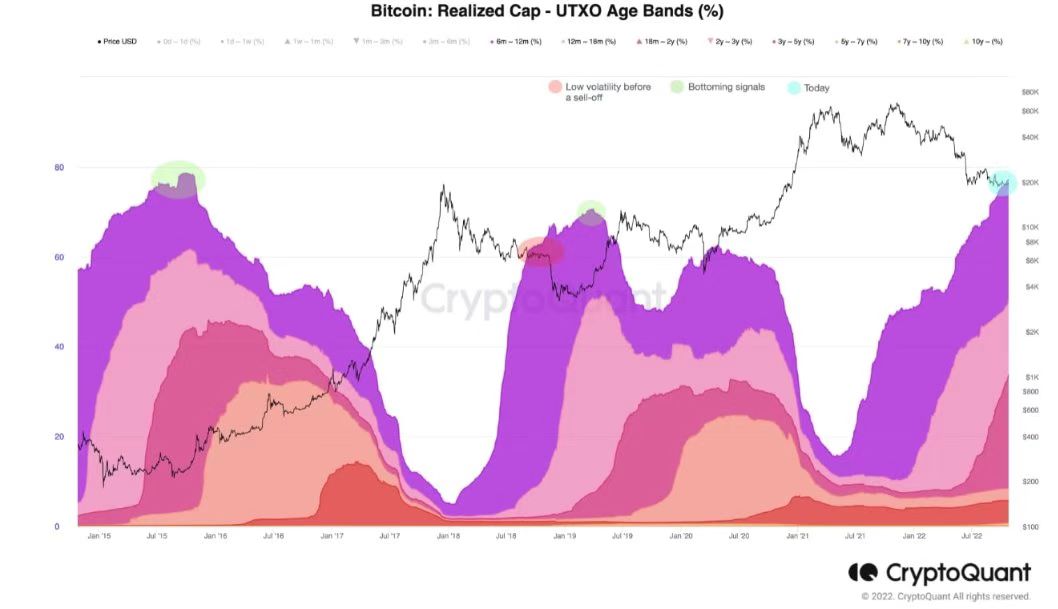
Bitcoin UTXO Realized Cap annotated chart (screenshot). Source: CryptoQuantSupply shock risk highest since 2017
Bitcoin dormant for up to a decade has been on the move recently, but overall, the BTC supply is becoming more and more illiquid.
Fresh data this week provides the latest hint that an increase in buyer interest could spark a considerable supply squeeze and associated price hike.
Highlighting data from on-chain analytics firm Coin Metrics, Jack Neureuter, a researcher at Fidelity Digital Assets, revealed that the percentage of the supply moved in the past year is now at an all-time low.
33.7% of all available BTC has left its wallet since the end of October 2021, this also accounting for the increased volumes around November’s $69,000 all-time high.
“Put another way, 2/3 of $BTC supply hasn’t moved the past 365 days,” Neureuter added in comments.
“Marginal trading drives prices over the short-term, but large imbalances between supply and demand tend to do so in the long-term.”
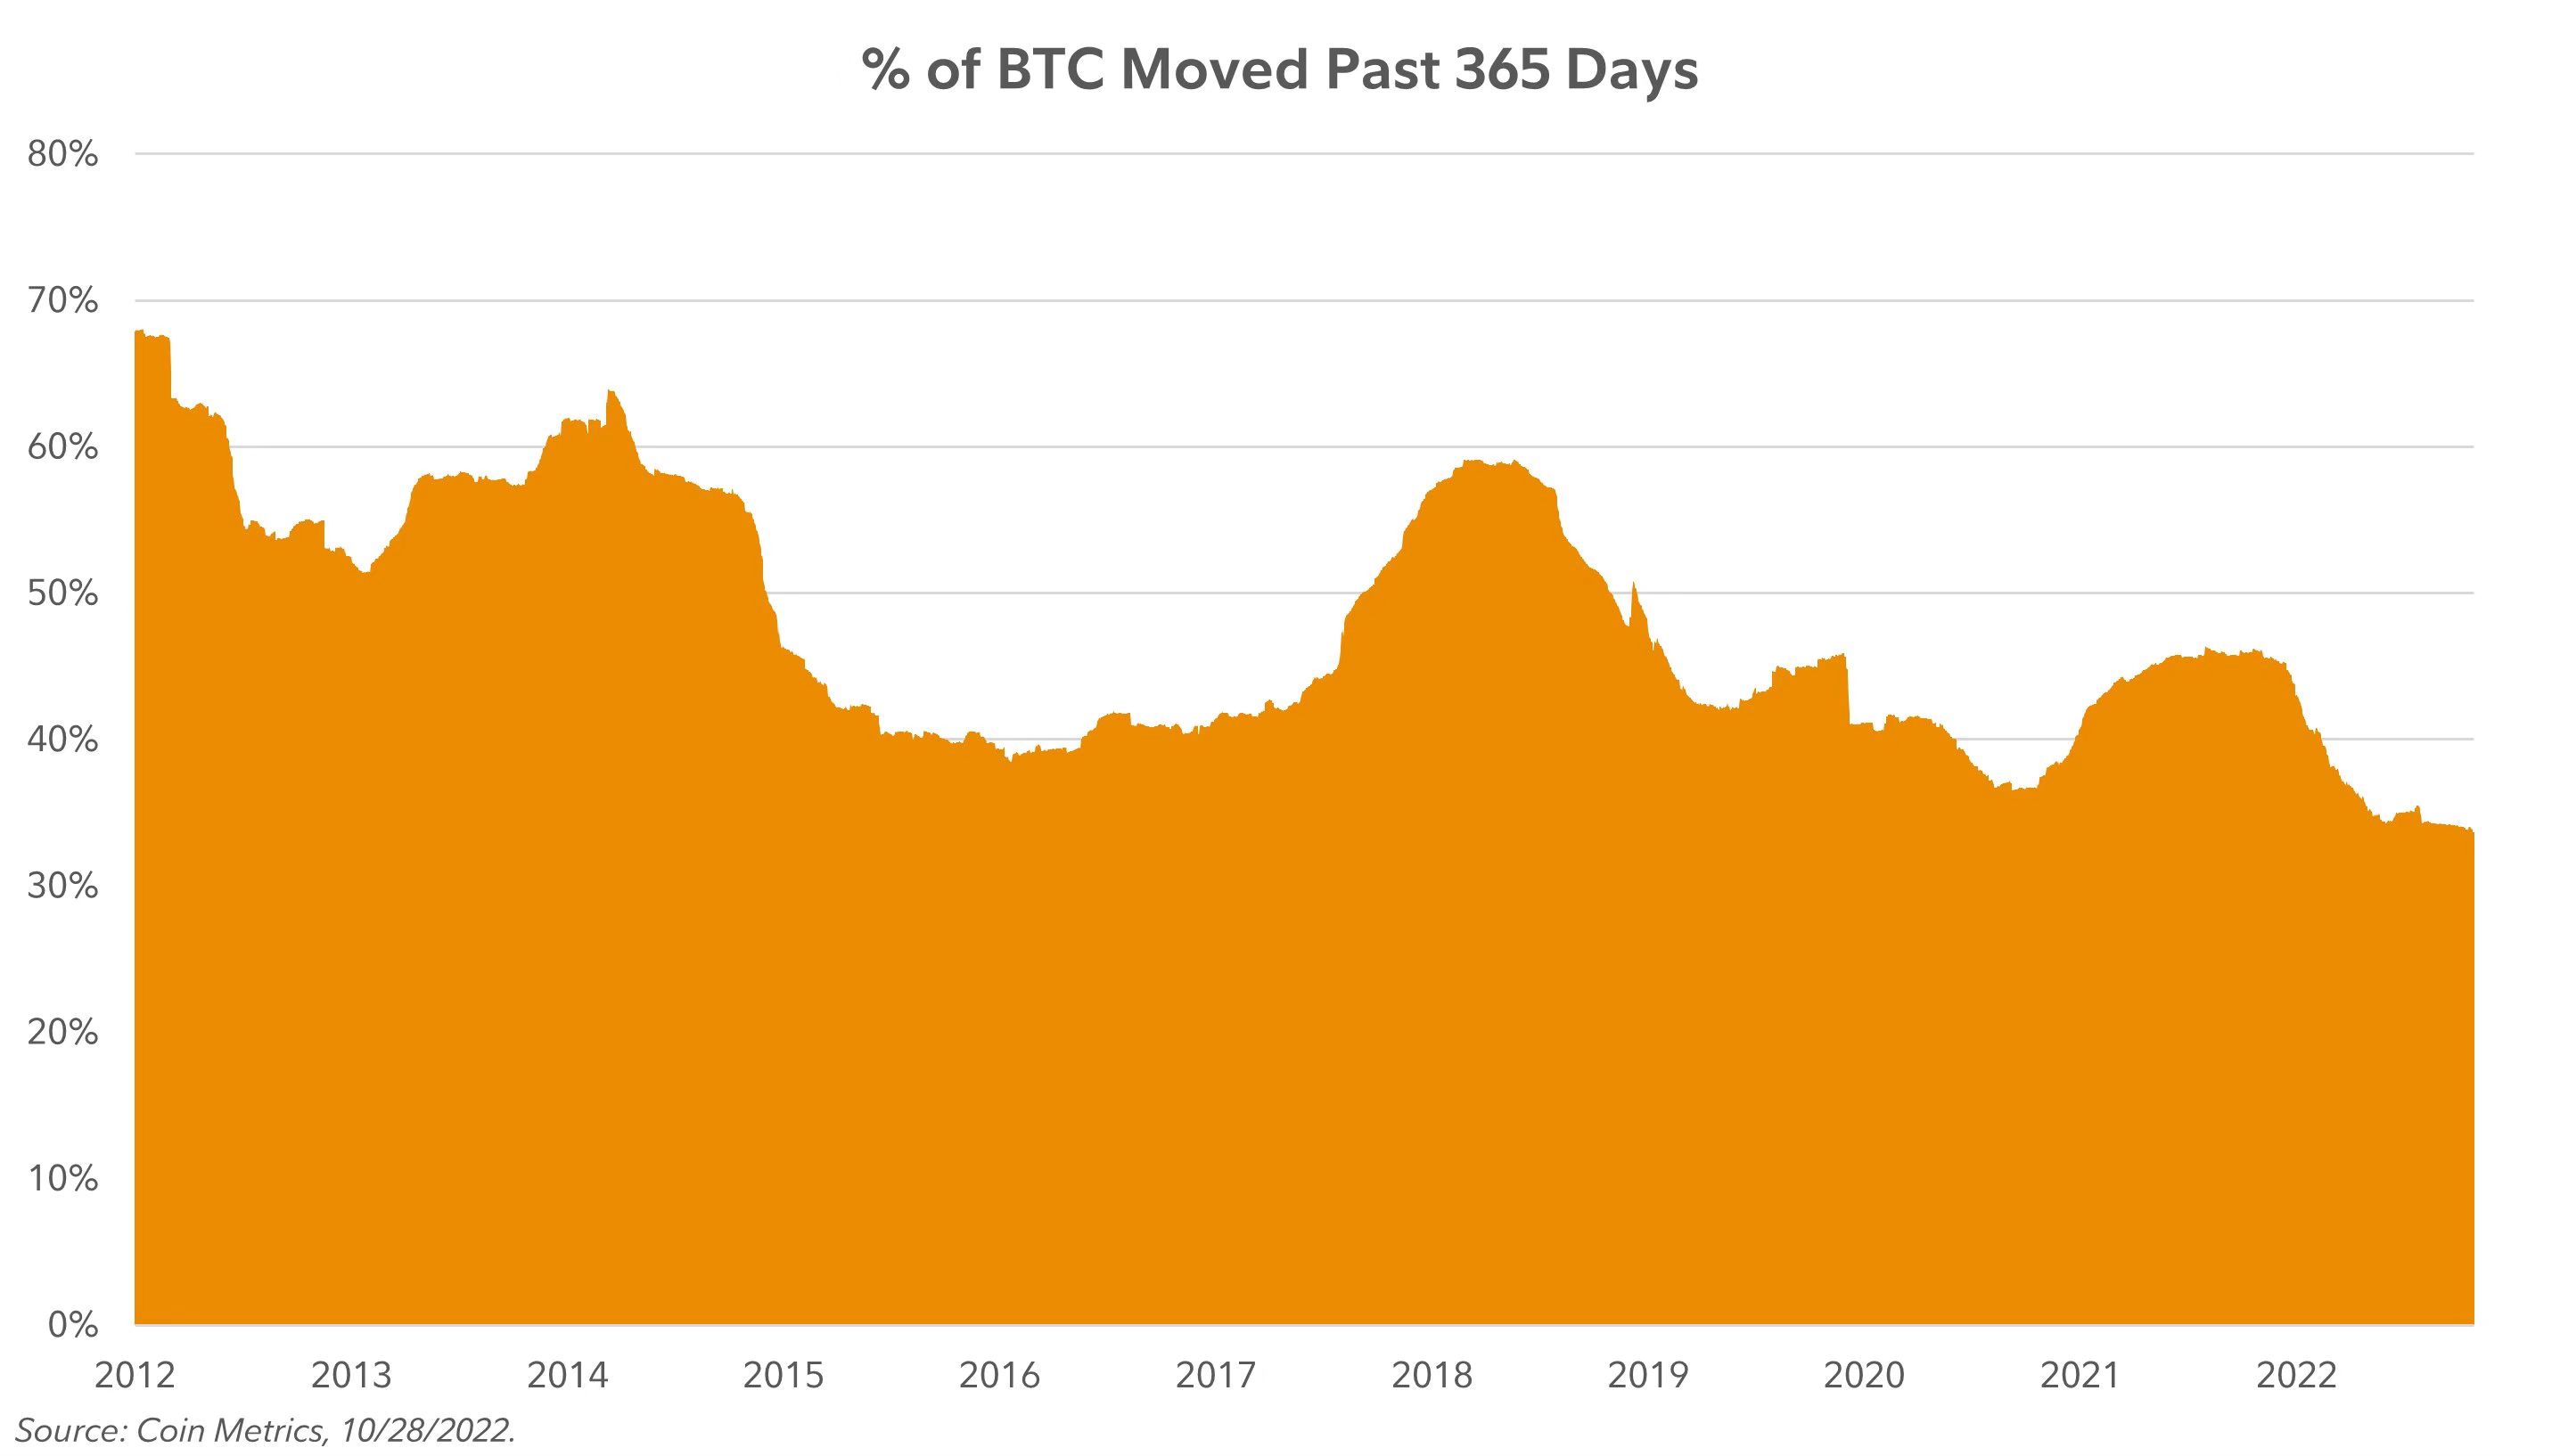
Bitcoin % supply last moved in past year chart. Source: Jack Neureuter/ TwitterSeparate data from on-chain analytics firm Glassnode meanwhile shows that the chances of a supply shock are rising.
Its Illiquid Supply Shock Ratio metric, which models the phenomenon, has been trending higher throughout 2022, and is currently at levels not seen since Bitcoin’s all-time high from the last halving cycle in 2017.
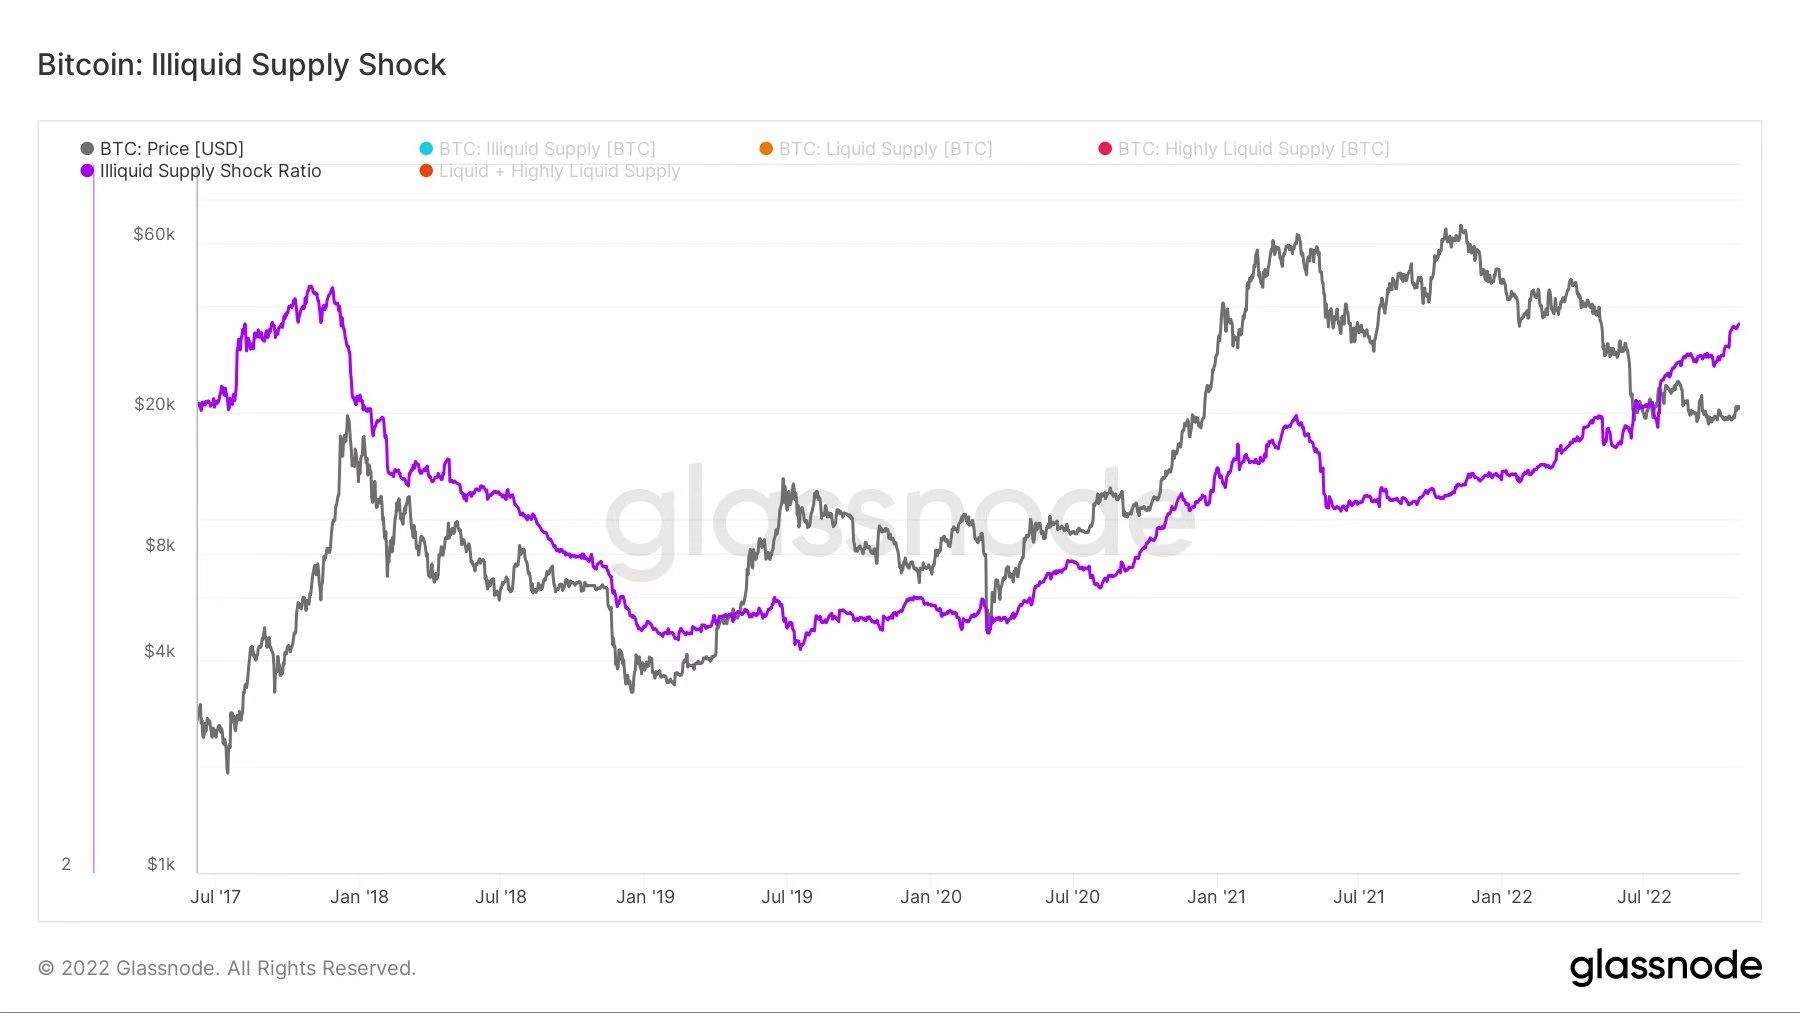
Bitcoin Illiquid Supply Shock chart. Source: GlassnodeSentiment hits six-week highs with price
Perhaps unsurprisingly, crypto market sentiment has improved thanks to last week’s price increases.
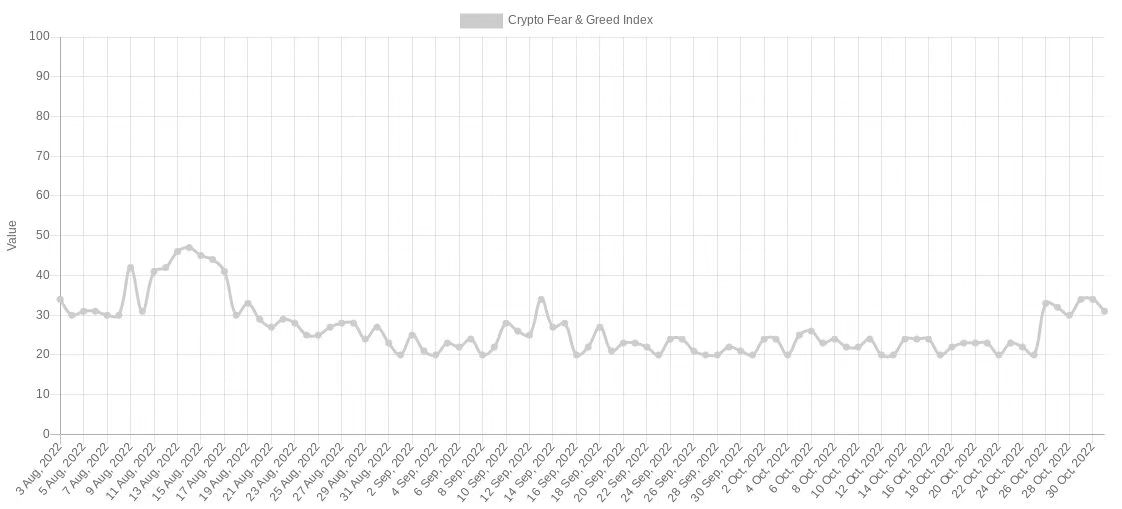
In a sign of how much — or little — it takes to flip sentiment around, the Crypto Fear & Greed Index hit its highest levels in six weeks over the weekend.
Fear & Greed uses a basket of factors to determine how bullish or bearish the mood in crypto is, and whether the market is due for a bounce or correction as a result.
At 34/100, sentiment even managed to escape the “extreme fear” zone, which has become commonplace in 2022.
Crypto Fear & Greed Index (screenshot). Source: Alternative.meMoreover, data from analytics firm Santiment suggested that long-term holders are planning to hodl through volatility.
“With Bitcoin back above $20.7k, traders appear to be content with long-term holding as coins continue moving away from exchanges,” it wrote in a tweet at the weekend.
Santiment additionally showed that the ratio of the BTC supply on exchanges was now at its lowest since 2018 — the year of the last macro bear market bottom.
“With the ratio of $BTC on exchanges down to 8.3%, it's the lowest seen in 4 years. October has been a big outflow month,” the post stated.
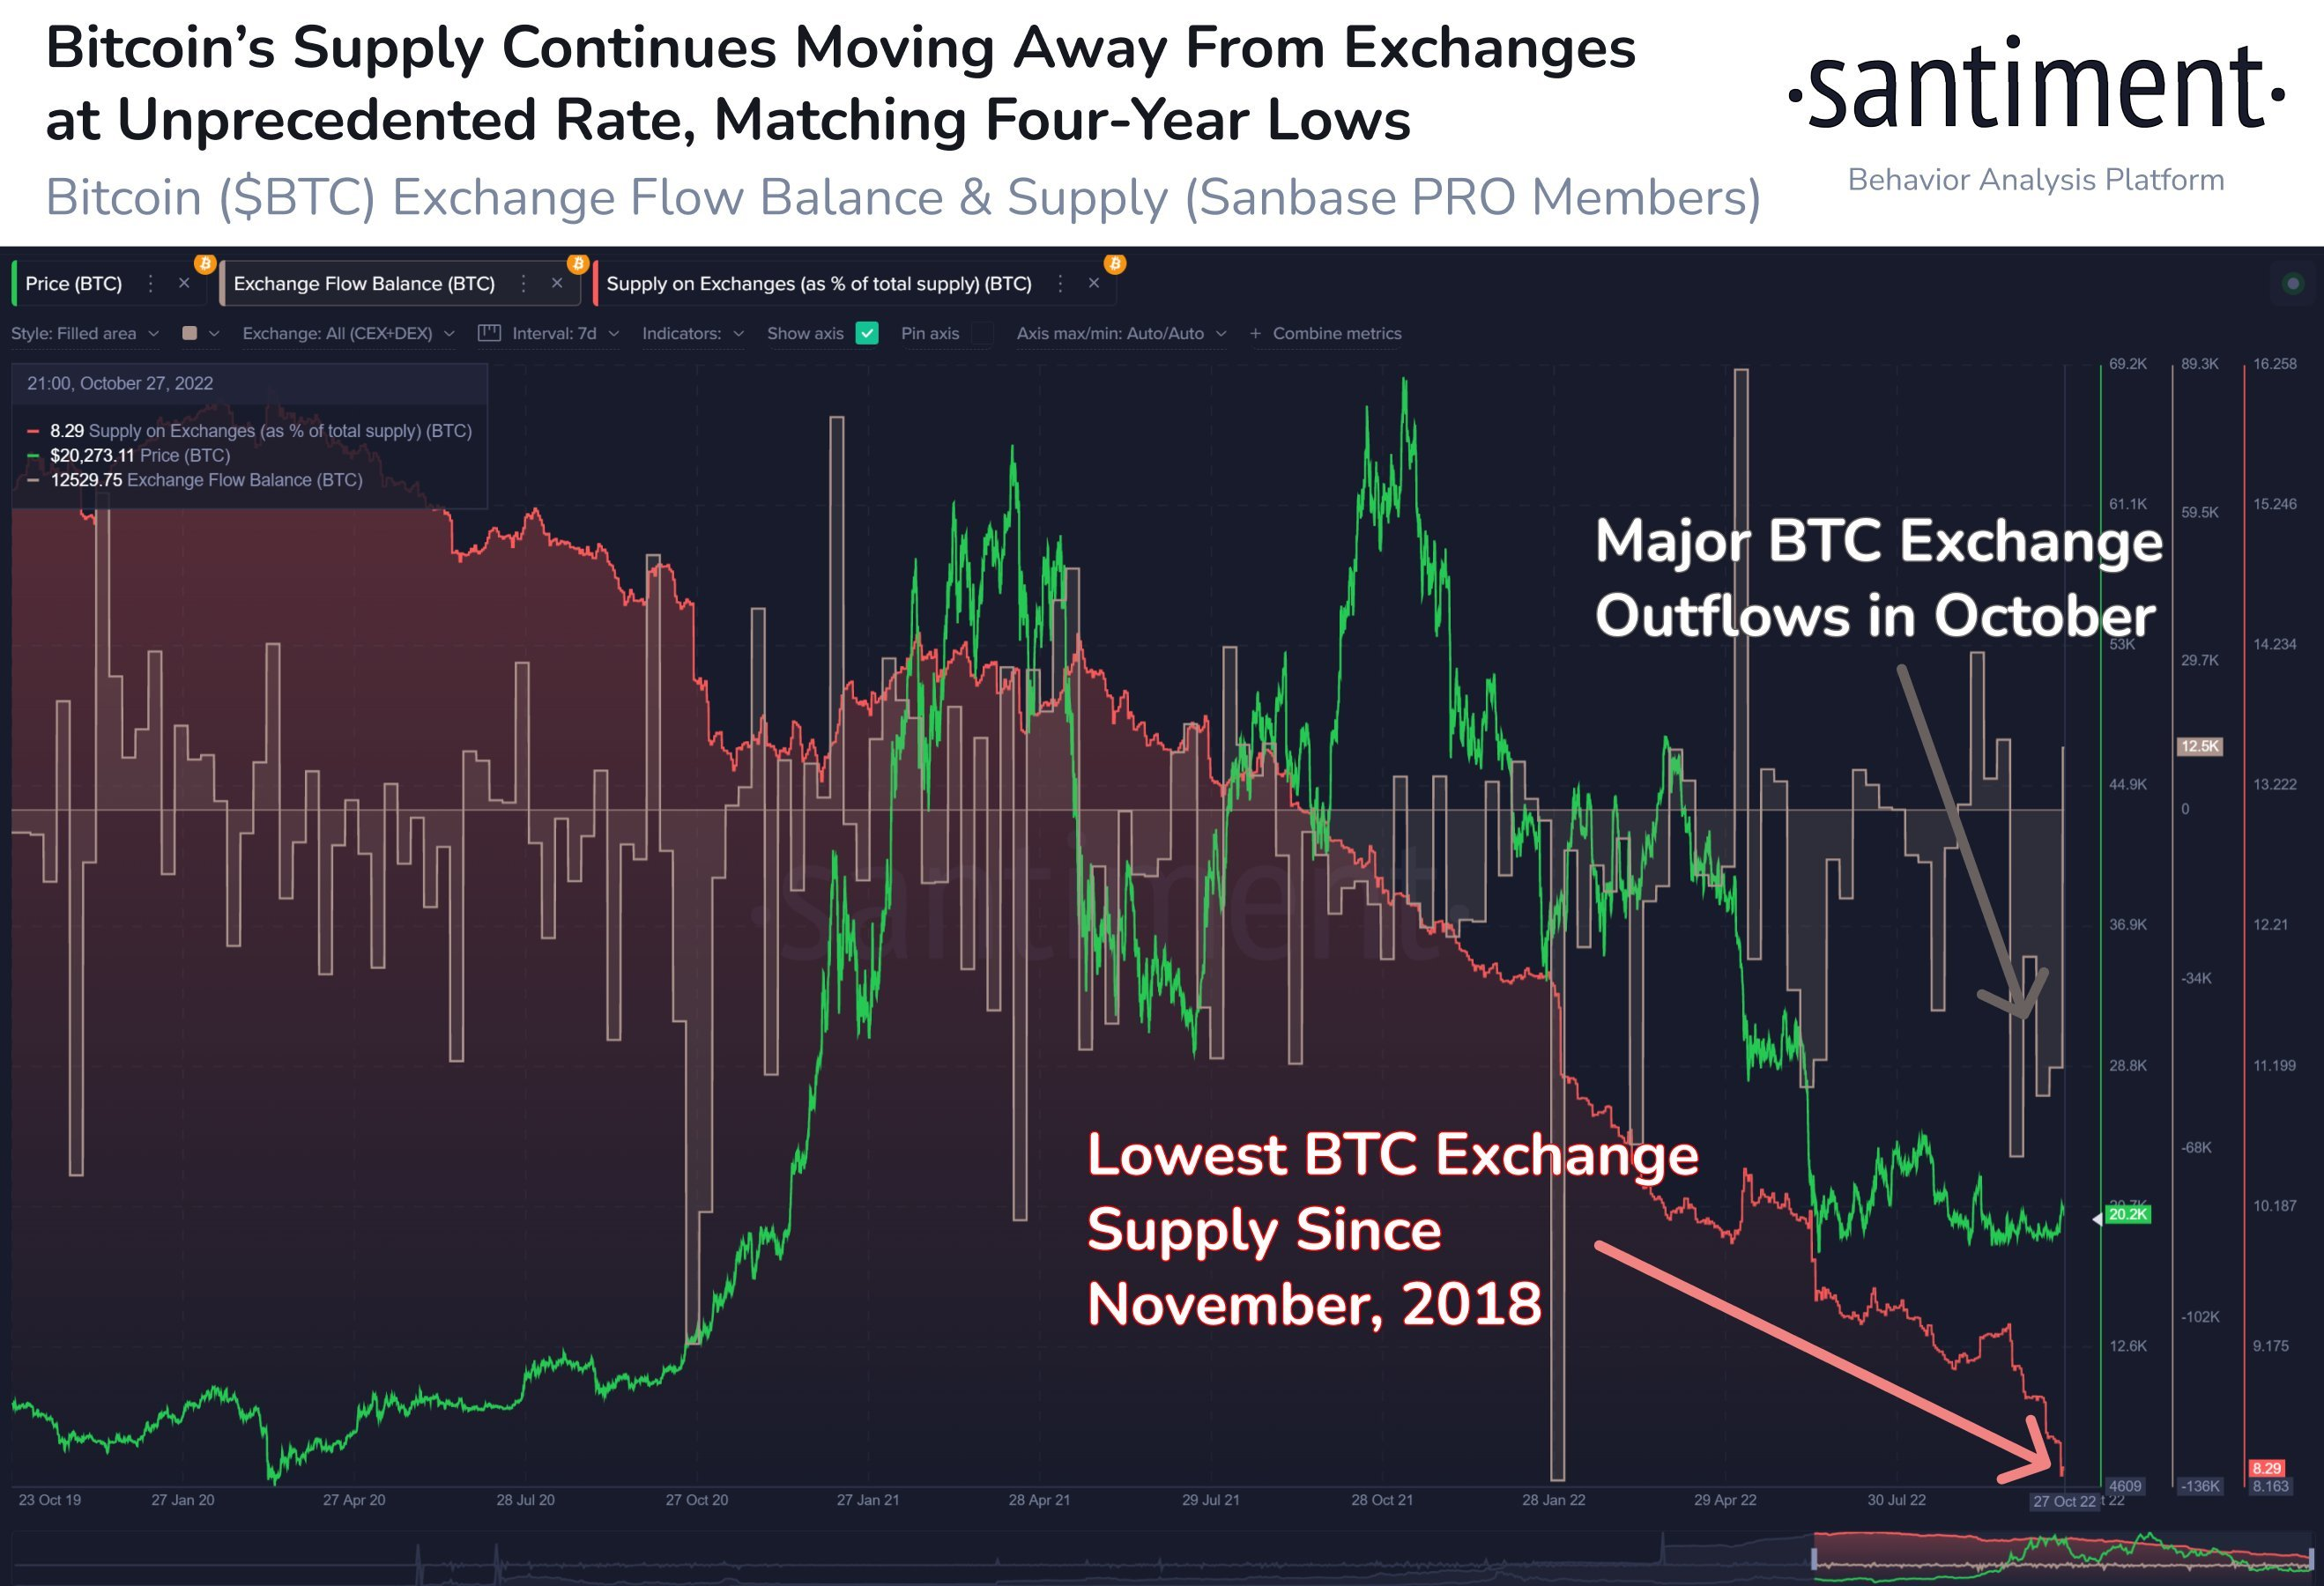
Bitcoin exchange supply annotated chart. Source: Santiment/ TwitterThe views and opinions expressed here are solely those of the author and do not necessarily reflect the views of Cointelegraph.com. Every investment and trading move involves risk, you should conduct your own research when making a decision.