Bitcoin Volatility Unchanged Amid Dominant Downtrend; HYPE Faces Repeated Tests at Critical Trendline | Guest Analysis

Odaily星球日报Xuất bản vào 2026-07-13Cập nhật gần nhất vào 2026-07-13

Tóm tắt

This weekly market analysis updates the outlook for Bitcoin (BTC) and HYPE based on recent price action, largely confirming prior predictions. **Bitcoin (BTC) Analysis:** The report maintains that BTC is in a downtrend but currently within a corrective rebound phase that began from the July 1st low of $57,820. This rebound has reached a key resistance near $64,700. The daily chart shows a developing "descending central zone," suggesting a shift into a consolidation/range-bound phase. The 4-hour chart indicates the rebound may be completing, with proprietary models showing potential short-term topping signals near the current levels. **BTC Trading Strategy (July 13-19):** * **Key Levels:** Resistance is at $64,700, $65,700-$67,300, and $69,500-$71,000. Support lies at $60,950-$62,000, $57,820, and $55,000. * **Mid-term:** The overall structure is bearish. Hold ~20% short positions. Consider increasing shorts to 50% if price rallies to the $65,700-$67,300 zone and shows weakness. * **Short-term:** Use 30% capital for tactical trades. Three scenarios are outlined: 1. **A (Buying Dip):** Consider buying if price drops to $60,950-$62,000 support and shows signs of stabilization. 2. **B (Selling Rally):** Consider shorting if price rallies to the $65,700-$67,300 resistance zone with confirming signals. 3. **C (Buying Higher Low):** Consider buying if, after a breakout above $65,700, a pullback finds support above $57,820. **HYPE Analysis:** HYPE performed as...

In last week's report, based on Bitcoin's daily chart structure, we clearly stated the core judgment that "the oversold rebound phase has begun, and the rebound height will determine the subsequent market direction". We also issued a warning for HYPE, indicating a "significantly high probability of adjustment near the Endpoint 61 (72.97 USD)". This week's market trajectory further validated the effectiveness of our analytical framework: Bitcoin completed the multi-stage rebound as expected and touched a key resistance level, while HYPE met resistance and fell back around 72.97 USD as anticipated, with a maximum drop of 9.39%.

Building upon this, this week's report will provide a detailed breakdown of the potential price paths and specific trading strategies for BTC and HYPE, combining the latest 4-hour and daily chart structures with signals from our proprietary quantitative models.

Summary of This Week's Core Trading Views:

• BTC Multi-timeframe Structure Analysis (Details in Part 1)

• BTC Price Forecast and Mid/Short-term Trading Strategies This Week (Details in Part 2)

• HYPE Hourly Structure Analysis (Details in Part 3)

• HYPE Price Forecast and Short-term Trading Strategies This Week (Details in Part 4)

Market Validation of Last Week's Trading Strategies and Core Views:

• Validation of BTC Forecast: Last week's article clearly stated that Bitcoin had entered a daily-level oversold rebound phase, emphasizing that the height of this rebound would determine the market's subsequent direction. The current market trajectory is developing in line with our prediction.

• Validation of HYPE Forecast: Last week's article indicated a significant probability of HYPE undergoing adjustment near "Endpoint 61" (72.97 USD). Currently, market movements are highly consistent with our judgment.

Part 1: Bitcoin's Structure Analysis from Last Week

1. Bitcoin Daily Chart Structure Analysis: (Based on price action post-May 6th)

Bitcoin Daily Candlestick Chart
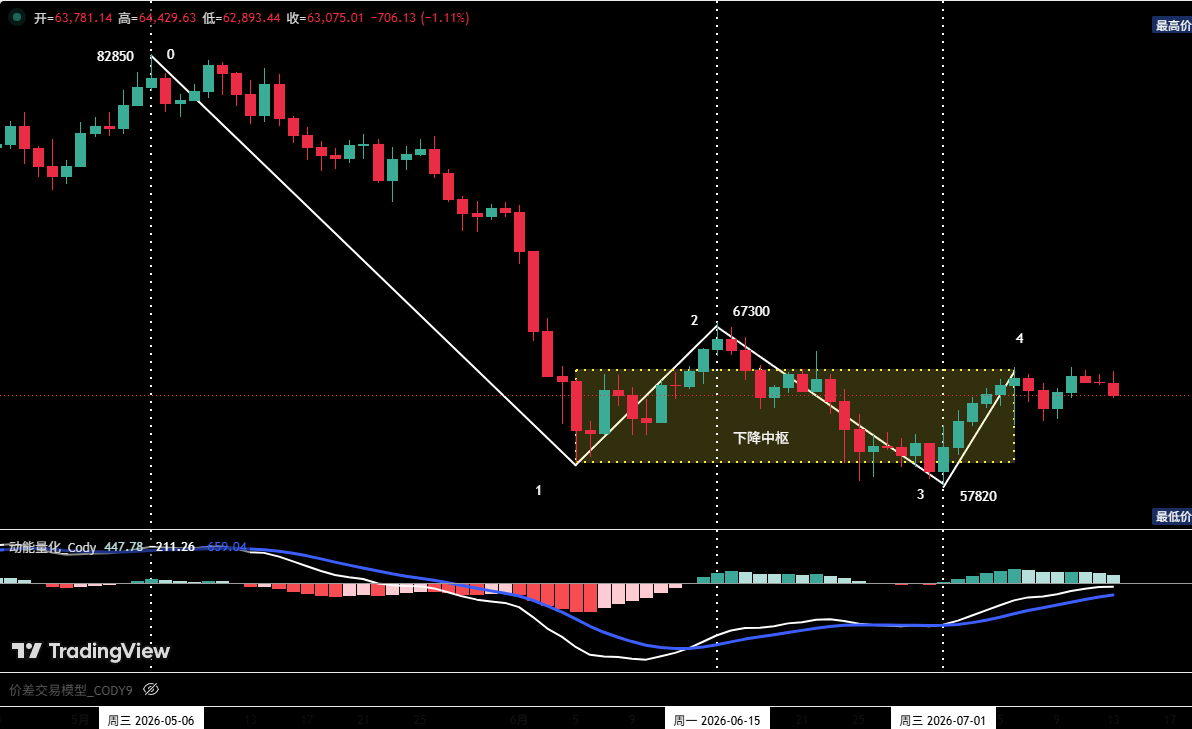
Figure 1

1. As shown in (Figure 1): The corrective move initiated from the May 6th high of $82,850 has presented a four-segment adjustment structure on the daily chart: segments (0-1), (1-2), (2-3), and (3-4).

2. Since touching the low of $57,820 on July 1st, the market is currently developing the rebound segment (3-4), and the price has already broken through the $64,500 resistance level. Last week's commentary explicitly stated: If this rebound first breaks the $64,500 resistance, and then (preferably) breaks the $65,700 resistance, the probability significantly increases for a subsequent stabilization and rebound above the low of $57,820 once the (3-4) rebound segment concludes and corrects.

3. On the daily timeframe, the price overlap across segments (1-2), (2-3), and (3-4) has preliminarily formed a "descending consolidation zone" (as shown in the chart). Based on the above analysis, the market is highly likely to enter a "zone extension" phase next, meaning this "zone" will be composed of five or even more overlapping segments. This signals a short-term market entry into a volatile, range-bound consolidation pattern.

2. In-depth Bitcoin Hourly Structure Analysis: (Using 4-hour as the analysis cycle)

Bitcoin_4-hour Candlestick Chart
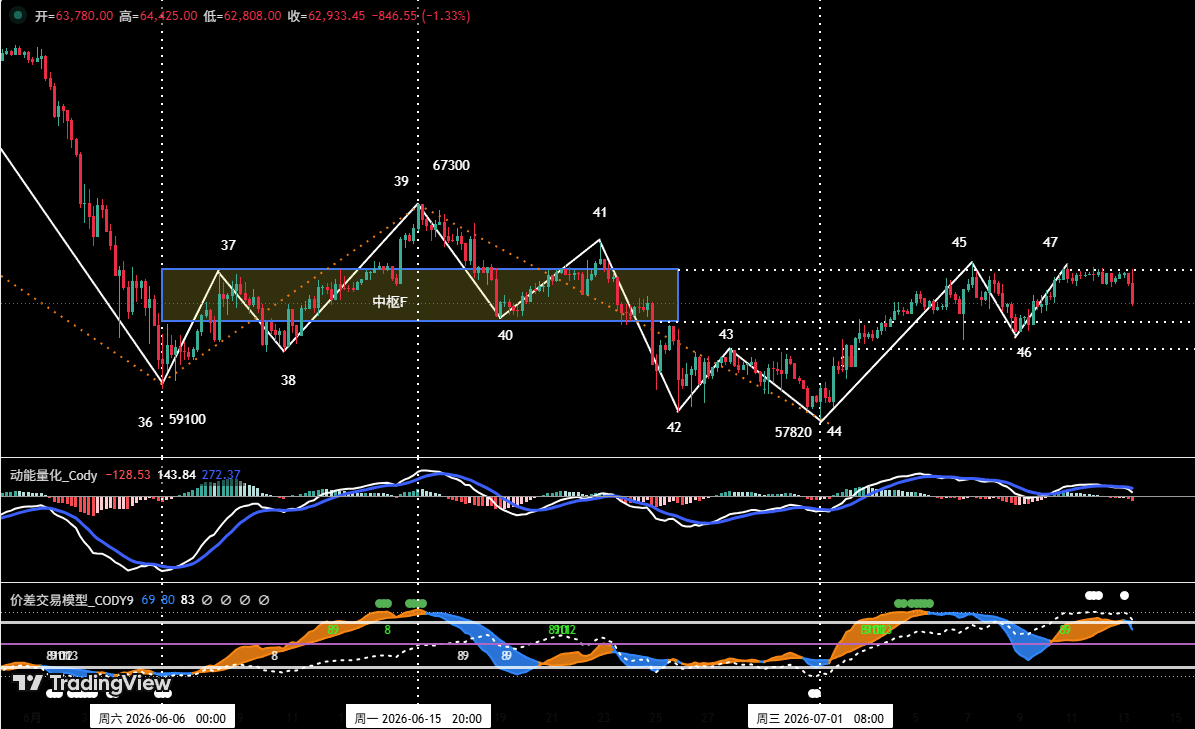
Figure 2

1. On the 4-hour chart, the rebound starting from the July 1st low of $57,820 clearly shows a three-segment structure: (44-45), (45-46), and (46-47).

2. Based on the current structure analysis, the price is in the midst of developing the (46-47) rebound segment. As the local high "Endpoint 47" was being formed, our proprietary "Momentum Quantitative Model" showed a clear bearish divergence signal, and the "Price Difference Trading Model" touched a top warning signal (white dot). Therefore, the probability of a technical correction at the hourly level here is extremely high. If the price corrects as expected, watch for support effectiveness near "Endpoint 46". If signs of stabilization appear around this level, a subsequent rebound will likely occur, with the primary upside target initially being $65,700; if rebound momentum is strong, the next important target is $67,300.

Part 2: Bitcoin Price Forecast and Trading Strategies for This Week (07.13~07.19)

1. BTC Price Forecast for This Week:

This Week's Core View: Focus closely on the price's performance around the key resistance level of $64,700. If a correction occurs as expected, closely observe the effectiveness of support when it falls back near $61,500. Stabilization signals at this level will determine whether the subsequent rebound can continue.

2. Core Resistance Levels:

• First Resistance Zone: $64,700 area (upper bound of previous consolidation zone)

• Second Resistance Zone: $65,700~$67,300 area (previous significant resistance area)

• Third Resistance Zone: $69,500~$71,000 area (previous significant resistance area)

3. Core Support Levels:

• First Support Zone: $60,950~$62,000 area (previous important support area)

• Second Support Level: Near $57,820 (previous important support level)

• Third Support Level: Near $55,000 (previous important support level)

4. Trading Strategies for This Week (Excluding the Impact of Sudden News):

1. Mid-term Strategy: Bitcoin_Daily Candlestick Chart: (Position Monitoring Model)
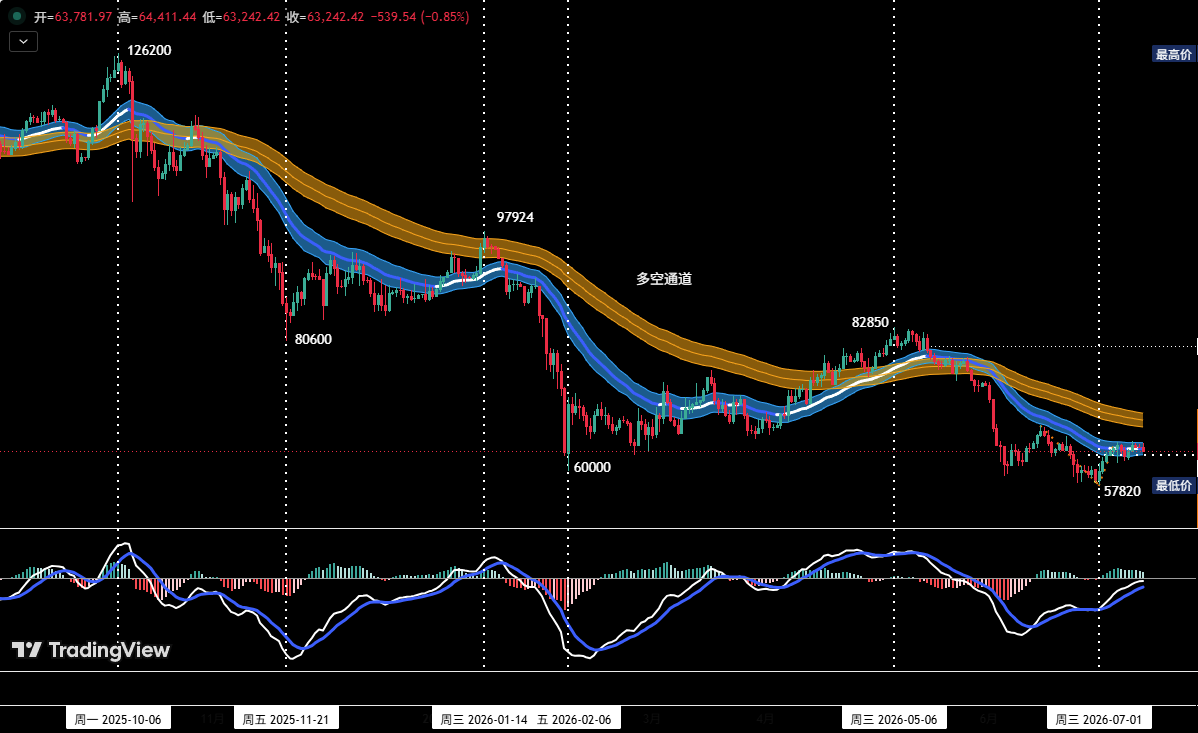
Figure 3

Position Monitoring Model: As shown in (Figure 3), the current price has effectively broken below the "Bull-Bear Channel", confirming a shift to a bear-dominated market structure.

• Current mid-term short positions should be maintained at around 20% for now.

• If the price rebounds to the $65,700~$67,300 area and shows signs of stagnation, combined with top signals from our proprietary quantitative models, consider increasing mid-term short positions to within 50%.

2. Short-term Strategy: Use 30% of capital, set stop-loss points, and look for "price difference" opportunities based on support and resistance levels. (Use 30-minute/60-minute charts as the operation cycle).

3. For short-term operations, to dynamically respond to the market's complex evolution, we have pre-determined three specific contingency plans: A/B/C.

• Plan A: Tentatively go long if support in the $60,950~$62,000 area holds. • Entry: If the price corrects from near $64,700 and, upon falling to the $60,950~$62,000 area, shows signs of stabilization combined with bottom signals from quantitative models, aggressive investors can establish a long position of about 15%. • Risk Control: Set an initial stop-loss. • Exit: Gradually close the position for profit when the price reaches important resistance levels combined with model signals.

• Plan B: Tentatively go short near strong resistance zones. • Entry: If the price rebounds and meets resistance in the $65,700~$67,300 area, combined with top signals from quantitative models, establish a short position of about 30%. • Risk Control: Set an initial stop-loss. • Exit: Gradually close the position for profit when the price adjusts to important support levels combined with model signals.

• Plan C: Lightly test long near strong support zones. • Entry: After the price breaks above $65,700 and then corrects, if signs of stabilization appear above the previous low of $57,820, combined with bottom signals from quantitative models, establish a long position of about 30%. • Risk Control: Set an initial stop-loss. • Exit: Gradually close the position for profit when the price rebounds to important resistance levels combined with model signals.

Part 3: HYPE Hourly Structure Analysis

HYPE_4-hour Candlestick Chart
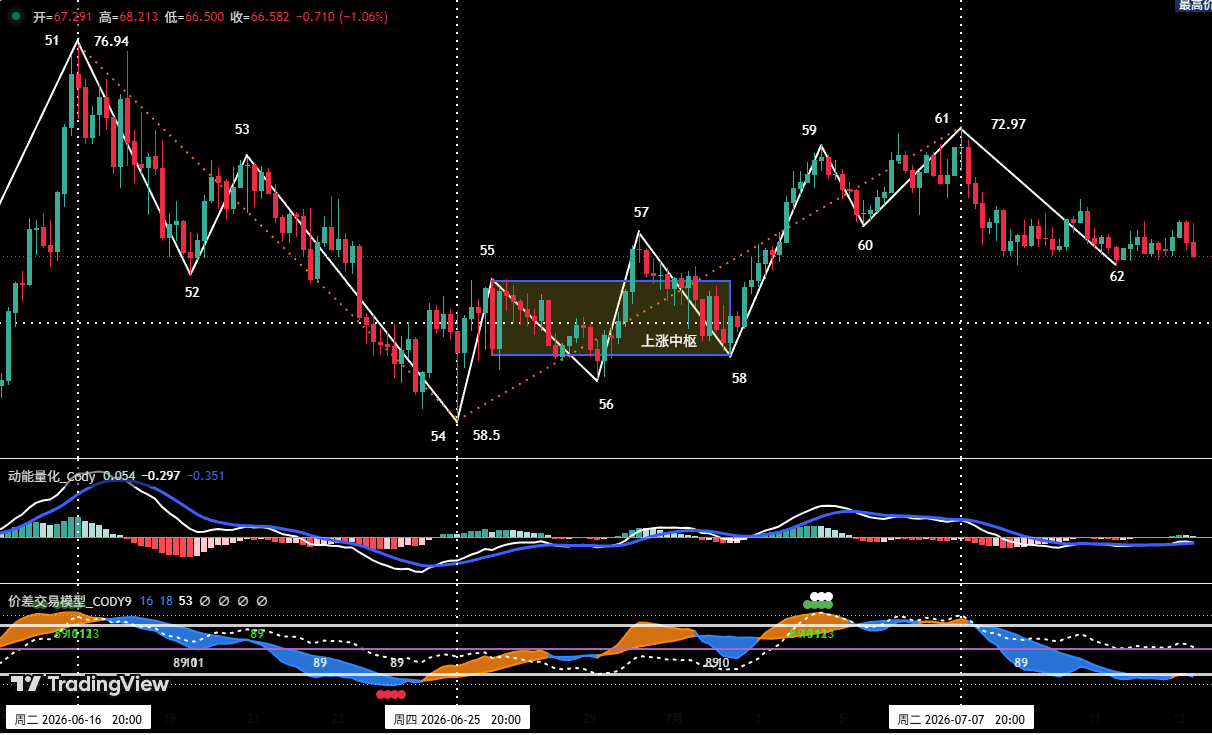
Figure 4

1. As shown in (Figure 4), from the June 25th low of $58.5 (Endpoint 54) to the July 7th high of $72.97 (Endpoint 61), HYPE's move on the 4-hour cycle can be subdivided into a seven-segment upward structure. Among them, segments 55-56, 56-57, and 57-58 overlap to form an "ascending consolidation zone".

2. Last week's commentary pointed out: Since a complete seven-segment upward structure has run from "Endpoint 54 to Endpoint 61", and top warning signals were triggered at "Endpoint 59" and "Endpoint 61" respectively, be alert to short-term adjustment risks. Last week, the market met resistance and began adjusting around $72.97 as expected. During the development of the (61-62) correction segment, the maximum decline was approximately 9.39%.

3. Based on the 4-hour chart analysis, the price is currently developing the (61-62) correction segment. The current "Endpoint 62" has already broken below the previous low "Endpoint 60" ($68.16), which preliminarily damages the structure that has been rising since "Endpoint 54".

Part 4: HYPE Price Forecast and Short-term Trading Strategies This Week

1. HYPE Price Forecast for This Week:

1. Core Resistance Levels:

• First Resistance Level: $68~$69.5 area

• Second Resistance Level: Near $72.97

• Third Resistance Level: Near $76.94

2. Core Support Levels:

• First Support Level: Near $65.5

• Second Support Zone: $60.5~$61.5 area

This Week's Core View on HYPE: Focus on where the current correction "Endpoint 62" concludes, and whether the subsequent rebound height can break through the $72.97 resistance.

2. HYPE Short-term Trading Strategies for This Week: This Week's Short-term Operations: Strategy One: If, after the (61-62) correction segment ends, the price rebounds and breaks the $72.97 resistance—since it would be approaching the strong resistance area of the historical high at $76.94—it is recommended to remain观望 (unallocated/cash).

Strategy Two: Conversely, if after the (61-62) correction segment ends, the price rebound fails to reach $72.97, it is recommended to establish short positions on rallies. Operationally, strict stop-losses must be set, with position size controlled within 30%.

Part 5: Special Reminders:

  1. Upon Entry: Immediately set an initial stop-loss.
  2. When Profit Reaches 1%: Move the stop-loss to the entry cost (breakeven point) to ensure capital safety.
  3. When Profit Reaches 2%: Move the stop-loss to the 1% profit level.
  4. Continuous Tracking: Thereafter, for every additional 1% profit, move the stop-loss up by 1%, dynamically protecting and locking in profits.

Financial markets change rapidly, and all market analysis and trading strategies require dynamic adjustment. All views, analytical models, and operational strategies involved in this article are derived from personal technical analysis, intended solely for personal trading log purposes, and do not constitute any investment advice or operational basis. The market carries risks, investing requires caution. Please do not make decisions based on this content.


Tiền kỹ thuật số thịnh hành

Câu hỏi Liên quan

QAccording to the article, what is the key price level (in USD) where Bitcoin's rebound met resistance and triggered a technical adjustment?

AThe key resistance level where Bitcoin's rebound met resistance was around 64,700 USD. At this point, the self-built 'momentum quantitative model' showed a clear top divergence signal and the 'price difference trading model' triggered a top warning signal, indicating a high probability of a technical adjustment.

QWhat are the three core operational plans (A, B, C) for Bitcoin's short-term trading strategy outlined in the article?

AThe three short-term Bitcoin trading plans are: Plan A: Test buying (go long) if price finds support in the 60,950-62,000 USD zone. Plan B: Test selling (go short) if price encounters resistance in the 65,700-67,300 USD zone. Plan C: Lightly test buying (go long) if price retreats but finds support above the previous low of 57,820 USD after breaking above 65,700 USD.

QFor HYPE, what was the specific price point (referred to as 'endpoint 61') where it encountered resistance and began a correction last week?

AFor HYPE, the specific price point where it encountered resistance and began a correction was at 72.97 USD, which is referred to as 'endpoint 61' in the analysis.

QWhat is the article's overall medium-term (mid-line) stance on Bitcoin's market structure based on the 'Position Monitoring Model'?

AThe article's medium-term stance on Bitcoin, based on the 'Position Monitoring Model', is bearish. The model shows that the price has effectively broken below the 'Bull-Bear Channel', confirming a market structure shift to one dominated by a downtrend. It recommends maintaining a medium-term short position of around 20%.

QWhat is the critical condition for considering to establish a short position in HYPE according to the weekly strategy?

AThe critical condition for considering a short position in HYPE is if, after the (61-62) correction segment ends, the price rebounds but fails to reach the 72.97 USD resistance level. In this scenario, the strategy suggests establishing a short position on rallies, with strict stop-loss and position control within 30%.

Nội dung Liên quan

Thanh toán bằng tiền mã hóa cho peptide thị trường xám tăng 700% trong một năm – Chi tiết

Theo tiết lộ gần đây, Hoa Kỳ đang chứng kiến sự gia tăng đáng kể trong việc sử dụng tiền điện tử, chủ yếu là Bitcoin (BTC) và stablecoin, để mua các peptide thị trường xám. Các peptide này thường được quảng cáo với công dụng chống lão hóa, tăng cơ, giảm cân và kéo dài tuổi thọ, nhưng tồn tại trong khu vực pháp lý mờ ám. Do các ngân hàng và mạng lưới thẻ tín dụng siết chặt hạn chế giao dịch, nhiều nhà cung cấp, đặc biệt từ Trung Quốc, đã chuyển sang chỉ chấp nhận thanh toán bằng tiền điện tử. Điều này thu hút cả những người tiêu dùng chính thống quan tâm đến sức khỏe, vì giá rẻ hơn và dễ tiếp cận hơn, dù họ có thể chưa từng sở hữu Bitcoin trước đây. Số liệu từ Chainalysis cho thấy, trong quý I/2026, các nhà bán lẻ peptide thị trường xám đã nhận được 32 triệu USD tiền điện tử, tăng 700% so với năm trước và đưa thị trường này vào quỹ đạo hơn 100 triệu USD mỗi năm. TRM Labs cũng ghi nhận xu hướng tương tự, với dòng tiền điện tử vào các nhà sản xuất hóa chất Trung Quốc bán peptide đạt 41,4 triệu USD trong năm 2025. Các chuyên gia nhận định đây là thị trường có nhiều người mua lần đầu sử dụng tiền điện tử, khác với thời kỳ chợ đen Silk Road. Sự bùng nổ này diễn ra song song với việc tổng khối lượng giao dịch tiền điện tử toàn cầu trong quý I/2026 giảm 23% so với quý trước, cho thấy một xu hướng sử dụng cụ thể đang nổi lên bên cạnh hoạt động đầu tư tổng thể.

ambcrypto19 phút trước

Thanh toán bằng tiền mã hóa cho peptide thị trường xám tăng 700% trong một năm – Chi tiết

ambcrypto19 phút trước

human.tech Ra Mắt Clean SDK Cho Ứng Dụng Web3 Ưu Tiên Quyền Riêng Tư

human.tech đã ra mắt Clean SDK, một bộ công cụ phát triển phần mềm cho phép các nhà phát triển xây dựng ứng dụng Web3 ưu tiên quyền riêng tư mặc định và có tính minh bạch, trách nhiệm giải trình. Bộ SDK này cung cấp các thành phần cơ bản để tích hợp xác minh danh tính bằng zero-knowledge (Bằng chứng Bàn tay Sạch), sàng lọc trừng phạt (Bằng chứng Vô tội) và xác minh con người (Bằng chứng Nhân thân) vào ứng dụng, mà không cần xử lý dữ liệu người dùng nhạy cảm. Shield, ứng dụng đầu tiên được xây dựng trên nền tảng này, là một cầu nối riêng tư đến Aztec, cho phép người dùng chuyển tài sản một cách ẩn danh trong khi vẫn chứng minh được tính hợp pháp và đã vượt qua kiểm tra trừng phạt. Clean SDK giải quyết thách thức lâu nay của Web3: cân bằng giữa quyền riêng tư và trách nhiệm giải trình, loại bỏ sự lựa chọn sai lầm giữa hai yếu tố này. Bộ công cụ hướng đến việc hỗ trợ một hệ sinh thái rộng lớn hơn các ứng dụng tài chính, tác nhân tự trị và dịch vụ phi tập trung, phản ánh nhu cầu ngày càng tăng về cơ sở hạ tầng cân bằng được tính minh bạch với quyền riêng tư.

TheNewsCrypto27 phút trước

human.tech Ra Mắt Clean SDK Cho Ứng Dụng Web3 Ưu Tiên Quyền Riêng Tư

TheNewsCrypto27 phút trước

Giải phóng 100 triệu USD thanh khoản? Chính sách mới của Pump.fun thử nghiệm chiến thuật 'pump' 5 phút

Tác giả: Ma Hạ, Foresight News Ngày 21/7, Pump.fun chính thức ra mắt chế độ BOOST và đặt nó làm cơ chế phát hành mặc định tiêu chuẩn cho token mới. Sau thông báo, giá PUMP vẫn dao động quanh mức 0,002 USD. Theo dữ liệu lịch sử, mỗi khi một token "tốt nghiệp" khỏi bonding curve và chuyển sang bể thanh khoản, khoảng 20% thanh khoản sẽ trở thành "thanh khoản chết" bị khóa vĩnh viễn, dù tất cả người nắm giữ bán ra. Ước tính cơ chế này gây lãng phí hơn 100 triệu USD thanh khoản mỗi năm. BOOST giải quyết vấn đề này: thay vì khóa vào LP, số tiền này (khoảng 20% giá trị) sẽ được dùng để mua lại chính token đó trong 5 phút đầu sau khi di chuyển, thông qua cơ chế TWAP (giá trung bình theo thời gian), và ngay lập tức đốt toàn bộ token mua được. Hành động này tạo áp lực mua ngắn hạn và giảm vĩnh viễn nguồn cung lưu hành. Cơ chế tự động áp dụng cho token di chuyển sau 22:23 ngày 21/7 (giờ Bắc Kinh). Mục tiêu của BOOST là cải thiện trải nghiệm giao dịch ngay sau khi token lên sàn, tạo "pháo hoa" 5 phút để thu hút trader và tăng tỷ lệ token tạo ra khối lượng giao dịch bền vững, từ đó củng cố doanh thu nền tảng. Tuy nhiên, một số lo ngại cho rằng cơ chế này có thể làm giảm độ khó thực tế khi launch dự án, khiến nhiều token chất lượng thấp dễ "thành công giả tạo" hơn, và làm tăng rủi ro sụp đổ giá mạnh sau khi áp lực mua 5 phút kết thúc.

marsbit34 phút trước

Giải phóng 100 triệu USD thanh khoản? Chính sách mới của Pump.fun thử nghiệm chiến thuật 'pump' 5 phút

marsbit34 phút trước

Kinh doanh không gian khối đã chết: Các blockchain công khai phải tìm ra hướng đi mới

Tác giả: Castle Labs Biên dịch: Deep Tide TechFlow Trong hai năm qua, chỉ có một blockchain công khai (Hyperliquid) nằm trong số 14 công ty tiền mã hóa có doanh thu hàng năm trên 200 triệu USD. Khoảng cách là rất lớn: Doanh thu 30 ngày của Arbitrum chỉ là 430 nghìn USD, trong khi Hyperliquid đạt khoảng 58 triệu USD (gấp hơn 100 lần). Điều này cho thấy mô hình kinh doanh dựa trên việc "bán không gian khối" đã lỗi thời. Các blockchain cần tìm hướng đi mới: hoặc chuyển đổi thành studio sản phẩm, nhà phân phối ứng dụng, hoặc tập trung vào các ngành dọc cụ thể như một nhà cung cấp SaaS. Thời đại của cơ sở hạ tầng trung lập đang kết thúc. Bài viết cũng thảo luận về vụ tấn công vào kho bạc LP của Ostium, gây thiệt hại hơn 40% TVL, nguyên nhân do kẻ tấn công đưa giá ảo vào hệ thống định giá ngoài chuỗi. Sự cố này nhấn mạnh rủi ro và nhu cầu về các biện pháp kiểm soát chặt chẽ hơn đối với các giao thức tích hợp thị trường truyền thống vào chuỗi. Một chủ đề khác là tương lai của quyền chọn trên chuỗi. Các chuyên gia cho rằng để đạt được sự chấp nhận rộng rãi, quyền chọn cần được "trừu tượng hóa" – không được bán dưới dạng sản phẩm phức tạp với các thuật ngữ Hy Lạp, mà nên đóng gói lợi nhuận thành các sản phẩm dễ hiểu hơn như kho bạc tạo thu nhập, quyền chọn nhị phân ngắn hạn, sản phẩm có cấu trúc hoặc thị trường dự đoán. Lợi ích của quyền chọn mới là sản phẩm thực sự. Cuối cùng, bài viết điểm qua một số dự án đáng chú ý như Flex của Yearn (thị trường vay với lãi suất cố định), những thay đổi trong chiến lược của Base, Plether (hợp đồng vĩnh viễn chỉ số USD trên chuỗi) và trọng tâm an ninh của Starknet về quyền riêng tư và khả năng chống lại các mối đe dọa lượng tử.

marsbit54 phút trước

Kinh doanh không gian khối đã chết: Các blockchain công khai phải tìm ra hướng đi mới

marsbit54 phút trước

Ghi chú podcast | Trò chuyện với Giám đốc quản lý tài sản của GSR: Đợt tăng giá tiền mã hóa này là thật hay giả, hãy theo dõi lãi suất cho vay trên Aave là biết ngay

**Tóm tắt podcast với Andy Baehr (GSR): Cách phân biệt đợt tăng giá thật hay giả trong crypto** Andy Baehr, Giám đốc điều hành Quản lý tài sản tại GSR, chia sẻ quan điểm về thị trường crypto hiện tại thông qua khung lý thuyết "dao động" (ambivalence) và "niềm tin vững chắc" (conviction). Ông cho rằng thị trường đang mắc kẹt ở trạng thái dao động, với các đợt phục hồi giống như tên lửa một tầng, thiếu sức bền. Ông đề xuất ba tín hiệu cần theo dõi: 1. **Lãi suất cho vay trên DeFi, đặc biệt trên Aave:** Lãi suất cho vay USDC hiện chỉ khoảng 3.75%, gần bằng lợi suất trái phiếu kho bạc Mỹ, phản ánh nhu cầu đòn bẩy thấp và thiếu năng lượng thị trường thực sự. Một đợt tăng giá bền vững cần lãi suất này tăng vọt do nhu cầu vay tăng cao. 2. **Sự đồng thuận về "đỉnh diều hâu" của Cục Dự trữ Liên bang Mỹ (Fed):** Thị trường cần xác định rõ điểm kết thúc của chu kỳ thắt chặt chính sách tiền tệ ("Ngày chí của Fed") để có thể tin tưởng vào một xu hướng tăng bền vững. 3. **Khả năng thông qua Đạo luật CLARITY:** Dự luật này, hiện có xác suất thông qua dưới 40% trên Polymarket, có thể trở thành một yếu tố bất ngờ thúc đẩy thị trường nếu được thông qua. Baehr cũng chỉ ra các yếu tố cản trở đà tăng: dòng tiền ETF không ổn định, các công ty kho bạc (DAT) như Strategy chưa mua vào, và sự thu hút vốn sang các cơ hội khác như IPO SpaceX hay cổ phiếu AI. Tóm lại, theo Baehr, để xác nhận một đợt tăng giá thực sự, nhà đầu tư nên theo dõi chặt chẽ lãi suất cho vay trên Aave như một thước đo trực tiếp về nhu cầu đòn bẩy và sức khỏe tổng thể của thị trường crypto.

marsbit1 giờ trước

Ghi chú podcast | Trò chuyện với Giám đốc quản lý tài sản của GSR: Đợt tăng giá tiền mã hóa này là thật hay giả, hãy theo dõi lãi suất cho vay trên Aave là biết ngay

marsbit1 giờ trước

Giao dịch

Giao ngay

Bài viết Nổi bật

Làm thế nào để Mua HYPE

Chào mừng bạn đến với HTX.com! Chúng tôi đã làm cho mua Hyperliquid (HYPE) trở nên đơn giản và thuận tiện. Làm theo hướng dẫn từng bước của chúng tôi để bắt đầu hành trình tiền kỹ thuật số của bạn.Bước 1: Tạo Tài khoản HTX của BạnSử dụng email hoặc số điện thoại của bạn để đăng ký tài khoản miễn phí trên HTX. Trải nghiệm hành trình đăng ký không rắc rối và mở khóa tất cả tính năng. Nhận Tài khoản của tôiBước 2: Truy cập Mua Crypto và Chọn Phương thức Thanh toán của BạnThẻ Tín dụng/Ghi nợ: Sử dụng Visa hoặc Mastercard của bạn để mua Hyperliquid (HYPE) ngay lập tức.Số dư: Sử dụng tiền từ số dư tài khoản HTX của bạn để giao dịch liền mạch.Bên thứ ba: Chúng tôi đã thêm những phương thức thanh toán phổ biến như Google Pay và Apple Pay để nâng cao sự tiện lợi.P2P: Giao dịch trực tiếp với người dùng khác trên HTX.Thị trường mua bán phi tập trung (OTC): Chúng tôi cung cấp những dịch vụ được thiết kế riêng và tỷ giá hối đoái cạnh tranh cho nhà giao dịch.Bước 3: Lưu trữ Hyperliquid (HYPE) của BạnSau khi mua Hyperliquid (HYPE), lưu trữ trong tài khoản HTX của bạn. Ngoài ra, bạn có thể gửi đi nơi khác qua chuyển khoản blockchain hoặc sử dụng để giao dịch những tiền kỹ thuật số khác.Bước 4: Giao dịch Hyperliquid (HYPE)Giao dịch Hyperliquid (HYPE) dễ dàng trên thị trường giao ngay của HTX. Chỉ cần truy cập vào tài khoản của bạn, chọn cặp giao dịch, thực hiện giao dịch và theo dõi trong thời gian thực. Chúng tôi cung cấp trải nghiệm thân thiện với người dùng cho cả người mới bắt đầu và người giao dịch dày dạn kinh nghiệm.

Tổng lượt xem 660Xuất bản vào 2024.12.11Cập nhật vào 2026.06.02

Làm thế nào để Mua HYPE

Thảo luận

Chào mừng đến với Cộng đồng HTX. Tại đây, bạn có thể được thông báo về những phát triển nền tảng mới nhất và có quyền truy cập vào thông tin chuyên sâu về thị trường. Ý kiến ​​của người dùng về giá của HYPE (HYPE) được trình bày dưới đây.

活动图片